TOTAL2 - Fib and Channel Support0.786 fib shows a strong support point with prices continually being rejected to the bullish side
As price has dumped to this level I ask will this bump back up again as it has in the past?
This dump can also be plotted in with a long channel of the bull run we have been having, showing support at the bottom of the channel.
I'm still bullish over this temporary retrace
TOTAL2

TOTAL2 MARKETCAP ALTCOINTOTAL 2 ~ 1W
#Altcoin season it's still very early. Don't say you sold your AltCoins for only a small profit.
AltCoin's MarketCap is around $2T - $3.5T, Currently around $1.61T.

bitcoin hits 749k into 2025.gm,
in previous cycles, the duration from cycle low to cycle high has typically been roughly 1,000–1,100 days. currently, we are 742 days in, which suggests we still have about a year until the "expected top." this projected top also aligns with the global liquidity index in q4 of 2025.
the way i interpret this current structure is straightforward:
from the november 2022 low to the march 2024 high, the price action visually resembles five waves up. this is followed by a clean three-wave correction into august of 2024.
from the low in august of 2024, bitcoin appears to have formed a clean five-wave impulse to the upside and is now approaching a top. in theory, once this top is established, we should expect a three-wave corrective move to backtest the previous support. this support corresponds to the 2021/2024 highs and the previous accumulation zone.
hypothetically, backtesting the prior supply zone would likely liquidate many late long positions, providing a full sentiment reset. this reset could allow bitcoin to rebound with significant force, potentially reaching unprecedented levels.
my estimated upside target for q4 2025 is approximately $749,000.
✌️
ps. in my last bullish trade, i pulled at 9,000% trade on btc... and 42 alt trades, some of which ran as high as 22,000%.
view last bull post here:

More proof Goldencross works immediately in this phase of bullJust like the char I posted before this one, I’m posting this simply to lllustrate how the golden cross (orange line crossing above the blue line) immediately resulted in a very pivotal bullish pump that coincided with a major fulcrum point on the chart recently on multiple different charts. More times than not in the other market cycles, when a golden cross occurs it usually takes a few weeks afterwards to know whether that cross will have its desired outcome or instead end up being a fakeout but lately I’ve noticed multiple charts have seen an instantaneous pump on the exact day of the golden cross, which is making me think that once we enter the 2nd parabolic phase of a bull market that that is when you can anticipate a golden cross to have its immediate intended effect its suppose to have with much much higher probability than all the other market phases including even the 1st half of the bull market. Anyways I wanted to illustrate that hypothesis here with the XLM chart as you can clearly see it’s a text book example, and I will try to put a link below to the previous example where this occurred as wel a link to the total2 chart which will have its golden cross in the next 102 daily candles.l One major reason I want to illustrate this is because within the next 1-2 daily candle closes the Total2 (aka altcoin market) chart is going to have its golden cross and it is currently trying to confirm the breakout upward from a cp and handle pattern which is a huge fulcrum point for it. So should the trend of instantaneous golden cross pump effects occurring the same daily candle as the cross itself, this could clue us into exactly when the real full on alt season will be about to kick off (which if correct, will be ignited by a big confirmation breakout pump within the next 1-3 daily candles). *not financial advice*

#Altcoins super cycle has just begun!#Bitcoin dominance monthly rising wedge breakout and breakdown completed!
#Alts market capitalization OTHER TOTAL3 AND TOTAL2 The breaking and closing of the handle cup formation that formed on a monthly basis has been completed.
We are moving towards #Altseason in an environment of Denial and Disbelief!

Biggest #Altseason coming!The alts market total of total2 The mega Altseason process, which started in November 2020, has started again as of November 2024.
#Alts parabolic run started in November!

A Look Again At RSI The RSI is beginning to print very bullish horizontal movement that is the print of a bull market
The left hand side of this pattern is already printed, with the white vertical line being the middle of the pattern, now what is emerging is the right hand side of this larger structural pattern on the RSI, also indicative of a bull market.
Early 2025 is going to be very bullish.
Little white circle is where we are now corresponding to the last pattern if they evolve relatively the same.

Analysis of TOTAL2 TargetsAs we can see, the overall trend is bullish. After breaking the March high, the only remaining step for the market to truly thrive is to break the most recent peak and form a new high. There is only one direction now: upward.
The potential paths for this upward movement are as follows:
Scenario 1:
A pullback to the 1.27T level followed by a strong continuation to the upside.
Scenario 2:
A direct upward move without any significant correction.
Potential Milestones After Breaking the All-Time High:
2.11T
3.57T
11T (final target)
The market is showing promising signs of strength, and these key levels could be the focus for the next phases of growth.
Let’s keep a close eye on price action and prepare for what’s coming!

Crypto Total Market Cap (Excluding BTC) Weekly Chart Analysis
The chart reveals a multi-year symmetrical triangle pattern, with a decisive breakout above the resistance trendline. This signals a potential shift toward sustained bullish momentum.
The breakout aligns with increased market activity (volume not visible but inferred), indicating robust participation and validation of the upward move.
The price action is comfortably above the weekly 50 EMA (yellow line), acting as a dynamic support and confirming the strength of the bullish trend.
$1.39T (previous resistance now flipped into support).
Minimal resistance ahead until the psychological $2T zone, with the potential for all-time highs.
If the breakout holds, the measured move from the triangle's base suggests a target range of $2.5T—$3 T, marking substantial upside potential.
Continued consolidation or retest above $1.39T could trigger an extended altcoin rally, propelling the market to new highs.
Bearish Scenario:
Failure to sustain above $1.39T might lead to a retrace within the triangle, stalling bullish momentum.
Disclaimer: This analysis is for informational purposes and is not financial advice. Always stay updated with market movements and adjust your trading strategies as needed.
You can DM us for information on any other coin.
@Peter_CSAdmin

Altcoin Market at a Key Level – Breakout or Pullback? | TOTAL2
Hey traders! 👋 The altcoin market cap (TOTAL2) is at an exciting turning point as it tests the **0.236 Fibonacci retracement level (~$1.33T)**. This level has been a key resistance in the past, and the market’s behavior here will likely decide the next big move. Let’s break it down:
What’s Happening?
🔹 The market is testing **$1.33T**, which has been a tough resistance zone historically (see those red circles).
🔹 Strong volume recently suggests growing bullish momentum, which could help push through this level.
🔹 RSI shows the market is nearing overbought levels, so it’s worth watching for signs of either a breakout or a pullback.
**Possible Scenarios**
🚀 **Bullish Breakout**:
- A weekly close above $1.33T could signal that the market is ready for its next leg up.
🛑 **Rejection/Pullback**:
- If the market gets rejected, there may be opportunities to re-enter at lower levels, especially near key support zones.
**Key Takeaways**
📈 Altcoins are showing signs of strength, but this is a critical resistance to watch.
⚡ A breakout could lead to a strong move higher, while a rejection may offer better opportunities on pullbacks.
What do you think? Is the altcoin market ready to break out, or is a pullback more likely? Let’s discuss in the comments! 💬

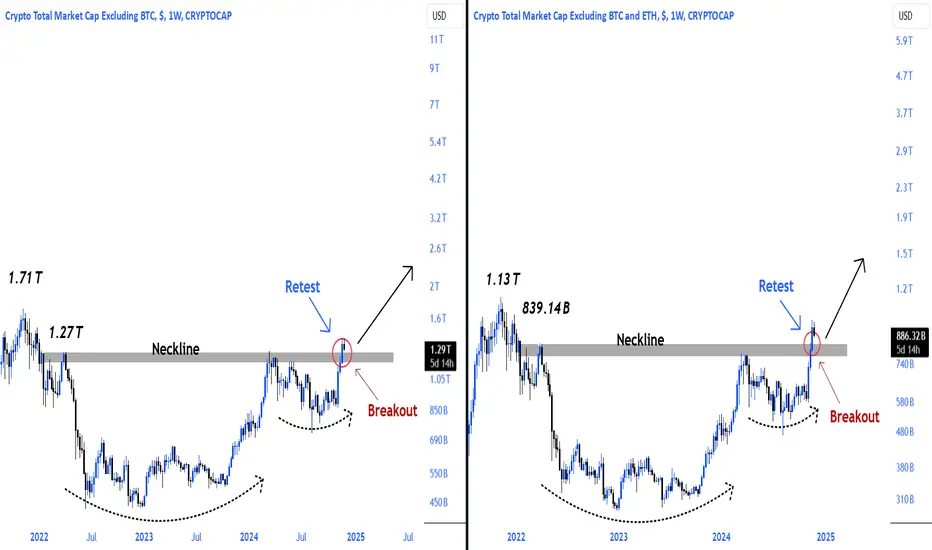
Alts market Cap TOTAL2 and TOTAL3 retest done!#Alts market cap TOTAL2 and TOTAL3 handle cup neckline area and major resistance area were retested.
TOTAL3: 839.14B breakout and retest
TOTAL2: 1.27T breakout and retest
#Altcoins hard send is coming!

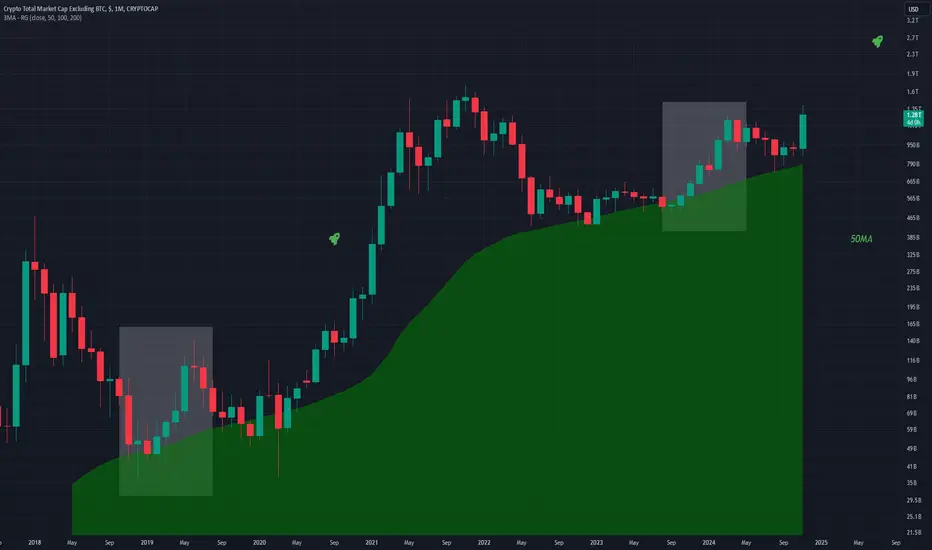
TOTAL2 - Monthly MA Intact Each move in white is the beginning of a bull run, a move that shows strength followed by a short term move back down towards the 50MA.
The MA acts as support and allows the TRUE breakout to be revealed, we will see the bullish action for real in 2025.
What are your thoughts on how high this altcoin chart will go on this Monthly chart?
#Altcoin major run has just begun!#Alts market cap TOTAL2 handle cup pattern neckline break and retest followed by major run will be inevitable!

Alts market cap Total2 and Total3 retest week#Alts market cap TOTAL2 and TOTAL3 retest after successful weekly major breakout!
#Altcoins will send hard after Retest!
#Altcoins run it back!#Alts market cap TOTAL2 and TOTAL3 breakout and closing was made on a weekly basis at the level corresponding to the March April 2022 and March April 2024 major resistance area and also the handle cup formation neckline area.
#Altseason is approaching!

Altcoin Rally on the Horizon? Watch This Level!The total crypto market cap excluding BTC (Total 2), currently in a downtrend within a descending channel. It recently broke through a key resistance zone Blue at 962.013B - 976.72B mark. The green projection suggests a potential breakout from this channel, with a bullish target near 1.271T. If the breakout holds, it could signal a strong uptrend and potential alt season ahead.

Step by step towards #Altseason#Altcoins are just starting to wake up!
#Alts market cap broke the TOTAL2 $1.27 trillion level, which was the major resistance on March 2024, and also the neckline of the cup handle formation, will move towards the all-time high of $1.71 trillion after the weekly close and retest!

Golden Cross kickstarts Altcoin SeasonExactly as I was predicting it would just as it did for total2, xlm, and quite a few other crypto charts recently. I expect the trend will continue. I will link the hart to the total2 cup and handle we seem to have confirmed the breakout from below. *not financial advice*

TOTAL2 - Bullish Breakout, Alt Season Could Be Upon UsTotal Crypto Market Cap excluding Bitcoin. Alts may be ready to explode!

TOTAL2 - Still BullishI am still very bullish on alts, more than I am on BTCUSD.
A divergence is occurring where the RSI on this hourly timeframe is moving downward while price is trending upwards. This is a bull sign.
Alts pumping around the board.

Tic... Tock... #Altcoins #Alts market cap #TOTAL2 -weekly falling trend breakout has been completed and will start the major uptrend wave after the retest.
We also witness a transition from the RE-ACCUMULATION phase of the wyckoff cycle to the MARK-UP phase.
#Altseason process will happen there sooner or later!

A close up of the bullflag forming above c&h rimline on total2The red line is the rimline of the Total2 chart’s cup and handle pattern that I made a post about a few days ago and will link at the bottom of this post. I thought it would be a good idea to include a close up of this bull flag that is forming with that redline mostly serving as support here so it would be easier for people to see when the breakout from the cup and handle will be validated. Once we have solidified the red line as support long enough we will validate the breakout from the cup and handle. One thing that will greatly increase the probability that w will validate that breakout is by first valdating the breakout up from this smaller bullflag pattern that has been forming here, you’ll notice that we are also about to have a golden cross (when the orange line crosses above the blue line ). We are now just one to two days away max from that cross happening and I would not be surprised if the pump up from the bullflag that validates it’s breakout occurs the same day the golden cross occurs, as I have already seen that happen immediately on the golden cross in two other chart recently, and it usually tends to do so once we have entered the parabolic phase of the bull market. If we do we will simultaneously validated both the breakout from this bull flag and mostly likely validate the breakout from the more macro timeframe Cup and handle pattern as well. I will link the chart I posted a few days ago showing the full cup and handle pattern down below. We’ve already seen a slight bit of a precursor already in the market but once the cup and handle validates its breakout, it is officially alt season. *not financial advice*

Moving Average Positions (50,100,200)Normally when bear moves arise the 50 and 100 are above the 200 as there is more room for a downward move than an upward one.
Right now the 50 and 100 are BELOW the 200, which suggests that they have more room to move up ABOVE the 200MA in red, which would happen during a bull move.
Observation of the MA's
Comment if you think otherwise !
Daily timeframe
