ALTCOINS total2 update; zoomed in short term pivotALTCOINS total2 update; zoomed in short term pivot
Care with leverage here / stops
looks dubious.
cmon bulls show us your balls.
TOTAL2

Altcoin Season! C&H pattern can take altcoins to 2 trillion!Price action has now finished the handle on the total2 charts cup and handle as well as closed a Daly candle above it. Now we need to close a weekly candle above it and make sure we’ve flipped the rimline to solidified support so we can trigger and validate the breakout. If so the measured move line takes price to a target of 1.99 trillion! The journey to that target would make for one unforgettably epic altcoin season no doubt. *not financial advice*

TOTAL2 - Way UpUsing bars pattern and a curved trendline to plot a way up towards the stars for the altcoin market after Bitcoin finishes its move and lets alts to clean this up.
Very bullish right now.
Daily chart

Provides analysis of cryptocurrency market cap (CRYPTOCAP)The red line shows the 50-week moving average, which appears to be a crucial support level for the overall trend. Historically, the market cap has respected this moving average, with upward momentum when trading above it.
This area acts as a strong support level, as it has historically provided a solid foundation for price recovery. The total market cap has rebounded from this level several times, indicating buyer interest.
This is a crucial resistance level, as the market has reversed from this area before. If the total market cap approaches this area, selling pressure may occur.
The white diagonal line shows a long-term ascending trendline, suggesting a steady upward trend since 2018. This line further strengthens the overall bullish trend, as long as the total market cap stays above it.
Currently, the total market capitalization is testing the 2.728T level, which is close to recent highs, with a possible bounce if it breaks above the red resistance zone.
The overall outlook appears to be bullish, but it is essential to keep an eye on any significant moves around the resistance zone and the 50MA, as these will influence the long-term trend.
Disclaimer: This analysis is for informational purposes and is not financial advice. Always stay updated with market movements and adjust your trading strategies as needed.
You can DM us for information on any other coin.
@Peter_CSAdmin

ALTS ARE ABOUT TO MOONWeekly close is happening tonight and the RSI AND TSI are both making positive divergences. RSI is clear to soar as it s breaking out of the cup and handle pattern. TSI just created a cross that is very rare and has a high success rate. New all multi-week gains are around the corner.
NOT F.A.

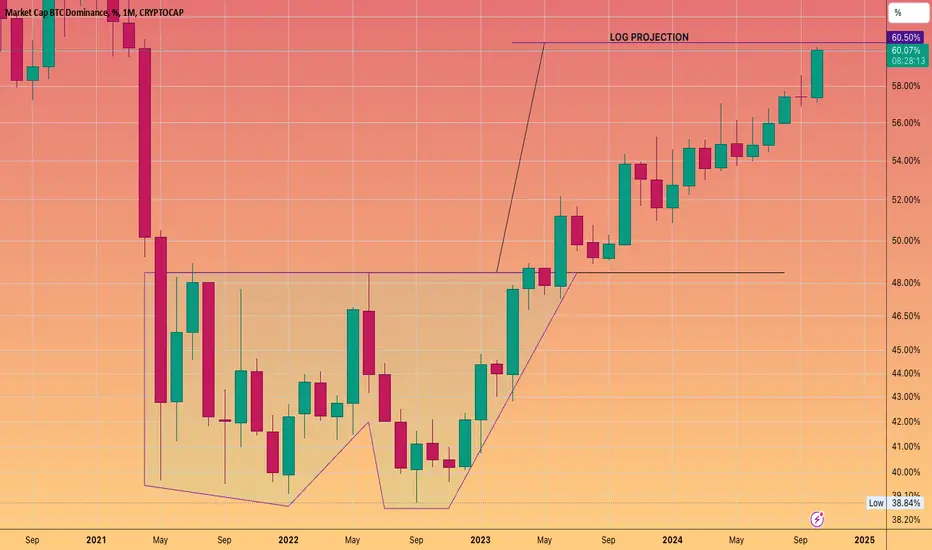
$BTC marketcap critical point, signaling the alt season coming.CRYPTOCAP:BTC has reached a critical 60% dominance level, which in the past has often signaled the start of an alt season. While history doesn’t always repeat itself, several other indicators confirm this signal:
- Stochastic RSI is highly overbought
- Bearish divergence
- MACD is also in overbought territory
Based on my analysis, altcoins are likely to see some relief in November, potentially pumping and outperforming $BTC.

BITCOIN DOMINANCE about to hit double bottom target.Let's see how it reacts once there
Does it pus on through
tap it
does it consolidate
or start its reversal
Total 2This chart of the total crypto market cap (excluding BTC) shows a symmetrical triangle pattern within a broader descending wedge. Price is near the triangle’s upper resistance, suggesting a potential breakout or breakdown. The Blue resistance zone is very important to flip for bullish moves.
Everything is on the chart

TOTAL2 - Bullish Going Into Christmas Going to see a breakout from this long down channel we have experienced
I have shown this breakout with the bars pattern tool in green
The down channel is finished in this view.
4Hour chart

Ethereum can't escape from bear grip, targets $882 firstThe price of the second largest cryptocurrency can't raise its head to catch up with
elder brother Bitcoin.
I detected three signs that the bear trend could resume soon.
1) price broke below 52-week (past 1 year) moving average and during retest it failed to break back above it;
2) RSI is below 50, bearish, also retested the resistance and failed either
3) clear consolidation on the price chart, which implies the resumption of primary downtrend
The price could retest the bottom of the first leg at $882.
The ultimate target is to complete the full cycle and touch the very bottom of $78, which, indeed, sounds apocalyptical.

TOTAL2 - Down Channel BreakoutDrawn is a down channel on the 4hr chart for TOTAL2 which is the altcoin market cap.
I think this down channel is currently trying to be broken with a break up.
Very bullish heading into November and Christmas period.

TOTAL2 Update - Oct 27 2024Following previous analysis, TOTAL2 dumped and moved towards the lower trendline.
Although the trendline got broken, 12H candles closed on the trendline so the mentioned trendline is still valid but 4H analysis suggests that TOTAL2 is probably gonna cross below it.
TOTAL2 is facing the combined resistance of blue descending trendline and 0.618 Fib ret. of the previous drop, so it's possible to see another dump in the market over the next couple of days.

Two Charts to Watch to Time the Crypto Cycle Top Here I have the TOTAL2 chart overlaying the BTC market cap chart.
- Black: BTC
- White: TOTAL2
- Yellow vertical lines: BTC Halvings
The main alpha here is identifying the moments where TOTAL2 > BTC. This means the rest of crypto is valued greater than that of BTC, people are going further down the risk curve to seek greater returns, and peak euphoria has set in. Crypto markets top after BTC has made its run and once the alts, memes, and more degenerate activities soar following the rise in BTC.
At the bottom I have plotted the relative strength between BTC and TOTAL2 (Black line) which shows that once BTC begins to lose strength to TOTAL2 (a dip below the zero line) then the top is imminent. Currently we are well above the zero line and far from the negatives which indicates to me lots of time/ room left in this cycle for appreciation (if you're in the camp of the bulls).
I have also included a YOY rate of change (white area plot) showing the sharp increases in the ROC at the tops. currently we look very flat yet positive which is very similar to that of late 2016 and early 2017.
There is not much historical data so this could be invalidated easily, but the similarities from the past two 4 year cycles is significant enough to form an idea on when profits should be taken if you so desire.
Here is a chart of BTC-TOTAL2. This chart shows the delta between the two with a clear megaphone thing going on. The alpha here is that once that ratio dumps significantly that indicates the rotation away from BTC and into the more speculative side of the crypto market.
An increasing megaphone trend this chart is showing makes sense due to the natural rise in market cap the entirety of crypto experiences. It's kind of like an average true range of the delta between the two. The swings in the ratio will widen the more the market cap increases.
I wouldn't use these as trading indicators but rather as a guideline for sentiment and when it might be wise to be super risk on or more risk off.
My belief remains that we see a big pump next year with a sustained bull run up until Q4 of 2025 and Q1 of 2026 based on previous cycles in equities and crypto.

TOTAL 2 breakout soon!!I believe we're headed for one more dip in altcoins before we break out of this triangle pattern, potentially targeting a market cap of $1.6 trillion. This could lead to 3x to 6x gains across the altcoin space.
We're currently in the final stages of the Wave 4 pattern, and as it concludes, Wave 5 is set to emerge as the next phase.

TOTAL2 - Finishing This Structure and BreakoutThis is the altcoin market cap chart on the daily
Suggesting a reversal out of this period of downward movement seen since april
Perfect with uptober and christmas time aswell as aligning with the US election
Still more of this bull run to come

Back to Red! Morning folks,
I figured I'd share this with you guys.
Been getting the signals that this scenario is highly likely to happen.
Huge possibility of lower prices before 2025 explosion!
Buy RED!
Trade thirsty, my friends!

#ALTSEASON is Coming! Don't Fall for the TRAP!I'll keep it brief—it’s all in the chart. TOTAL2 is simply retesting after breaking above the 50-weekly EMA, a historically strong signal for timing altseasons. The falling wedge pattern should break in the coming weeks with an impulsive move.
Current price action seems like a shakeout, pushing out weak hands right before the major rally everyone’s been waiting for.
This is not financial advice—DYOR—but IMHO, this is the worst time to give up. Being out of the market is riskier than holding, no matter how down your altcoin bags are.
Cheers!
Hit the like button If you like it, I'll be sharing more altcoin charts soon. Stay tuned!
#PEACE

The Altcoin Market Is Now Flirting With The 350 DMA ...Again!Here's what that means. A long-term view.
Traders,
The pressure is on for these altcoin bulls to run through the end of the year. However, we are flirting with disaster this time around. Here's why?
From the beginning, the 350 DMA (or 50-week MA) has always told traders whether we were in a bull market or a bear market. Though periodically, the price did stick its proverbial head above the 350 DMA during mid-cycle tops, these were always very short-lived. And it's always been the case that when we've remained above the 350 DMA for this length of time, in this case since Nov of 2023, it signaled we were in a bull run, as opposed to a mid-cycle top. Could this time be different? Well, of course. And I think from looking at the charts, it already has proven it is. This whole run is different.
I won't get into the many ways this cycle is different, but a big one has to do with how the 111 DMA is diverging from the 350x2 DMA (not pictured here). That's never happened before along with a multitude of other occurrences. So, let's explore this thought experiment a bit further. There are several outcomes that we most probably are looking at.
The first outcome could mean that this run was simply an extended mid-cycle top. If true, then this is a much longer mid-cycle top than we have ever witnessed in the history of crypto. And if that is true, the bull run that is coming will melt faces. But it probably would not arrive until next year or even 2026 and it probably means that we dip back under that 350 DMA again for a while. Nobody wants this to happen and nobody seems to be expecting this outcome. Could this then be the strongest possibility? If we anthropomorphize the market a bit, we can observe that it is rather sadistic in this regard. It always has been and probably always will be. The market just enjoys hurting the largest crowd. This is why it's often beneficial to entertain contrarian thought and not to simply dismiss it altogether.
The second outcome is not so good. It could mean that we skipped our mid-cycle top completely and that our bull run is about to end if we dip below that 350 DMA. Now, there is still hope here because we haven't done that yet. But I certainly do not like the looks of how we have been flirting with that line for these last several months. This moving average is critical! Watch it closely on both the daily (as a 350 DMA) and on the weekly (as a 50). The weekly will confirm whether we drop or not. It must be confirmed with two candle closes below on the weekly.
There is a third possibility. This is the one that I think we are all hoping for and, tbh, most are expecting. It also indicates that we skipped our mid-cycle top and are in a bull run that will not end until late this year or into the next. This would mean that we will remain above that 350 DMA (though, there could be a few candle closes below) and that we should see some new highs being made through the end of the year.
I kept our chart on the daily view as opposed to the weekly because I wanted you all to track that bullish triangle with me. Notice how we are retesting the top of it as we should after a breakout. This is technically very sound. But also notice how that 350 DMA is moving up to lend some support. What a beautiful area of confluence! But also, scary. Because if it's broken to the downside, it may indicate either another Black Swan event on the horizon OR we don't get the bull run alts were expecting.
It is do-or-die time now. Let's go.
Stew

TOTAL2 - BullflagBullflag within the white lines.
Bullflag is just a continuation pattern within a larger bullish structure.
Market should be above 1T easily.

ALTCOIN MARKET UPDATEALTCOIN MARKET UPDATE
this is the bullish option obviously. that long term momentum looks,,, well placed. nicely shaped.
zoom in for various fractals; will be tracking them to see which one fits best but they share quite a few key targets.
that is if the bull is in control here.. pretty convinced.. guess it depends on the US election, ukraine etc
gl

TOTAL2 market bullish. Altcoions are back in the game
The first 30% of this bull run has been dominated by the CRYPTOCAP:BTC and ETF narrative. A massive FOMO, unprecedented, has propelled CRYPTOCAP:BTC beyond its all-time high (ATH) even before the halving. However, when retail investors began purchasing at prices above 70k, smart money decided to take profits, leading us into a downtrend for BTC.
We are now witnessing the end of the ETF-induced FOMO for Bitcoin and a return to a fundamentally stronger bull run.
Adjusted for inflation, we are actually only 30% into the bull run cycle, just after the halving and before the parabolic move of BTC. This retracement might go lower, as the expectations for the ETF were so high that the retracement could be quite substantial.
Is it time to sell all your BTC and wait with cash for the bottom? Some might do that, but there is a risk: missing the recovery. Everyone has to sleep, and this can happen in hours.
Some smarter investors have noticed that the altcoin market has basically been stagnant, with a 100% increase while BTC was soaring by 300%, and has been largely ignored because the focus was all on BTC and the unrealistic ETF expectations.
These smart investors are seizing the opportunity to buy great projects at bargain prices and are poised to make substantial profits. Money is moving from BTC to altcoins, and I believe this trend will continue, since BTC lacks a compelling narrative.
While BTC is resetting and gearing up for the final parabolic move, altcoins will become very attractive, and smart money will invest in solid projects, memes, and everything else that has been overlooked.
I predict we will have two altcoin seasons, one starting now while BTC is resetting, and another after BTC reaches its peak and begins to fall into a bear market.
Investing in solid and low-risk altcoins like CRYPTOCAP:PEPE , SEED_DONKEYDAN_MARKET_CAP:BONK , CRYPTOCAP:SOL , CRYPTOCAP:AVAX , CRYPTOCAP:INJ , NASDAQ:OP , NYSE:SUI , CRYPTOCAP:RUNE , etc., should be more rewarding than buying CRYPTOCAP:BTC in the next two months.
This is not investment advice, merely an opinion. Do your own research (DYOR), and remember that anything can happen in the highly volatile crypto market.

TOTAL2 - Altcoin marketcap is reversing#TOTAL2 #Analysis
Description
---------------------------------------------------------------
The altcoin market cap experienced a significant drop from $1.2 trillion to $845 billion, and the current chart indicates that it is hovering around the support zone. This drop was anticipated following a substantial increase from $500 billion to $1.2 trillion, representing a more than 100% surge in the overall altcoin market cap. It is expected that the overall altcoin market cap will rebound from this support zone, with the next target being $1.7 trillion.
---------------------------------------------------------------
Enhance, Trade, Grow
---------------------------------------------------------------
Feel free to share your thoughts and insights.
Don't forget to like and follow us for more trading ideas and discussions.
Best Regards,
VectorAlgo

Total2 path to 6 trillion dollars .Afternoon folks Mastershark here with a new TA about total 2 . History doesn’t repeat but it often rhymes. We see some similarities in Rsa behaviour for the previous cycle and the recent one. A pitchfork with some levels will explain a giant channel that we hit the level right below ath and we’re consolidating right beneath it . type of behaviour i see is to get ready and attack the previous high once more . In my opinion we will have some struggle with ath and will break it for close to 6 trillion dollars for altcoins mc which is extraordinary .
I don't see anymore lows except if we fill the shadow once more .
I put my tp in the chart and since we have a long journey ahead i think we might have two tops ( once everyone get off the boat we go higher ) .
Anyway thanks for reading and remember its NFA and always DYOR .
stay safe fam , see you at the top.
