TOTAL2 - Familiar Bottoms The bottom formation on TOTAL2 is something that has been seen before
At the beginning of the run TOTAL2 skyrocketed from 42M to 424B. I expect this to happen just on a slightly different scale.
It may stay within the green channel that I have drawn.
Very bullish right now.
TOTAL2

ETH Leads the AltsTraders,
Sorry for the infrequent posts lately. I have been feeling under the weather. But TBH, it was good timing. As stated in my previous post, I expected alts to draw back 10-15% or more pending indications. So far, I think it's safe to say we've had our 10-15% pullback. Now, the question remains, will that steep ascending TL I talked about seeing on all of the altcoin charts hold. For ETH (as well as some other alts) it has not. And if Eth leads the alts, which it does, we can still expect more pullback. But how much?
There are a couple of things to look at here on this chart:
#1 Will our support at 2120 hold?
If that 50 day SMA comes up to help, it just might. However, to gain a broader context and therefore, a more accurate current scenario, it helps to visit some other charts to understand what's going on here.
First, let's take a look at Tether Dominance:
You will observe most importantly that Tether dom has broken an import TL on the RSI to the upside. This most likely means that traders are currently selling mostly BTC and also large cap alts but are NOT going back into mid to low-cap alts. They are staying in stable and will probably continue to do so for a short time.
Total2 is also giving us possible clues here:
You can see that though Total2 has not yet broken that steep ascending TL, it's now looking more probably that it will. Why? Well because it is more probably that we retest previous major resistance (that big red Level of support) than that we hold current support.
From a technical perspective, a retest of our previous resistance is highly probable and quite honestly, needed, for further continuation to the upside.
#2 That level on the RSI is starting to be broken. Now, it may hold by the time the candle closes today, but this is something we must watch closely. Remember what I said in the last video? These levels on my RSI charts are currently acting as lead indicators for the price levels on my charts. We saw that several major levels had been broken in my video, and that is why I was so certain we'd get this 10-15% pull back. Here again a good support level is current being tested and may break. So, it is possible that if it does our 2120 support would also then break. This would domino into alts for an even deeper retreat where we could start to look to buy long again.
So far, this has been a healthy little pullback. And I think we could see a little more before it's time to re-enter longs.
Stewdamus

"Heading: Altcoins on Track for $5 Trillion Surge by 2025"Anticipating a Massive Altcoin Season: Exploring Potential Growth in Market Cap
Introduction:
The cryptocurrency market is abuzz with predictions of an impending altcoin season that could lead to a staggering $5 trillion Altcoin MarketCap by 2025. This forecast is grounded in historical data, fractal analysis, and chart patterns, suggesting a pattern reminiscent of previous market cycles.
Historical Context:
Examining the historical data reveals intriguing patterns:
After the all-time low (ATL), it took 762 days for the Total Market Cap to surpass its previous all-time high (ATH).
If history repeats itself, a new ATH could be reached approximately 761 days from today, potentially around December 2024.
The last bull run lasted about 1066 days, and the current one is expected to span between 1071 to 1064 days.
Fractal Analysis:
The fractal analysis unveils a compelling narrative:
In 2014–2015, the market experienced 610 days of consolidation.
2016-2017 witnessed a parabolic rise in Altcoin MarketCap, hitting Extension 3.168 at around $400 billion.
2018-2019 saw another 609 days of consolidation before a breakout.
Currently, in 2022-2023, the market has undergone 548 days of consolidation, hinting at an imminent breakout.
Future Projections:
Building upon the historical context and fractal analysis, the projection for 2024-2025 unfolds:
Anticipating that Altcoin MarketCap will experience a surge, reaching Extension 3.168, estimated at $5 trillion.
The expected timeframe for this extraordinary surge is set for the period of September to October 2025.
Conclusion:
Considering the historical patterns, fractal analysis, and projected timelines, the narrative paints a bullish outlook for altcoins in the long term. The predicted Altcoin MarketCap of $5 trillion by 2025 suggests significant potential for growth and underscores the importance of keeping a keen eye on market dynamics in the coming years. As the cryptocurrency landscape evolves, investors may find compelling opportunities in the altcoin space, marking the potential for a substantial shift in market dynamics.

Alts are about to explodeThis is in continuation of analysis that a posted a while ago, regarding Pre-Halving Alt Season. Add link to that post in description.
--------------------------------------------------------------------------------------------------------------------
The top chart is TOTAL 2, (Market Cap of all the Alts) , Bottom chart is for BTC.D.
I have made a comparison and measurement of what happened to TOTAL2 when BTC.D hit the top trendline.
Things to notice each time BTC.D hits the trendline, there is lesser space for it to move down, hence lesser space for TOTAL2 to move up, it is evident from the % move in TOTAL2 Market cap,
First time BTC.D hit the descending trendline, TOTAL 2 exploded approx. 9000% by the time BTC.D hit the bottom trendline, 2nd time TOTAL2 Exploded 900% approx. , 3rd time which is now TOTAL2 is expected to explode 90%.
I have also measured the time it took for TOTAL2 To reach Peak during previous taps,
The first time it took 294 days, the 2nd time it took 175 days, using this trend we can anticipate Alts to be at their peak in the next 80 to 120 days i.e. During Feb end and March 2024 time frame.
This also falls in line with BTC cycles where, BTC and alts take a big dive down before Halving which is expected to take place sometime in April May 2024.
Also, apart from the evident rejection of BTC.D from the trendline we have Weekly Bear Divs on RSI, which were not present last time when BTC.D tapped the trendline, adds more weight to BTC.D breaking down from here.
What does all this mean in grand scheme of things
If we look at the chart of BTC.D, there is not much space left for BTC.D to move down and it will eventually break out of the pattern possibly with Bull divs on weekly, it will take time, months or a year, but after a consolidation at the lows it will move up. There is a possibility it can explode to the upside with no cap present, it can present danger to Alts run next Bull cycle which is expected to start post halving into 2025 End.

Here's What Needs to Happen Before I Grow Interested in AltcoinsTraders,
We've done great with 22 winning trades in a row, exiting just before this little pull back. I wanted to bring you a quick update to show you what I am waiting on before I grow interested in re-entries into my altcoins of choice again.
Stewdamus

Total3 Chart Analysis: Strong Resistance! 📉⚠️Today, let's turn our attention to the Total3 chart (excluding BTC & ETH), where a compelling narrative unfolds. The chart currently finds itself in a precarious position, trading within the vicinity of a significant resistance zone. Caution is advised, as potential corrections may be on the horizon. Here's an in-depth analysis of the chart dynamics and what to anticipate in the coming sessions. 📊🔍
Analyzing Total3 (Exclude BTC & ETH): Charting the Resistance Zone
Encountering Strong Resistance:
Critical Zone: Total3 is navigating a zone of formidable resistance, marked by historical significance on the charts.
Chart Context: This resistance is crucial as it has played a pivotal role in the past, influencing market dynamics.
The Challenge of Overcoming Resistance:
Testing Bulls' Strength: The current scenario poses a challenge for bulls, as breaking through this resistance demands considerable strength.
Potential for Corrections: The prolonged interaction with this resistance zone raises the likelihood of corrections or a pullback.
Anticipating a Retest:
Trendline Retest: The analysis suggests an imminent retest of the trendline previously breached by Total3.
Validation Check: A successful retest would validate the strength of the breakout, offering insights into the sustainability of the upward trend.
Cautious Approach for Traders:
Risk Management:
Protecting Gains: Traders should consider implementing robust risk management strategies to protect gains.
Volatility Awareness: Acknowledge the potential for increased volatility, especially around the resistance zone.
Watching Trendline Dynamics:
Retest Confirmation: A confirmed retest and subsequent bounce off the trendline would instill confidence in the continuation of the upward trend.
Failure Warning: Conversely, a failure to hold the trendline may signal a shift in market sentiment.
Conclusion:
Total3's encounter with a substantial resistance zone necessitates a cautious approach. Traders should monitor the dynamics closely, with a keen eye on the potential retest of the trendline. The outcome of this interaction will likely provide valuable insights into the market's next moves.
❗️Get my 3 crypto trading indicators for FREE!
Link below🔑

#ALTCOINS are about to surge higher than your expectation!#TOTAL2 : Altcoin market cap retraced to the local trendline support we plotted a few hours back. Continuation is highly likely from here.
Now isn't the time to be scared of the dip; these are opportunistic moments.
My plan: I don't want to buy in aggressively right now. Instead, I'll ladder in partially in case we hit the lower support of $630 billion.
#CryptoNews 📈

Are you playing your cards right? #ALTCOINS🚀Are you playing your cards right?🌟
Altcoins must continue to rise while #BTC either moves sideways or corrects and maintains a sideways trend.
I will not give up on my altcoins for 3x to 7x gains while it can go 50x to 100x!
The chart you see below this post is like a lottery If you know what I mean! Things have changed my friends and you need to go with the trend.
I will be focusing on the latest narratives that drive the trend, whether it's RWAs, Gaming, or AI.
You need to adapt to the trend.
💡 Let's learn from past missteps avoid taking random trades and move strategically.
Money is transient, but the next 2 years hold life-changing potential.
I'm dedicated to curating a portfolio of top-tier altcoins.
💡 If you are new, stop being degen, This is the best advice I could give you.
🔥 Bookmark this post!
Follow me and repost to know my carefully chosen altcoin picks.
Together, let's make the next 2 years not just profitable but extraordinary!
#altcoins

Altcoins are looking to pullback 10-15% soonMore of a caution here. Alt bulls are starting to lose a bit of steam here in overbought territory on the RSI. I can't go through all the charts rn but they are all looking fairly similar, overbought on the daily RSI and looking to test major levels of support on the underside. Do what you will with this information but for me personally (as my followers know), I have taken quite a bit of profit off the table yesterday afternoon and this morning. I have moved my stops up to be in the profit on most of my trades and as I look through my current positions I am considering more action to ensure I exit appropriately if we get this pullback the charts are showing.
Again, I don't expect anything major. As you all know, I have stated that BTC should be going sideways to down (at least according to the technicals) over the next few days to weeks. This will give ALTS a bit of a chance to catch up more. But before this happens, bulls may need to catch their breath.
Best,
Stewdamus

Alcoins- Is there still room for growth?Lately, many altcoins have risen above important resistance levels and gained a lot. So, a key question pops up: Can they still grow more? I believe so, and the chart shows why.
Looking at the chart, after hitting a low in 2022, Total2 CRYPTOCAP:TOTAL2 stayed in a range between 432 and 674. After the second resistance touch, it found new support at 500.
December started with a breakthrough above resistance, and now we are at 750 B.
With people feeling optimistic about the crypto market again, the most likely scenario is more growth.
As seen in the chart, the next big challenge is around 1 T, which is about 40% higher from where we are now.
To sum it up, the smart move seems to be buying altcoins when their prices drop (during corrections), especially near support levels. This way, you're in a good position for potential gains, going with the current market trends.

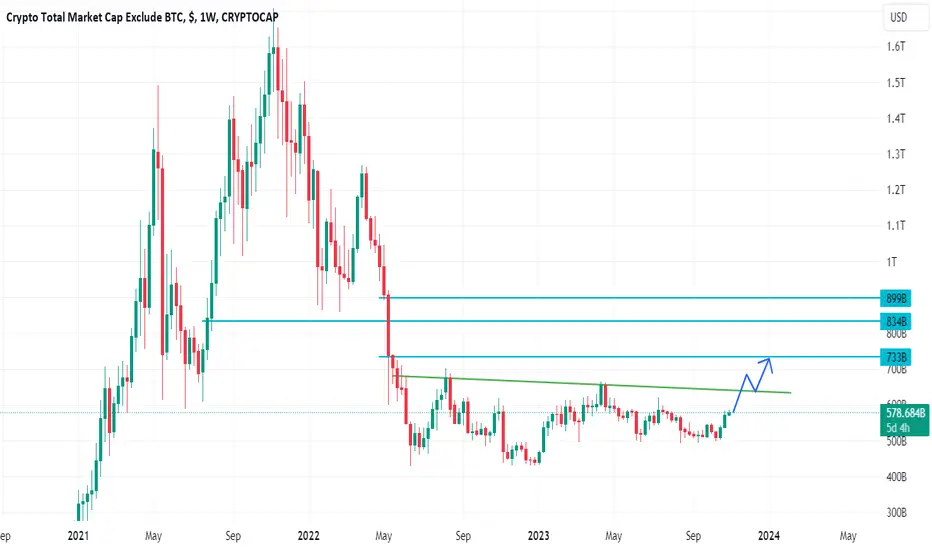
TOTAL2TOTAL2
TOTAL2 is the total market capitalization of cryptocurrencies, excluding the total capitalization of BTC.
On the chart, after a long accumulation since May 2022, we see the first glimpses of growth. 2 week green candles.
For further growth, we need to break through the green resistance and gain a foothold above it. After this we will be able to take the following targets: 733 - 834 - 899
If this happens, then we will see how all the alts will start shooting. In case of updates, we will definitely inform you.
Don't forget to show your support by like(rocket) and comment✅
TOTAL2 Crypto Market Cap Bearish StophuntCurrently, there is a Bearish 12H and daily stophunt on the TOTAL2 market Cap, which is TOTAL minus BTC.
TOTAL2 is not showing a 3day Bearish stophunt like TOTAL is showing..
Stay tuned; likely to be a bloody weekend, but it may present us with some opportunities.


BTC Bull Run (2021 vs 2023)A comparison of the position of the chart when Bitcoin rises in 2021 and the extent of the impact of the acquisition on the market when it falls after the rise to the same current price areas of 43k.
While thinking, I received an alert notification from Trading View with news that intersects with the current thinking
News About at tradingview
and it is from cryptopotato cryptopotato.com
Author: Chayanika Deka

🔥 Altcoins Most Bullish Since Summer 2022The total altcoin marketcap (which is the total marketcap minus BTC's marketcap) has reached a new high since the August 2022 top. With a BTC trading around 42k, it was a matter of time before rest of the market started moving upwards as well.
In my view, this is one of the most bullish things in the market since it has been overall just a Bitcoin party (check out the Bitcoin dominance for example). Let's see if we can convincingly break out of the ~1.5 years of accumulation.
For now, I'm looking at a near-term target of 860B and a 1.25T long-term target, which is essentially a 2x on the entire market. We will get there somewhere next year.
Things are looking great for crypto.

total2And in the case of Total 2, there is a heavy resistance range in this price, which can touch higher numbers if it is crossed. It should be noted that we have already identified this area where the price is located and we have updated it now.

ALTS Exciting time to be invested in the crypto market.The altcoin market is one of the markets that deserves our attention as we close 2023 and start the new year. We have been mentioning that on numerous analyses but the current idea couldn't display it in a simpler, yet more informative way.
As you see this is the total market cap excluding Bitcoin (TOTAL2) on the 1M time-frame. The 1M MA5 (blue trend-line) is about to cross above the 1M MA20 (green trend-line) and form the first such Bullish Cross pattern since April 2020. The only time besides this one that we had such pattern formed was on February 2016. What followed after both sequences was insane parabolic rallies, what is known in the market as 'altseason'. The 1M RSI patterns of the current and the previous Cycle are identical, starting with Lower Highs and now pointing to the exact symmetrical level of April 2020 as the RSI is taking off.
Insane alt season just starting?
-------------------------------------------------------------------------------
** Please LIKE 👍, FOLLOW ✅, SHARE 🙌 and COMMENT ✍ if you enjoy this idea! Also share your ideas and charts in the comments section below! This is best way to keep it relevant, support us, keep the content here free and allow the idea to reach as many people as possible. **
-------------------------------------------------------------------------------
💸💸💸💸💸💸
👇 👇 👇 👇 👇 👇

Looks Like ALTSEASON Is About To Start!By the looks of it Altcoins are going to have a mega partytime starting right about now!
Not financial advice but I would surely would like to have altcoin exposure now.

SUPREME TEST FOR CRYPTO MARKET!I am posting this #Chart for those who are too #BULLISH in the #Crypto market now!
1. Below I attach a Weekly chart on TOTAL.
I'm not going to explain what #TOTAL means, I recommend a research.
2.As you can see, this macro trend was broken and now the price has reached the retesting area of the trend line, which has now become a resistance + monthly resistance and the 0.5 fib level.
3.So here it becomes the ultimate test for the crypto market.
It is necessary for both resistances to be broken and confirmed so that breaking the trend line is actually a fakeout on a monthly basis.
4.A rejection from this point would mean less liquidity in the market and obvious corrections to measure.
I don't want to scare anyone, I'm not bearish, I'm simply following the evolution and price action.

ALT Season Is Starting - Total Market Cap 2MartyBoots here. I have been trading for 16 years and I am here to share my ideas with you to help the Crypto space.
This video and chart helps show you ALT Season is about to start.
The ALT Market is in its bottoming phase, be prepared. ALT Season is coming. This is the time when its possible to make life changing money .
Do NOT miss out on this coming bull market
CryptoCheck Team

Valuating BTC $461,265 & ETH $38,869 in 2024-25 (USD MODEL)
People pricing the market based on "Market Cap" on a new asset class that cannot be valued properly by a "Market Cap" need to check their models, I'm even more convinced something big will happen in 2024 as most Twitter comments (I've read thousands) are waiting for a 2025 (bull market) and think its completely out of the possibilities for the prices I have mentioned.
Cboe and institutions have expressed interest in Ethereum, and it's the only reason why I gave it a second look, even though I think the Ethereum Foundation is clueless. They're not going to be in control of Ethereum once they step in. My theory here is they don't want to pay to recreate a 'blockchain community'; they want to simply outright purchase Ethereum while it's cheap.
The current USDT market cap serves as a great proxy for assessing how much money can move the market. USDT is unique in that it's the only asset to which you can apply a proxy market cap, given its $1 = $1 circulating supply.
$17,362 billion or $17.36 trillion is the amount deposited in commercial banks in the USA. When comparing stable coins to bank deposits, the number varies, being 190-205 times larger than USDT. Yes, this is specific to commercial banking, highlighting that Tether (USDT) is much smaller than what many people perceive as 'real money' in the broader world of finance.
Let's run a simulation: once Spot ETFs are launched, and people participate in futures, it opens the doors for real banking and institutional money to access assets like BTC and ETH. To reach my price targets, a simple 9.85x increase in the money within this asset class is needed.
What does this indicate for the market caps of these assets?
Bitcoin: $9.0 trillion
Ethereum: $4.7 trillion
So, ultimately, Bitcoin will surpass in size, but in terms of performance, Ethereum has a chance to lead.
But is it impossible? Well, how does Bitcoin have a market cap shy of a trillion when there's less than 100 billion in stable coins? Additionally, not all of this is invested in Bitcoin. Indeed, market cap is a terrible metric, we still have retail money that moved Bitcoin by $10,000 on the thought of a Spot ETF approval.
If the Bitcoin spot ETF is approved before January 11, it's going to spark a FOMO rally from institutions, leading to inflows of potentially billions per week, and even billions per day
In addition to this, institutions will launch global marketing campaigns, and there will be daily TV reports on this asset class. Once the Spot ETF door opens to allow flows into this, you better have prepared your positions—I already have.
Larry Fink will talk about these assets but won't do internal & external marketing why?
he slipped up saying "crypto" is a flight to safety in October meaning he has done the same research and decided its go time.
hundreds > thousands ✅ 2010-2012
thousands > millions ✅ 2015-2016
millions > billions ✅ 2017-2019
billions > trillions ❔ 2023-2025

"Analyzing the Total Crypto Market's Breakout and Support Shift"Being a contrarian thinker, I often hold opinions that differ from the mainstream, whether it pertains to stocks or cryptocurrencies. I find myself venturing down an unconventional path, distinct from the majority.
The provided weekly chart depicts the total cryptocurrency market, excluding Bitcoin. Here are some key observations:
Price action has successfully broken free from a resistant trend line that had persisted for two years. This indicates a significant shift in market dynamics.
Furthermore, this former resistance has now transformed into a confirmed support level, a development that underscores the potential for continued positive momentum.
The mention of "10x" likely refers to a significant increase in value attributed to a wedge breakout. Additionally, the term "flag pole" suggests that the market's peak can be projected following the breach of previous resistance levels, akin to the early stages of the 2021 bull market.
However, it's important to exercise caution and remember that this upward trend may not apply uniformly to all alternative tokens (alt-tokens). In contrast to the past, where a broad approach could yield success, the current market demands selectivity. Therefore, it's crucial to make well-informed choices when navigating the market.
Regarding the possibility of further market corrections, while it is technically feasible, it is not deemed likely based on the presented analysis.
In summary, the analysis emphasizes the value of contrarian thinking and suggests a promising outlook for the cryptocurrency market, albeit with a need for discerning and selective investment strategies.
In the daily time frame, the total market capitalization for cryptocurrencies (often referred to as "TOTAL2") is currently in the process of breaking out of a symmetrical triangle pattern. From a technical analysis perspective, this breakout suggests the potential for a 50% rebound in the market's overall value, as dictated by the symmetrical triangle pattern. Symmetrical triangles are typically seen as continuation patterns, and their breakouts often signal the possibility of a significant price movement in the direction of the breakout. Therefore, the current breakout from the symmetrical triangle is being interpreted as a signal that the market's total capitalization may increase by approximately 50%. However, as with any technical analysis, it's important to consider other factors and perform comprehensive research before making trading decisions.
This chart is likely to help you make better trade decisions if it does consider upvoting it.
I would also love to know your charts and views in the comment section.
Thank you

TOTAL2 is About to Explode!The crypto market is abuzz with a significant phenomenon - the shrinking of the total market capitalization, excluding Bitcoin (BTC). Contrary to what one might expect, this contraction often precedes a major pump in the world of cryptocurrencies, signifying the potential for exciting price movements. 🌌💥
Unpacking the Market Cap Contraction
Market cap contraction is a fascinating occurrence, one that hints at the complex dynamics of the cryptocurrency market. When we talk about the total market capitalization excluding Bitcoin, we're essentially looking at the collective value of all cryptocurrencies other than the big BTC.
The Compression Effect: A Precursor to a Pump
Why does contraction matter? It's because, in crypto, this phenomenon frequently acts as a precursor to a "pump," a substantial increase in prices. When the total market capitalization of altcoins starts to shrink within a defined range, it often indicates that the market is preparing for a major move.
Anticipating the Upward Surge
For crypto traders and enthusiasts, keeping an eye on this contraction is vital. It suggests that exciting price surges could be on the horizon for the world of altcoins. Such periods of compression often lead to increased trading activity, resulting in significant price movements.
Trading Strategy: Positioning for the Pump
As this exciting market cap contraction unfolds, cryptocurrency traders should consider crafting trading strategies to harness the potential pump. The market dynamics may offer numerous opportunities to capitalize on these upcoming price surges.
Conclusion: Crypto's Dynamic Landscape
Understanding the nuances of the crypto market is crucial, and the market cap contraction phenomenon is one of its fascinating aspects. As we navigate this period of compression, let's remain vigilant, prepared, and ready to embrace the opportunities that a potential pump can bring.
🚀 Crypto Insights | 💡 Trading Strategies | 💰 Market Analysis
❗See related ideas below❗
Share your thoughts and insights 💚🌐💚
