TOTAL2 Moving Averages · This Bull Market Will Change Your LifeMarch 2024 signaled the end of a bullish cycle. After this month, the Cryptocurrency market went bearish. TOTAL2 index went bearish. As it was bullish, it traded above all the moving averages plotted on this chart. As it went bearish, all the moving averages broke as support but one, MA200. The back line on the chart.
MA200 works as support and denotes the broader and bigger cycle. As long as the action happens above this indicator, the market is growing thus bullish long-term. If the action moves below, the bears are in and winning.
Another strong moving average is EMA89, blue on this chart.
When TOTAL2 was bearish it managed to close only briefly below this level. One week and the next week back green. August 2024 and September 2024 TOTAL2 found support at MA200 and EMA89. As soon as these indicators were confirmed as support, we saw the development of a new bullish wave.
The altcoins market grew in November leading to a peak in December 2024. Here the same pattern repeats. TOTAL2 went from bullish to bearish. While it was bullish, it traded above all of the moving averages: EMA8, EMA13, EMA21, EMA55, EMA89 & MA200. As it turned bearish, all these moving averages were tested as support, all of them broke but one, MA200.
In April 2025 MA200 was tested as support and holds. As long as TOTAL2 trades above this level, we know the bigger broader market bias remains bullish. Bullish confirmed. As soon as this level was tested we had a small recovery above all moving averages, until May. Then a retrace led to a test of EMA89 as support and this level holds.
When TOTAL2 trades above all the moving averages, bullish confirmed.
TOTAL2 is now trading above EMA8, EMA13, EMA21, EMA55, EMA89 and MA200 on the weekly timeframe. Ultra-bullish and ready to grow.
Just as the December 2024 high was a higher high compared to March 2024, the late 2025 high will be a higher high vs December 2024. We are in a rising trend and this is confirmed because MA200 always holds as support.
Now that this level has been confirmed, we can expect additional growth. Instead of a single month of bullish action as it happened in late 2024, we can expect a minimum of 3 months of continued growth. In total, we will have at least 6 months, and then some more.
Because it is unexpected, this bull market will change your life, forever. You will receive more benefits and more blessings than anything you can ever imagine. All your hard work will pay-off. You will be rewarded for your patience, persistence and continued support.
Namaste.
TOTAL2

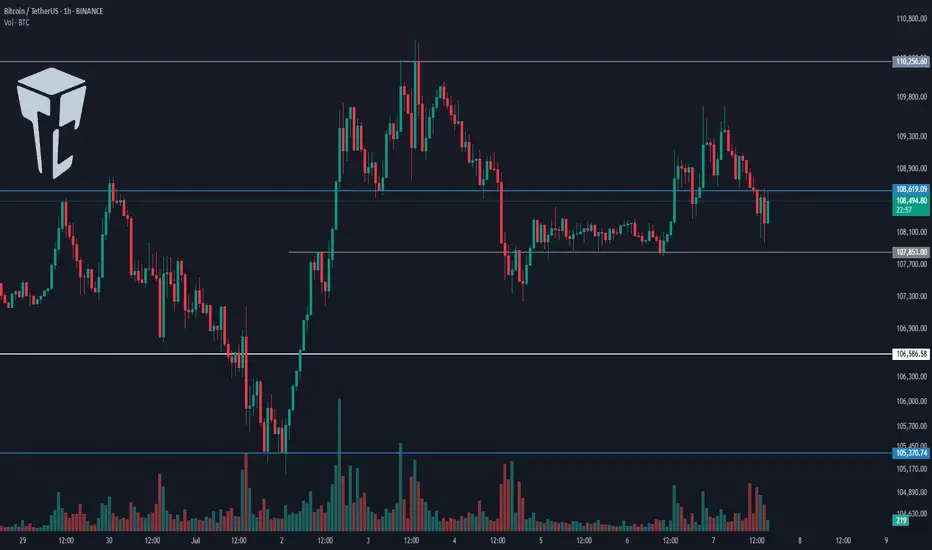
TradeCityPro | Bitcoin Daily Analysis #122👋 Welcome to TradeCity Pro!
Let’s dive into the latest analysis of Bitcoin and major crypto indicators. As usual, this update will focus on potential triggers for the New York futures session.
⌛️ 1-Hour Timeframe
On the 1-hour chart, Bitcoin is once again ranging between the 107,853 and 108,619 levels.
✔️ Last night, Bitcoin briefly faked out below the bottom of this range, so we now need to wait and see how the price reacts upon revisiting this area.
💫 I believe it’s best to hold off on entering a short position until we identify the precise location of the support line. As price retests this area, we can pinpoint the true support level.
✨ Once that level is confirmed, and if it breaks, a short position could be considered. The next support zones would be at 106,586 and 105,370.
📊 Make sure to watch the volume closely for this trade, and I strongly recommend waiting for a volume confirmation before entering.
📈 As for a long position, if 108,619 breaks to the upside, we could consider going long. The buying volume in the current upward leg is increasing, and if this trend continues, a breakout above 108,619 would make a long position reasonable.
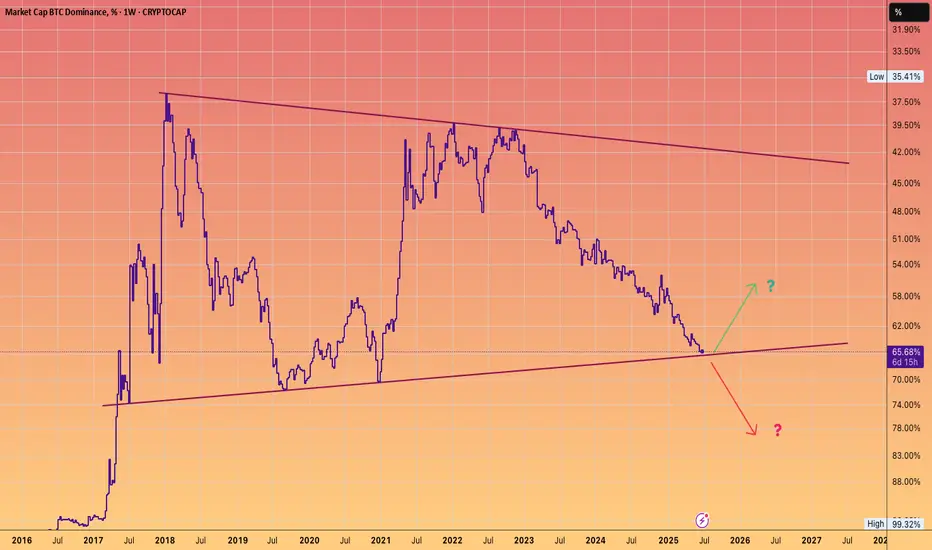
👑 BTC.D Analysis
Moving on to Bitcoin dominance — it has once again reached its trendline and is currently being rejected from it. If this rejection continues, BTC.D could decline toward 65.04.
🔍 However, if the trendline breaks, the 65.31 level will be the bullish confirmation trigger.
📅 Total2 Analysis
Now on to the Total2 index (altcoin market cap excluding BTC), it has bounced from the 1.14 support and is moving toward 1.16.
🔑 A breakout above 1.16 would serve as a bullish confirmation for long positions, with 1.17 acting as the main breakout trigger.
📅 USDT.D Analysis
USDT dominance is also moving downward and has reached the 4.78 support zone.
💥 A breakdown below this level would confirm a bearish continuation toward the 4.72 level..
❌ Disclaimer ❌
Trading futures is highly risky and dangerous. If you're not an expert, these triggers may not be suitable for you. You should first learn risk and capital management. You can also use the educational content from this channel.
Finally, these triggers reflect my personal opinions on price action, and the market may move completely against this analysis. So, do your own research before opening any position.

TradeCityPro | Bitcoin Daily Analysis #121👋 Welcome to TradeCity Pro!
Let’s dive into the Bitcoin analysis and key crypto indicators. As usual, I’ll walk you through the triggers for the New York futures session.
⏳ 1-Hour Timeframe
As you can see on the 1-hour timeframe, the upward move Bitcoin made yesterday turned out to be a fakeout, and the price is now heading downward.
⚡️ I’m not moving the 108619 line for now. I’ll wait to see if the price reacts to it again in the future, then decide whether to adjust it.
✅ Currently, if the 107853 level breaks, we can enter a short position. We already have volume confirmation, and if this increase in volume continues, we could see a sharp downward move.
📈 Next support levels for Bitcoin in this timeframe are 106586 and 105370, which can be used as targets.
✨ If Bitcoin starts moving upward again, the long trigger remains the 110256 level. A breakout here would mark the beginning of a true uptrend.
👑 BTC.D Analysis
Bitcoin dominance continued its downward move today, dropping close to the 65.04 level.
🔼 We’re currently seeing a reaction at this level, suggesting some support. A break below 65.04 could trigger a strong downtrend.
📅 Total2 Analysis
This index is still in an uptrend but showing significant weakness. It’s currently sitting on key support at 1.15.
⚡️ A break below this level could give us a short position. Additional support levels are 1.14 and 1.13. For a long position, the only trigger we have right now is 1.17.
📅 USDT.D Analysis
Looking at Tether dominance, it’s still hovering around the 4.78 level. After a brief fakeout below, it has returned above that zone.
📊 If this level breaks again, Tether dominance could move down toward 4.72.
❌ Disclaimer ❌
Trading futures is highly risky and dangerous. If you're not an expert, these triggers may not be suitable for you. You should first learn risk and capital management. You can also use the educational content from this channel.
Finally, these triggers reflect my personal opinions on price action, and the market may move completely against this analysis. So, do your own research before opening any position.
TradeCityPro | Bitcoin Daily Analysis #120👋 Welcome to TradeCity Pro!
Let’s dive into the Bitcoin analysis and key crypto indices. As usual, in this analysis I want to review the futures triggers for the New York session.
⏳ 1-Hour Timeframe
In the 1-hour timeframe, as you can see, Bitcoin has finally broken out of the range it formed yesterday and is now moving upward.
✔️ If this upward move continues, we can open a long position in these zones by getting confirmation in the lower timeframes. The main long trigger is still activated after breaking 110256.
💥 The RSI oscillator entered the Overbuy zone in the previous candle. We need to see how the price reacts to this move and what impact this oscillator will have on the price.
⚡️ In my opinion, this RSI move won't have much impact. Although the price is moving upward, the main trend has not yet formed, so there's no real momentum in the market, and RSI is basically useless for now.
✨ If this upward move turns out to be fake, we can enter a short position with the 107853 trigger.
👑 BTC.D Analysis
Let’s look at Bitcoin Dominance. Yesterday, dominance had an upward move and broke its ascending trendline but failed to stabilize above 65.52, resulting in a fake breakout and a move downward.
☘️ The fake breakout trigger for the trendline was the 65.38 zone, which was activated, and now the price is heading downward. If this move continues, the next target will be 65.04.
📅 Total2 Analysis
Alongside Bitcoin’s upward move, this index also activated the 1.14 trigger and is moving up, now reaching 1.15.
💫 If the move continues, the next entry trigger is at 1.17, which is still quite far from the current price.
📅 USDT.D Analysis
Looking at Tether Dominance, the 4.82 trigger was activated, and dominance is now moving down, having reached 4.78.
📈 If it stabilizes below 4.78, we can confirm the continuation of the downtrend in dominance, which could push it down to 4.72.
❌ Disclaimer ❌
Trading futures is highly risky and dangerous. If you're not an expert, these triggers may not be suitable for you. You should first learn risk and capital management. You can also use the educational content from this channel.
Finally, these triggers reflect my personal opinions on price action, and the market may move completely against this analysis. So, do your own research before opening any position.

Banana zone starts when PMI is above 53.Check your charts to verify this fact.
Total 2 with the US Purchasing Managers Index overlain.
The PMI is one of the most reliable leading indicators for assessing the state of the U.S. economy.
Previous Banana zones have coincided with the PMI above 53.
so not just when the economy is growing, but when the economy has entered humming along approaching full acceleration.
This is when most people will feel confidence and WANT to take on more risk as they are most optimistic about the future when the economy is in this state of being.

TradeCityPro | Bitcoin Daily Analysis #119👋 Welcome to TradeCity Pro!
Let’s go over the analysis of Bitcoin and the key crypto indexes. As usual, in this analysis I’m going to review the futures triggers for the New York session.
⏳ 1-Hour Timeframe
Yesterday, the price broke out of the range box between 108619 and 110256 that I had marked for you, and with the heavy selling volume that entered the market, this bearish move took place.
✔️ This move continued to the 107448 zone, and as you can see, we are now in a consolidation and rest phase, and once again the volume has dropped significantly.
✨ As I mentioned in yesterday’s analysis, I believe this low volume will persist through the weekend, and for a solid move to happen, we’ll need to wait for the new week to begin.
💥 For now, the price has room to move up to 108619 and perform a retracement. A break above the 50 zone on the RSI greatly increases the likelihood of this move.
📊 If selling volume re-enters the market and the price moves downward, the short trigger we have is the 107448 level, and breaking it could start the next bearish leg.
📈 For a long position, the price must first stabilize above 108619, and then, if we see that buying volume continues and increases, we can enter a long position. The main trigger will be 110256.
⭐ I myself won’t be opening any positions for now and will wait until the market shows some proper volume and trend before entering. If you plan to open a position based on these triggers, I suggest you take on very little risk so that in case your stop-loss is hit, you don’t lose much money.
👑 BTC.D Analysis
Let’s look at Bitcoin dominance. Yesterday, dominance touched the trendline I had marked and is still dealing with this dynamic resistance.
💫 A bottom has formed at 65.38. If this bottom is broken, we’ll get confirmation of rejection from the trendline, and dominance could have a bearish move down to 65.04.
⚡️ If the trendline is broken instead, we’ll have a new trigger at 65.52, and breaking it would confirm a bullish reversal in dominance. The main trigger will still be a break of 65.64.
📅 Total2 Analysis
Now let’s move on to Total2. This index dropped to the 1.13 zone and has now pulled back to 1.14. It seems like it’s getting ready for another downward move.
☘️ If Bitcoin dominance gets rejected from the trendline and moves down, and if Bitcoin moves upward, Total2 could make a very sharp move.
🔑 Even if Bitcoin drops, Total2 might range or even move up. For now, our short trigger is 1.13, and aside from 1.14, we don’t have any specific long trigger.
📅 USDT.D Analysis
Finally, let’s look at Tether dominance. This index made a bullish move to 4.85 after breaking 4.78 and is now in a corrective phase.
📊 If 4.85 is broken, the next bullish leg could continue up to 4.93. If a correction happens, dominance might pull back to 4.78.
❌ Disclaimer ❌
Trading futures is highly risky and dangerous. If you're not an expert, these triggers may not be suitable for you. You should first learn risk and capital management. You can also use the educational content from this channel.
Finally, these triggers reflect my personal opinions on price action, and the market may move completely against this analysis. So, do your own research before opening any position.

TradeCityPro | Bitcoin Daily Analysis #118👋 Welcome to TradeCity Pro!
Let’s dive into the Bitcoin analysis and key crypto indexes. As usual, in this analysis, I’ll review the futures triggers for the New York session.
⏳ 1-Hour Timeframe
On the 1-hour timeframe, the price remains within the same range box between 108619 and 110256, and it is currently sitting at the bottom of that box.
✔️ Since yesterday, market volume has significantly declined — as you can see, there's practically no real volume in the market.
⭐ On the other hand, it seems the 108619 trigger is about to be activated, and price may move downward. However, personally, as long as market volume stays this low, I prefer not to open any positions.
📊 If we see selling volume entering the market following a break below 108619, I’ll consider opening a short position. But in the current situation, as mentioned, I prefer to stay out of the market.
💥 The RSI oscillator is steadily and gradually declining like a waterfall. This is also due to the lack of volume in the market, which has led to very low price volatility.
⚡️ So for now, it's better not to rely on RSI data because without volume, RSI readings won't be useful.
📈 If the price gets supported at the 108619 level with a good buying volume and starts moving toward 110256, the chance of breaking that level will increase significantly.
👀 If that happens, I’ll personally try to open a long position once 110256 breaks. But I think today, Saturday, and Sunday will remain the same in terms of market conditions, and real volume will likely return starting next week.
👑 BTC.D Analysis
Moving on to Bitcoin Dominance, a descending trendline can be drawn here, which has been tested twice and is now being approached again.
☘️ If BTC dominance gets rejected from this trendline and moves downward, it will likely reach the 65.04 support level. If the trendline breaks, the next resistance will be 65.64.
📅 Total2 Analysis
Looking at Total2, you’ll notice it’s showing more bearishness than Bitcoin and has lost the support it formed at the 1.15 level.
💫 This happened because BTC dominance has been rising since yesterday, which means more money has been flowing into Bitcoin than into altcoins.
🔼 The next support level for Total2 is at 1.13, and a potential downside move may reach this zone. The suitable long trigger remains a break above 1.17.
📅 USDT.D Analysis
Finally, USDT Dominance has exited the range box it had formed and climbed back above the 4.78 level.
🎲 If this upward move continues, the next major resistance will be 4.90. However, if this move turns out to be fake, the short trigger for a bearish reversal will be a break below 4.72..
❌ Disclaimer ❌
Trading futures is highly risky and dangerous. If you're not an expert, these triggers may not be suitable for you. You should first learn risk and capital management. You can also use the educational content from this channel.
Finally, these triggers reflect my personal opinions on price action, and the market may move completely against this analysis. So, do your own research before opening any position.

TradeCityPro | Bitcoin Daily Analysis #117👋 Welcome to TradeCity Pro!
After nearly 20 days of inactivity on this channel, we’re back with our regular analyses. As the first post in this new round, I’ll continue the Bitcoin series and present analysis number 117.
✅As usual, the analysis is done on the 1-hour timeframe to identify potential futures triggers for the New York session.
📰 Before diving into the charts, let’s briefly look at the market fundamentals. Over the past three weeks, we’ve had the news of the conflict between Iran and Israel. Aside from the initial couple of days, it didn’t have a significant impact on the market, and eventually, the market stopped reacting to it. Right now, the two countries have agreed to a ceasefire and seem to be negotiating.
🔍 In my opinion, the market is unlikely to care anymore whether this war continues or not. Whether they reach an agreement or not probably won’t make a big difference to the market.
🔑 The other major event was the Federal Reserve meeting. Everyone was expecting Jerome Powell to provide some clear outlook regarding US monetary policy, but once again, that didn’t happen. Powell didn’t provide any meaningful data.
📊 This uncertainty led to minimal market volatility and prevented any strong legs from forming, with no significant volume entering the market as everyone was waiting for Powell’s remarks. Since that didn’t yield much, the market remains indecisive for now.
💥 We’ll have to wait and see what kind of impactful news comes in the future. Until then, it’s best to remain patient.
⏳ 1-Hour Timeframe
On the 1-hour chart, you can see a bullish move that started from the 105370 zone, and with strong buying volume, price broke through 108619 and reached the top of 110256.
✨ Currently, price has only wicked into 110256 and hasn’t shown a decisive reaction to it yet. If it revisits this zone, we’ll be able to observe its real reaction to the supply level.
🔔 The current support zone is 108619, which has already received a bounce, forming a range box between 108619 and 110256.
📈 If the 110256 level breaks, the upward move could continue with another bullish leg.
🔽 For short positions, the first trigger would be a confirmation below 108619. But for a more reliable short, I would wait for the price to form a lower high and a lower low below that zone before entering.
👑 BTC.D Analysis
Bitcoin dominance is currently hovering around a key support at 65.04. A key resistance sits at 65.64, which would be the first trigger for bullish continuation.
⭐ The main breakout level for starting a new bullish trend in dominance would be 65.97. For bearish confirmation, a break below 65.04 would suffice.
📅 Total2 Analysis
Looking at Total2, a range box has formed between 1.15 and 1.17, with price oscillating in between.
🧩 Momentum is currently bullish, and there’s a high chance of breaking above 1.17. If this level is broken, we could see another bullish leg and a long position would be valid.
📉 For shorts, a break below 1.15 would be the first signal, but I personally prefer to wait for a clearer trend change before entering any short positions.
📅 USDT.D Analysis
USDT dominance is also ranging between 4.72 and 4.78, very similar to Total2.
📊 A break below 4.72 would confirm a bearish move, while a break above 4.78 would indicate bullish continuation for dominance.
❌ Disclaimer ❌
Trading futures is highly risky and dangerous. If you're not an expert, these triggers may not be suitable for you. You should first learn risk and capital management. You can also use the educational content from this channel.
Finally, these triggers reflect my personal opinions on price action, and the market may move completely against this analysis. So, do your own research before opening any position.

TOTAL2 – Battling MA Resistance
TOTAL2 on the daily found support at the 0.382 Fib level on June 22. Since then, it has been moving upward.
Now it’s fighting the 50MA and 200MA resistance zone.
If this resistance is cleared, the 0.236 Fib level could be the next target.
Always take profits and manage risk.
Interaction is welcome.

What is Needed for BTC-Altcoins Bull Market —Crypto is Going Up!Some people are under the impression that Bitcoin needs to go down for the altcoins to go up. No, no, no, no, no... This is a big mistake. Bitcoin needs to continue growing for the altcoins to explode. Let me explain.
Bitcoin has been trading very high forever now and the altcoins grow when Bitcoin is very strong. The current situation with Bitcoin is good for the altcoins but the altcoins need a major force, a strong impulse and maximum support for a bull run and this only happens when Bitcoin goes up.
If Bitcoin retraces from resistance this is bad for the altcoins. Whatever gains tend to be removed right away. If Bitcoin moves forward and hits a new all-time high, this is incredibly beneficial for the altcoins and the altcoins continue growing for the long haul.
Instead of Bitcoin going down or falling behind for the altcoins to grow, Bitcoin needs to continue strong. A stronger Bitcoin is good for the altcoins. The more Bitcoin grows, the more pressure the altcoins market feels to follow.
As long as Bitcoin trades above $100,000, the altcoins can do great. If Bitcoin falters, the altcoins suffer but this is only short-term.
Regardless of what happens in the short-term, Cryptocurrency is set to grow. We will experience the best yet since 2021. This bull market will extend beyond 2025 and it will go into 2026 and who knows, maybe even beyond.
100% certainty, you can bet your house on it; Crypto is going up.
Namaste.

Really quick TOTALS charts - possible WARNINGS
It is Very clear when you look at these 4 charts
TOTAL - TOTAL2
TOTAL 3 _ OTHERS
The Top Left chart is the TOTAL chart and is the only one that includes BITCOIN and it is the ONLY one that is above all of its MA's
All of the other charts are heading into resistance on one or more MA's
ALT coins are sailing in to headwinds.
THIS DOES NOT MEAN THEY WILL GET REJECTEWD BUT IT OOES MEAN YOU SHOULD BE CAUTIOUS
Simple as that

TOTAL2, TOTAL MARKET CUP without BTCTOTAL2, TOTAL MARKET CUP without BTC
Reasonable targets are within the yellow zone — these are high-probability levels based on current price action, volume, and market structure. They offer the best risk/reward and are ideal for primary take-profit planning.
Targets outside the yellow zone are still possible but come with higher risk. They typically require extended time, increased volatility, or external catalysts. These should be treated as secondary or speculative targets, best approached with reduced size or active trade management.
Summary:
Yellow zone = high probability, balanced risk/reward.
Beyond yellow = lower probability, higher risk, use with caution.

BTC DOMINANCE at pivotal juncture.Which direction do you favour?
The chart is inverted, so the up move will result in #Alts outperforming #Bitcoin.
Final Shakeout Complete, Bullish On Everything —The Wait Is OverToday the Cryptocurrency market completes its final shakeout. From now on, we are bullish —everything grows (altcoins).
This is an early signal but confirmation comes from the fact that many altcoins, specifically stable long-term projects, are moving ahead with force, some growing even three digits in a single day, while Bitcoin is producing a shakeout. There is more.
Bitcoin wicked below 100K but is set to close above this level. Even if it closes below a recovery is very likely to follow immediately. At this point, ignore Bitcoin and focus on the altcoins.
👉 We are ultra-hyper bullish on the altcoins market.
This is a friendly reminder my friend.
The wait is over.
Namaste.

TOTAL 2 Analysis (6H)The TOTAL2 chart — representing the altcoin market cap excluding Bitcoin — currently shows signs of weakness. A double top formation has emerged and is actively playing out. In addition, a micro trend change of character has clearly appeared, further validating short-term bearish pressure.
Technical Observations:
Price recently retested a broken support level and failed to reclaim it — a typical bearish confirmation.
In such scenarios, it’s common for the price to decline at least the depth of the double top formation.
However, it’s important to note that macro trend indicators still remain bullish, so entering aggressive short positions is not advised. Instead, consider setting alerts at the key reversal zones marked on the chart — these levels are likely to trigger a strong rebound.
If TOTAL2 breaks above the $1.23T resistance, this double top analysis becomes invalid.
— Thanks for reading.

$TOTAL – Is This Another Bull Trap in the Making?The total crypto market cap ( CRYPTOCAP:TOTAL ) has surged from $2.32T and is currently trading around $3.25T, continuing its upward trajectory. On the surface, things look bullish—but is there more to the story?
Looking at the chart, the current market structure bears a striking resemblance to previous cycles:
• 2021: Massive bull run
• 2022: Painful bull trap
• 2024: Another explosive rally
• 2025: …potential bull trap?
If history is any guide, we could be nearing a critical turning point. The pattern suggests caution—could this rally be setting up for another steep correction?
My Take: Momentum is strong, but the similarities to past cycles are too close to ignore. If the market stalls at current levels, the risk of a bull trap becomes very real.
What do you think—repeat of history or a new chapter for crypto?
Please support this idea with a LIKE👍 if you find it useful🥳
Happy Trading💰🥳🤗

$TOTAL2 and $USM2: Correlation never broken. What now? Today we dive into the world of crypto. We are looking into the recent rally in the Altcoins including CRYPTOCAP:ETH and §Sol and try to understand the reasons behind it and what is means for the future. CRYPTOCAP:TOTAL2 depicts the total market capitalization of all the Altcoins except CRYPTOCAP:BTC but including stable coins. When in doubt, zoom out. Today we are looking at the monthly candle stick charts for the CRYPTOCAP:TOTAL2 vs the $USM2. ECONOMICS:USM2 is the total M2 money supply from all the sources not only the banks but also other forms of cash within the economy. M2 money supply generally goes up and the economy grows and the Govt and Fed Balance sheets grow.
ECONOMICS:USM2 is primarily responsible for the increase in stock and asset prices. Crypto is no exception to it. Whenever the M2 Money supply goes up the Altcoins usually goes up. During the last Crypto cycle, the Altcoins peaked @ 1.7T $ in Nov 2021 and the ECONOMICS:USM2 peaked a few months after that in March 2022 @ 21.71T $. When the ECONOMICS:USM2 fell to 20.66T $ the Altcoins market suffered a bear market and lost 75% of the value. So, the question comes what happens to the CRYPTOCAP:TOTAL2 chart when the M2 money supply is expanding. We have clearly saw a recent surge in the Altcoin market but still below the ATH. Currently CRYPTOCAP:TOTAL2 at 1.16T $ is still below the 0.618 Fib retracement level plotted on the last cycle from top to bottom. Still CRYPTOCAP:TOTAL2 must cover a lot of ground and grow by 50% to reach its previous cycle top. In those cases, the ECONOMICS:USM2 must go up also by 1-2T $ to support such a jump in the $TOTAL2. But what will CRYPTOCAP:BTC do in that case?
Verdict : CRYPTOCAP:TOTAL2 can only go above $1.7T $ if ECONOMICS:USM2 expands by 1-2T $. Watch out for CRYPTOCAP:BTC in that case.

TradeCityPro | Bitcoin Daily Analysis #116👋 Welcome to TradeCity Pro!
Let’s dive into the analysis of Bitcoin and the key crypto indices. As usual, I’m going to review the futures triggers for the New York session.
✅ Yesterday, a very important event occurred: Israel launched a military attack on Iran, targeting not only military facilities but also residential areas.
⚔️ Leaving aside the fact that war is always a global tragedy, the fact that Israel also hit civilian zones shows that the tensions between these two countries have entered a new phase.
💫 In addition to civilian casualties, key commanders of the Iranian military were assassinated in these strikes.
🏳️ Most countries such as the United States, France, and most of Europe supported Israel in this conflict, while only North Korea and Russia backed Iran.
📊 Given these rising tensions and the cancellation of Sunday’s negotiations between Iran and the U.S., the likelihood of war between Iran and Israel has greatly increased following the resolution signed yesterday.
⭐ This development has caused safe-haven assets like gold to move upward, while risk-on assets like crypto have started to decline. As you can see, Bitcoin has been falling since yesterday.
⏳ 1-Hour Timeframe
On the 1-hour chart, as mentioned, after an initial correction to the 108436 zone, Bitcoin continued its decline down to 103606, breaking through the support level we had marked due to the war-related news.
✨ Currently, the price has found support at 103606 and has started a corrective phase. RSI has also exited the Oversold area and is now heading toward the 50 zone.
📉 In my opinion, under the current market conditions, we should wait to see how Iran reacts to Israel's actions. If war breaks out, Bitcoin is likely to drop again.
⚡️ Personally, I’m holding off on opening any positions until we get more clarity on the fundamental developments between Iran and Israel. I'm also not closing any of my longer-term positions that were opened in lower zones like 88k.
🔔 However, if you are looking to open a position, you could enter on a break below 103606. I don’t currently have a trigger for a long position and would prefer to wait for a proper structure to develop.
👑 BTC.D Analysis
Bitcoin dominance moved upward along with the market decline and, after breaking through 64.18, continued its bullish leg up to 64.85.
🧩 It has since begun a corrective phase after hitting that resistance. If this correction continues, the next zone to watch is 64.49.
📅 Total2 Analysis
This index also dropped alongside Bitcoin yesterday, falling from 1.18 down to 1.12 after triggering a short.
🔍 The price has since corrected up to 1.14. If a new bearish leg begins, we can open a short position on a break below 1.12.
📅 USDT.D Analysis
Tether dominance moved upward after triggering 4.68 and reached 4.89.
💥 If 4.79 is broken, the correction could continue. If 4.89 is broken, the next bullish leg in dominance will begin.
❌ Disclaimer ❌
Trading futures is highly risky and dangerous. If you're not an expert, these triggers may not be suitable for you. You should first learn risk and capital management. You can also use the educational content from this channel.
Finally, these triggers reflect my personal opinions on price action, and the market may move completely against this analysis. So, do your own research before opening any position.

TradeCityPro | Bitcoin Daily Analysis #115👋 Welcome to TradeCity Pro!
Let’s dive into the analysis of Bitcoin and the key crypto indices. As usual, I’ll be reviewing the futures triggers for the New York session.
⏳ 1-Hour Timeframe
On the 1-hour chart, as you can see, yesterday the price was rejected from the 110256 level I previously mentioned. Following that, with the activation of the 108617 trigger, Bitcoin experienced a downward leg.
📊 Personally, I didn’t open a short position after the break of that level, but if you did, I suggest taking profits now as the price has reached the marked support zone.
🔍 As for me, I’ll wait to see how the price reacts to this support. If it breaks down, we can open a short position.
📈 However, if the price finds support here, we can once again look for a long position. The trigger for this will be found in the lower timeframes.
👑 BTC.D Analysis
Let’s move to Bitcoin dominance. Yesterday, BTC.D made a pullback to the 64.18 zone and now seems ready for another drop.
✔️ If 63.96 breaks, BTC.D could enter another bearish leg. If instead, the 64.18 ceiling breaks, it could push up toward 64.49 or even 64.67.
📅 Total2 Analysis
Looking at the Total2 index, after reaching 1.24 yesterday, it started to correct and dropped down to 1.18, touching the support with a shadow.
✨ If the 1.2 level breaks to the upside, the price could move back toward 1.24. If 1.18 breaks down, the correction may continue further.
📅 USDT.D Analysis
Now onto USDT.D. After a brief correction up to the 4.68 level, it has resumed its downward movement. If 4.64 breaks, the decline could extend toward 4.56.
💥 If instead, the 4.68 top breaks, it might bounce back up toward 4.72.
❌ Disclaimer ❌
Trading futures is highly risky and dangerous. If you're not an expert, these triggers may not be suitable for you. You should first learn risk and capital management. You can also use the educational content from this channel.
Finally, these triggers reflect my personal opinions on price action, and the market may move completely against this analysis. So, do your own research before opening any position.

TradeCityPro | Bitcoin Daily Analysis #114👋 Welcome to TradeCity Pro!
Let’s go over Bitcoin analysis and the key crypto indexes. As usual, I’ll break down the futures triggers for the New York session.
⏳ 1-Hour Timeframe
On the one hour timeframe, as you can see, a trading range has formed between the levels of 108617 and 110256. This has happened after a strong upward move with significant buying volume, and now we’re in a market correction phase.
📊 Market volume is decreasing during this corrective phase, which shows the strength of the buyers and supports the ongoing uptrend. RSI has exited the Overbuy zone and is now cooling off, which indicates that the bullish momentum has weakened for now.
📈 For a long position, the 110256 trigger seems very suitable today. If the price forms a higher low above 108617 before breaking this level, the probability of breaking 110256 increases significantly.
💥 If this trigger is activated, it’s crucial that volume rises as well. That would confirm the strength of the trend and increase the chances of the uptrend continuing. The current target for this position is 111747.
🔽 In the correction scenario, if the price stabilizes below 108617, this scenario becomes more likely and a deeper correction could follow.
✨ Personally, I won’t open a short position unless we get confirmation of a trend reversal. But if you want to go short, a break below 108617 is not a bad option and could signal a downward move.
👑 BTC.D Analysis
Bitcoin dominance has continued its downward movement, stabilized below 64.12, and is now heading toward 63.93.
⭐ If the 63.93 low is broken, the bearish move in dominance will likely continue. If it pulls back, a break above 64.12 will confirm that retracement.
📅 Total2 Analysis
Let’s look at Total2. Yesterday, it broke through the 1.2 level and is now moving toward 1.24. A breakout above this level could start the next bullish leg.
🎲 If a correction occurs, the price may drop back to 1.2 or even 1.18.
📅 USDT.D Analysis
Now for Tether dominance. This index is still sitting at the 4.56 support and is currently being held there. If 4.56 breaks, the next bearish leg can form.
🔔 In case of a retracement, USDT dominance might rise to 4.64.
❌ Disclaimer ❌
Trading futures is highly risky and dangerous. If you're not an expert, these triggers may not be suitable for you. You should first learn risk and capital management. You can also use the educational content from this channel.
Finally, these triggers reflect my personal opinions on price action, and the market may move completely against this analysis. So, do your own research before opening any position.

TradeCityPro | Bitcoin Daily Analysis #113👋 Welcome to TradeCity Pro
Let’s dive into the Bitcoin analysis and key crypto indexes. As usual in this analysis, I’ll walk you through the futures triggers for the New York session.
⏳ 1-Hour Timeframe
As you can see in the one hour timeframe, Bitcoin has continued its upward movement and reached the 110256 level and is now undergoing a correction.
✔️ If the price continues correcting, the next support level will be 108777. In case of a deeper pullback, the next area to watch is 106586.
📈 For a long position, our first trigger level is 110256, with a target of 111747.
📊 Market volume is currently increasing, and if this inflow of buy volume continues, the probability of a bullish move increases.
💥 The RSI oscillator has dropped below the 70 level. If RSI reenters the overbought zone, we’ll also get a strong momentum confirmation.
👑 BTC.D Analysis
Let’s take a look at Bitcoin Dominance. Today, it finally closed below the 64.49 level and has dropped to 64.12.
⚡️ This drop has allowed capital to flow into altcoins, and many of them are moving upward today. If 64.12 breaks, the downtrend may continue.
📅 Total2 Analysis
Moving on to Total2, this index finally broke above the 1.21 level and is now heading toward 1.24.
💫 At the moment, there is no major resistance preventing the market from continuing its upward trend. But there’s an important point regarding USDT Dominance, which I’ll cover below.
📅 USDT.D Analysis
During this bullish move in the market, the dominance of Tether hit the support at 4.56, while other indexes and most altcoins activated their triggers.
🔑 The key point here is that Tether Dominance has such a significant influence on the market that the inability to break this support has caused the entire market, including Bitcoin, to start correcting.
🔽 The 4.56 level in USDT Dominance is very important and will be the key to triggering the next bullish leg.
❌ Disclaimer ❌
Trading futures is highly risky and dangerous. If you're not an expert, these triggers may not be suitable for you. You should first learn risk and capital management. You can also use the educational content from this channel.
Finally, these triggers reflect my personal opinions on price action, and the market may move completely against this analysis. So, do your own research before opening any position.

TradeCityPro | Bitcoin Daily Analysis #112👋 Welcome to TradeCity Pro
Let’s dive into the analysis of Bitcoin and key crypto indexes. As usual, in this analysis I’ll review the futures triggers for the New York session.
⏳ 1-Hour Timeframe
Yesterday, Bitcoin finally broke through the resistance zone it had formed. As you can see, it pushed through this level with strong buying volume and is now moving toward 108777.
🔍 If you entered a position using yesterday’s triggers, I’d be glad to hear about it in the comments. Your feedback gives me great energy.
⭐ Today, I cannot provide a specific trigger because the market has already made its move. If you do not have an open position, it is better to wait for a new market structure and then identify a fresh trigger.
💥 At the moment, I expect Bitcoin’s upward movement to continue toward 108777. Market volume is strongly supporting the trend and is aligned with price action. RSI is also in the overbought zone, indicating strong buyer presence. If RSI stays above 70, the sharp upward movement is likely to continue.
📊 If a market correction occurs, the price could pull back to the zone I marked. In future analyses, I will review triggers for both trend continuation and possible reversals.
👑 BTC.D Analysis
Bitcoin dominance formed a higher low above 6449 and has now broken the 6467 resistance, signaling the beginning of a new bullish leg.
⚡️ If this upward move continues, Bitcoin dominance may climb further. However, if a pullback to 6467 happens, altcoins could see a strong upward move as well.
📅 Total2 Analysis
Looking at Total2, this index was supported at 114 yesterday and is now moving toward 117.
📈 If Bitcoin dominance starts to drop, Total2 will likely break above 117 and begin a main bullish trend.
📅 USDT.D Analysis
Now for Tether dominance. After forming a lower high below 479, it broke below the 472 support and is now heading toward 464.
✅ In my view, this movement toward 464 is likely to continue, and as that happens, the overall crypto market is expected to keep moving upward.
❌ Disclaimer ❌
Trading futures is highly risky and dangerous. If you're not an expert, these triggers may not be suitable for you. You should first learn risk and capital management. You can also use the educational content from this channel.
Finally, these triggers reflect my personal opinions on price action, and the market may move completely against this analysis. So, do your own research before opening any position.

TradeCityPro | Bitcoin Daily Analysis #111👋 Welcome to TradeCity Pro!
Let’s take a look at Bitcoin and key crypto indicators. As usual in this analysis, I’ll review the futures triggers for the New York session.
⏳ 1-Hour Timeframe
As you can see in the 1-hour timeframe, none of our triggers were activated yesterday and Bitcoin has been ranging.
⭐ There was an important RSI level at 53.49, which was tested multiple times. I mentioned that breaking this level could trigger a slight correction — and that’s exactly what happened. The price pulled back slightly to 105087, retested this zone, and now RSI has returned above 53.49. Price is also moving with strong bullish momentum toward the 105851 resistance.
📊 The buying volume entering the market is quite strong, and if this increase continues, the price could begin an upward move. So in terms of both momentum and volume, we have bullish confirmation and can enter a position if the triggers activate.
📈 For a long position, the trigger we’re watching is 105851. While the main resistance is at 106586, I prefer to take the risk and open the position earlier, because I think the 106586 break won’t provide a clean entry and would be harder to act on.
✨ So my chosen trigger for a long position is 105851. Given the rising volume and high RSI momentum, we have the confirmations needed to open this trade.
🔽 For a short position, the first trigger is the break of 105087. This is a risky position since we haven’t yet confirmed a trend reversal — this would be the first signal if a downtrend begins. Personally, I’ll wait for confirmation of bearish momentum before opening a short.
👑 BTC.D Analysis
Bitcoin Dominance is still below the 64.67 level and is ranging under this resistance.
🧩 A break above 64.67 would confirm a bullish move in dominance. A break below 64.49 would signal a bearish reversal.
📅 Total2 Analysis
Total2 is ranging below the 1.15 level. A break above this zone could initiate a bullish move.
🔔 On the bearish side, the current trigger is the 1.13 level. We need to wait for this level to be broken for a trend reversal confirmation.
📅 USDT.D Analysis
Tether Dominance stabilized below the 4.79 zone yesterday and has now pulled back to it, preparing for a possible second leg downward.
🔑 If that happens, the crypto market could move upward. However, if USDT.D rises back above 4.79, its uptrend could continue.
❌ Disclaimer ❌
Trading futures is highly risky and dangerous. If you're not an expert, these triggers may not be suitable for you. You should first learn risk and capital management. You can also use the educational content from this channel.
Finally, these triggers reflect my personal opinions on price action, and the market may move completely against this analysis. So, do your own research before opening any position.
