TOTAL2 Bear IdeaA bear idea showing two comparable points
A small rise followed by a larger down move back to the dominant bear downtrend
Lets see if the current bear trend is still dominant or if we have shifted to a bull standard
TOTAL2

Not any idea for hold inn crypto until 2024Not any idea for hold inn crypto until 2024
be careful for eth/bnb/sol hold !!!

TOTAL MARKET CAP 12Hr UPDATE BY CRYPTOSANDERS
Hello dear traders, we here new so we ask you to support our ideas with your LIKE and COMMENT, also be free to ask any question in the comments, and we will try to answer all, thank you, guys.
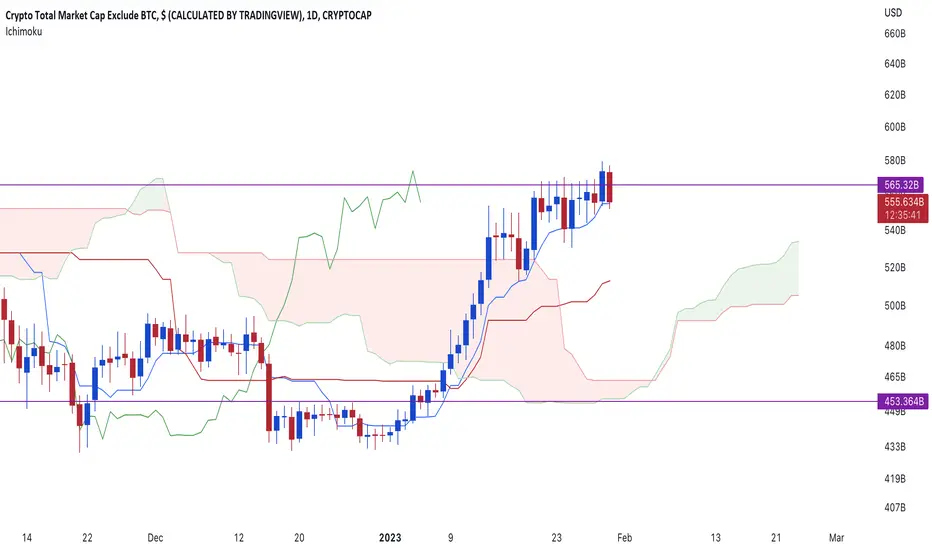
TOTAL MARKET CAP ANALYSIS UPDATE:-After getting rejected from the strong supply zone, it is now bouncing off the ascending trendline support, where the Ichimoku cloud is also acting as a support.
The MACD crossover is losing bearish momentum, and as long as it holds above the Ichimoku cloud, we can expect a continuation of the bullish trend. While a solid break of the Ichimoku cloud will signal further correction in the Alts.
Sorry for my English it is not my native language.
Hit the like button if you like it and share your charts in the comments section.
Thank you

3 DAYS EMA100/200I have already mentioned that EMA100/200 cross
on a large timeframe is a more stubborn thing than the same MA 50/200.
It's been a very long time since I posted a TOTAL2.
We have 4 crosses in history on this t.f.
1. Golden received in March 2016. The cycle to the next cross lasted 1030 days.
2. Death cross received in January 2019, the cycle to the next cross lasted 554 days.
3. Another golden cross in July 2020. And almost 800 days to the next red point.
4. Death cross received in September 2022. It's just been 152 days.
I have to tell myself something about why all of a sudden
a new golden cross should be received during the spring?
I'll just open a beer for now.

TOTAL2 Scenarios, Bull and Bear TOTAL2 has formed a strong upward movement, this could be followed by further upward movement, favoring continuation or a downward move, favoring the chart pattern of an inverted H&S
TOTAL2 is the altcoin market, but largely follows BTC and TOTAL
Lets see what happens
4Hr chart

MARKET UPDATE Hi guys, This is CryptoMojo, One of the most active trading view authors and fastest-growing communities.
Consider following me for the latest updates and Long /Short calls on almost every exchange.
I post short mid and long-term trade setups too.
Let’s get to the chart!
I have tried my best to bring the best possible outcome to this chart, Do not consider financial advice.
Hi guys, This is CryptoMojo, One of the most active trading view authors and fastest-growing communities.
Consider following me for the latest updates and Long /Short calls on almost every exchange.
I post short mid and long-term trade setups too.
Let’s get to the chart!
I have tried my best to bring the best possible outcome to this chart, Do not consider financial advice.
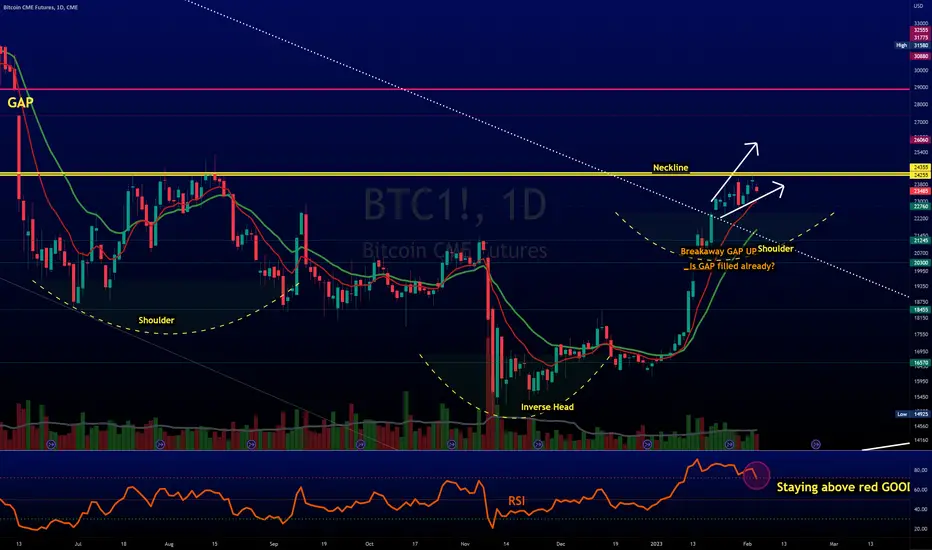
#BTC UPDATE
BTC is forming this big falling wedge pattern
what is a falling wedge pattern?
The falling wedge is a bullish pattern . Together with the rising wedge formation, these two create a powerful pattern that signals a change in the trend direction. Generally, a falling wedge pattern is considered a reversal pattern, although there are examples when it facilitates a continuation of the same trend.
A weekly candle close above 25k could suggest that the market is expecting a bullish trend.
So let's see how the weekly candle closes
* RSI is also sowing some bullish divergences move
#USDT.D UPDATE
We are a few hours away from the weekly close and we can literally see where the market is possibly heading. With the USDT.D bouncing back from the support line and BTC at the resistance, I would highly suggest staying away from leverage trading for now and wait for the market to cool off. If the bounce back is so good to be true then we can expect the USDT.D to reach close to 7.2% resistance. If not then 6.4% is good support for the dominance.
TOTAL 2 UPDATE
We are a few hours away from the weekly close and we can literally see where the market is possibly heading. With the USDT.D bouncing back from the support line and BTC at the resistance, I would highly suggest staying away from leverage trading for now and wait for the market to cool off. If the bounce back is so good to be true then we can expect the USDT.D to reach close to 7.2% resistance. If not then 6.4% is good support for the dominance.
This chart is likely to help you make better trade decisions if it does consider upvoting it.
I would also love to know your charts and views in the comment section.
This chart is likely to help you make better trade decisions if it does consider upvoting it.
I would also love to know your charts and views in the comment section.
Thank you

TOTAL 3 - NO BTC or ETH breaking 1st Downtrend!🚨🚨🚨Look at this!🚨🚨🚨
$TOTAL 3 = #altcoin = no $BTC or $ETH
What do you think so far?
Volume decent too
Weekly bout to crossover!!!
#BTC looks good too but weekly close will CONFIRM = Friday night
🎆🎆🎆EX-CI-TED🎆🎆🎆
Wait till FOMO kicks in!
#crypto

[UPDATE TOTAL3] I said it multiple times. This a good scenario.Let's see if we go for yellow or white.
Yellow = short squeeze
White = wyckoff

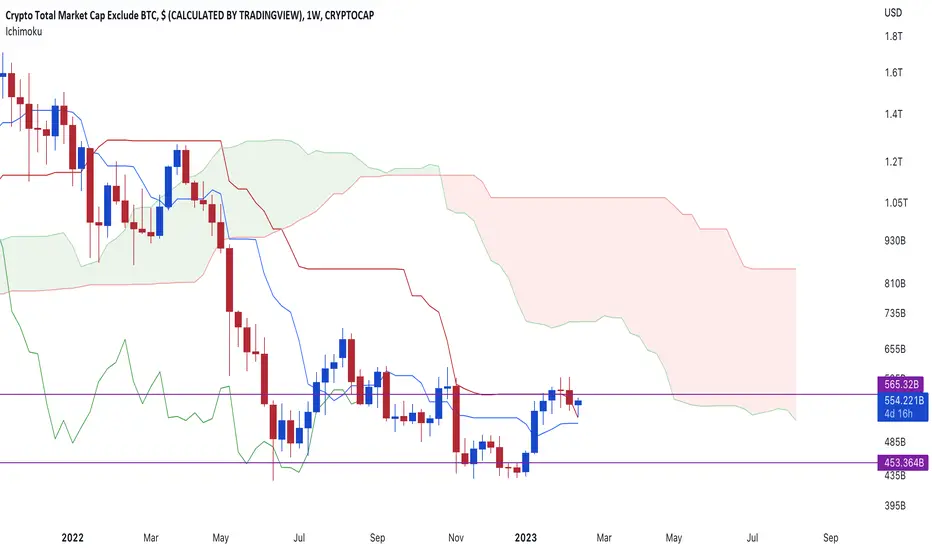
Ichimoku Analysis for TOTAL2weekly #IchimokuOTAL #alts chart suggest chop-chop as lagging is in the price. And with Kijun pointing downwards make sure to keep a good sl on your longs for now.
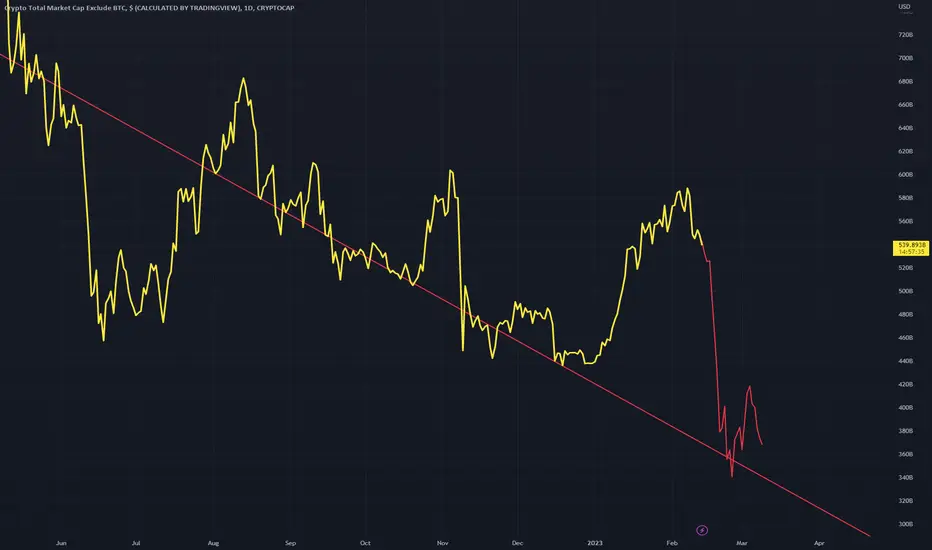
TOTAL2 - Bear TrendlineA bear trend line that could be touched one last time if mcap decides to break down further
This is similar to a scenario that occurred in the previous bear market
I do think we are seeing some more bullish results across the board however so this idea may become redundant if price climbs.
BTC analysis for most possible directionDidn't post yesterday, was busy
---
This is copy paste from yesterday
$BTC not looking so hot atm
#BTC RSI is sinking fast
$TOTAL 3 = #altcoin
Also looks weak but nowhere near as much
Facing heavy resistance
We're likely due for a lil pain from here
---
TODAY
1/2
$BTC @ an important area
#BTC holding @ dotted line support
#bitcoin trading UNDER Red Mov Avg for 2nd day
Buy volume lowers, sells > than buys but not much
RSI MUST NOT tread sub 50 area (middle)
We break Green Mov Avg still ok but MUST HOLD Breakaway Gap area
#crypto
2/2
What about $BTC vs #altcoins?
$TOTAL 3 = #altcoin
Staunch resistance right above
Yet holding better than #BTC
4Hr shows some buys coming back
See the Inverse head & shoulder?
Ugly but it's there
#crypto had huge run, it's okay to REST as long as it doesn't fall asleep

$BTC $ETH & Altcoin data, Memecoins running, what it mean?Important short term🧵
$BTC RSI not showing good signs, NEG divergence
#BTC HAS BEEN LEADING the rally but it's weakening
We've posted on this $TOTAL 3 doing ok
#memecoin running usually @ end of runs
#bitcoin MUST hold support levels
MUST hold number is 18kish
---
2
$DXY running & RSI over 50 again
BAck to #crypto
$Total = ALL including $BTC & $ETH
Not showing recent strength of Total 3 = #altcoin
They all still have a ways to go to break down trend
Although #BTC HAS done it on it's own
#bitcoin has been LEADING until now
Rest time?
---
3
$BTC broke downtrend not long ago & struggled
24k has been issue = MAJOR RESISTANCE &
NECKLINE for Inverse Head & Shoulder = BOTTOM
Now $ETH RSI looks ok
However HUGE resistance @ 1700 area
#ETH hasn't broken downtrend
---
4
$BTC is to $DJI = $ETH is to $NDX
#DJI broke out before #NDX did
Very likely #BTC broke already & #ETH will follow
We'll likely take another month or so to realize the bottom
$TOTAL 2 = No #bitcoin, includes #ethereum & #altcoin, looks ok
We'll see how all pans out
Gnight
TOTAL2 vs. DXY Corresponding Peaks & TroughsAs it does with Bitcoin and the stock markets, TOTAL2 crypto marketcap also shows corresponding peaks and troughs with DXY. When DXY makes a new peak, TOTAL2 sees a new trough shortly after, and when DXT makes a new trough, TOTAL2 sees a new peak shortly after.
Will TOTAL2 see a new peak form here after DXY'ss most recent low?
Or, has TOTAL2 not yet hit its corresponding trough from DXY's recent high?

Ichimoku Analysis for TOTAL2Are you afraid? well $TOTAL 2 looks like it is just fueling up. Finally breaks above the weekly kijun resistance here. Hope to get a good rally this week on the #alts. Any pullback of #Crypto towards tenkan san will be a good buying opportunity with kijun as sl.
Total vs Total2 vs Total3Let's compare $TOTAL = all #crypto
vs NO $BTC with $ETH = $TOTAL2
vs NO #BTC or #ETH > #altcoins = $TOTAL3
Not much change between T & T2, although T looks a bit better
However, T3 is beginning to show lil more spunk
Could we be setting up for MORE #altcoin moving?
We'll see soon

Where is the BTC bottom???BTC supply is rarely calculated/used in charts. Since we analyze equities/idices divided by M2SL, we should divide BTC with it's supply.
Since 2021, BTC supply increases by ~0.003% per week. At least according to the BTC_ADDRESSES ticker.
While this may not analyze the true amount of BTC in circulation, it is at least a start...
This process allows us to add a distinct bound to it's price. It's logarithmic expansion is hard to analyze. So this transformation solves most of our issues with it.
A larger view of the chart.
SCENARIO 1
Bitcoin wealth trends upwards compared to it's supply - It creates wealth
The channel was drawn using a log-scaled regression.
The light-blue line is a more realistic target for the bottom of the channel. The 2020 black swan is an outlier, we do however take it into consideration as a terminal target.
In order to get an idea of the timing, we draw a channel for the last 100 weeks.
And after extrapolating the trend channel, we take 6 targets.
Taking into account the increase in BTC supply (increasing supply, decreasing price) we get the final targets.
A=14220, B=12987, C=14719, D=13468, E=15432, F=14113
SCENARIO 2
Bitcoin fluctuates horizontally to eternity
Look at this retracement...
The 1.618 ratio is an impenetrable border (?)
This chart suggests that perhaps there is a big drop ahead of us, I haven't pinpointed a probable bottom. I will update this idea in the future if I come up with anything.
Price never succeeded to pass this ratio. Instead we had distribution for the last two years. It feels as if this ceiling may never give in. Bitcoin's role to society must change for it to skip this border. Then price might head to an entirely new scale. A monetary crisis could provide an opportunity for BTC to become a viable alternative to fiat currency.
Make sure to follow this idea by SPY_Master for more information about the brewing crisis.
Tread lightly, for this is hallowed ground.
-Father Grigori

Short term Crypto Total Market Cap AnalysisHi Everyone!
The TOTAL2 Index appears to have found a support area around 428 (see chart below), at least temporarily. Indeed, at the moment I cannot confirm of a bullish impulse structure (rally) formation, so I consider this last bullish leg as a technical rebound, at least until it destroys the resistance. It could be interesting to follow this index in the next sessions/weeks.
If this idea will be supported by your "Likes" we will continue to follow this analysis with updates below.
Thanks for your attention and please... trade with care! 💖

Crypto total market cap 45 % drop soon. Be ready!Total crypto market cap broke bearishly as Bitcoin did.
We expect a short term bounce and getting rejected at the strong resistance.
Final target for bears: 585 - 600 B
After that we expect the real accumulation face and the new bull market to start.
P.S Don´t get overexcited with a short-term bounce

TOTAL2 MA EvolutionThis is the 50,100 and 200MA
They are in their respective colors
I expect the 50 and 100MA to slowly curve around while the 200MA remains in a strong upward state
For those in long term
Weekly timeframe

#ALTCOIN MARKETCAP is Flashing Important Signal.Have a blessed Sunday to you all.
ALTMACP broke to the upside.
I am just skeptical about it for one reason, the confirmation candle closed in the red.
Unless we get a candle closing in green above the same, expect manipulation.
Be careful about holding the maximum portion of your portfolio in ALts.
Alt/BTC pairs will bleed.
I prefer holding BTC and a few alts with fundamental advantages like VRA is 230% already, HFT has started its run( Chart coming soon), and many other Gems APT did 4x.
So follow me if you want to know the next potential 50x coins!
DYOR, This is not financial advice.
Do show your support if you like my work.
Thank you
#PEACE

We Have SHIFTED to BULL TerritoryYesterday it looked like we wouldn't go through resistance but we did so now I'm a bull. Go with the flow be like water and win.

$TOTAL vs $BTC part 2$Total vs $BTC
You can also compare how TOTAL3 is lagging compared to Total, Total2, and BTC
Fact that #BTC is testing long term downtrend SHOWS #BITCOIN is LEADING the charge
Yes, #altcoin are ripping BUT BTC is leading move BY STRENGTH, mkt cap
Bitcoin hasn't really done this last 2 times
Next couple days = IMPORANT
Need Volume & Breakout
#crypto

$TOTAL vs $BTC part 1$Total vs $BTC
You can also compare how TOTAL3 is lagging compared to Total, Total2, and BTC
Fact that #BTC is testing long term downtrend SHOWS #BITCOIN is LEADING the charge
Yes, #altcoin are ripping BUT BTC is leading move BY STRENGTH, mkt cap
Bitcoin hasn't really done this last 2 times
Next couple days = IMPORANT
Need Volume & Breakout
#crypto
