TOTAL2 - Whipsaw possible, but I doubt it.It's possible that TOTAL2 touches the weekly 400MA, however indicators are oversold and likely a deviation for liquidity is a higher probability.
TOTAL2

TOTAL2 UPDATE! ALTCOINS IS IN DANGER!!Hello everyone, if you like the idea, do not forget to support it with a like and follow.
Welcome to this TOTAL2 aka Altcoin market cap update.
Total2 is not looking good here. It breaks down from the bear flag-like structure and the recent pump in Altcoins was just a retest. After this retest, we might see more drop in Alts.
If you are holding any Alts then keep your stop loss tight.
If you like this idea then do support it with like and follow.
Also, share your views in the comment section.
Thank You!

Are you ready for Alt season?Watch for a break of the pink line with conviction. Once it breaks I think we'll see a rapid rise in alts. NFA, DYOR.
What are you favorite alts / charts right now?

TOTAL2 Alternate Bull Trap ScenarioPrice right now is pretty stagnant this could be indication of a bottom or a bull trap similar to one seen in prior bear market
This is a max pain scenario
Linking my other analysis which suggests this price action is the bottom. Its gotta be one of them right?


TOTAL MARKET CAP 1DAY UPDATE BY CRYPTOSANDERSHello dear traders, we here new so we ask you to support our ideas with your LIKE and COMMENT, also be free to ask any question in the comments, and we will try to answer for all, thank you, guys.
TOTAL MARKET CAP ANALYSIS UPDATE:-
Alts market cap bounced from the rotated rectangular support, trying to break the horizontal resistance.
The last few daily candles closed as a spinning top, which is a sign of indecision between bulls and bears.
So the perfect play is to wait for a breakout or breakdown with a substantial volume, that will confirm the next direction of ALTS.
Some significant support and resistance levels are set apart to act after an effective breakout or breakdown.
Sorry for my English it is not my native language.
Hit the like button if you like it and share your charts in the comments section.
Thank you

#TOTAL MARKET CAP TECHNICAL ANALYSIS!!Hi guys, This is CryptoMojo, One of the most active trading view authors and fastest-growing communities.
Consider following me for the latest updates and Long /Short calls on almost every exchange.
I post short mid and long-term trade setups too.
Let’s get to the chart!
I have tried my best to bring the best possible outcome to this chart, Do not consider financial advice.
TOTAL MARKET CAP UPDATE
As you can see in the chart or absorb in the chart here TOTAK MARKET CAP is making these two patterns.
first symmetrical triangle pattern which is a semi-bullish pattern, here we need a breakout or breakdown to confirm this pattern.
The inverse head and shoulder pattern is a bullish pattern but here we need to break out the nice line of this pattern to conformation this pattern.
This chart is likely to help you make better trade decisions if it does consider upvoting it.
I would also love to know your charts and views in the comment section.
Thank you

#TOTAL MARKET CAP 2DAY ANALYSIS BY CRYPTOSANDERSHello dear traders, we here new so we ask you to support our ideas with your LIKE and COMMENT, also be free to ask any question in the comments, and we will try to answer for all, thank you, guys.
TOTAL MARKET CAP ANALYSIS UPDATE:-
The total market cap is forming a double bottom pattern. Stochastic is giving a buying signal. RSI printing bullish divergence.
The long descending trendline and MA 21 are acting as resistance. Bulls need a successful breakout to confirm bullish momentum in the market.
Sorry for my English it is not my native language.
Hit the like button if you like it and share your charts in the comments section.
Thank you

TOTAL2 - Mid Term Recovery I expect the crypto market (particularly) the altcoin market here (TOTAL2) to undergo a partial recovery from this extreme bear market we have all experienced.
A market cap rise from where we are now to the middle line of the up channel drawn (dotted white line)
This bullish expectation should be reached by early 2023.
A W formation can be seen on chart with bars pattern.

Total Crypto Market Cap Monthly chart looks to have hit bottom. Total Crypto Market Cap Monthly chart
can you see how this is super bullish? Look
at the Ascending Bullish Trendline holding
support perfectly. The DeMark9 Indicator
is showing that there is a super high probability
that the enitre Total Crypto MarketCap is at the bottom.
The 100 Day and the Bull Market Support Band
is at the exact same place on the chart. The
monthly candle only needs to get above and close
above the green line and Bull Market is back in action.
Im looking for us to get there in the coming 30-90 days.

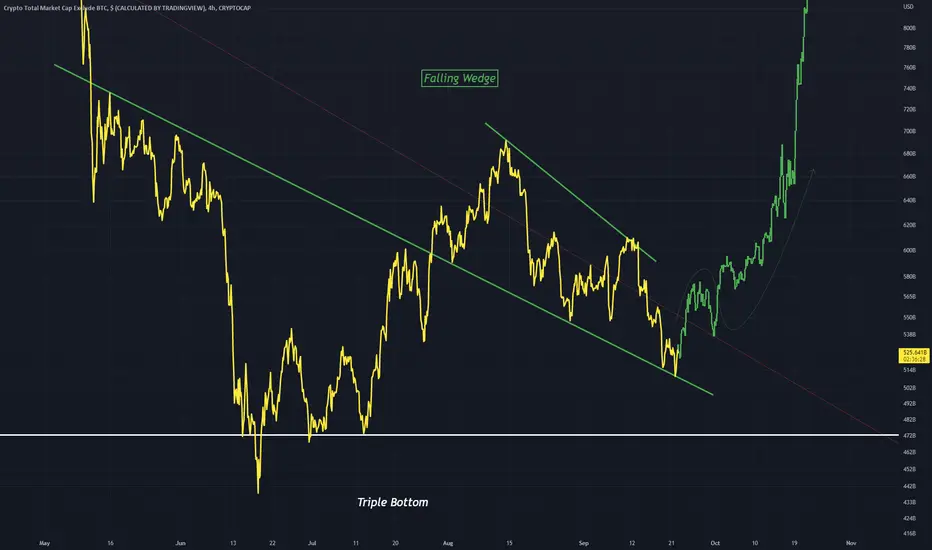
TOTAL2 Falling Wedge and Triple BottomThis is the 4Hr timeframe chart for TOTAL2
It shows a nice falling wedge forming right along the dominant downtrend line in red
This is all above a strong triple bottom which is a great candidate for a reversal point in the market
I expect a strong breakout out of this falling wedge
KEY LEVEL TO WATCH: TOTAL2 MacroI previously estimated where altcoins might find support, and I was right... for a few weeks.... but we didn't get a serious relief rally before losing that level.
Contagion has spread and 2 more giga-firms Celsius and 3AC may be insolvent / forced sellers....
And now we are a 7% drop away from a potentially very significant level...
It's the 200SMA on the 1W timeframe (yellow line). We haven't come anywhere near it since pre-bull run. Before that, it never exactly offered rock-solid support, but it did act as a magnet for price action during the previous bear cycle.
When it was broken previously, the Total market cap of altcoins went down another 45% before being drawn back up to it and didn't stray too far in either direction until blasting off this previous bull cycle.
I'm posting these quickly so I'm sorry if some of my numbers are off, but you get the idea. It's a point of interest. If we lose it, expect more downside, but THAT will be when it's time to really pay attention and watch for a potential bottom / rally back for a bearish retest of it.
THINK HAPPY TRADES
THINK HAPPY TRADES
CD

Expect 12-20% lower from here on TOTAL2 before potential supportUpdated my TOTAL2 macro chart - I called the timing/level of the market rally in my first version based on TA.
Reviving this chart because once again, blood is in the water. I'm not predicting it will catch support and rally again at the exact same level;
I'm merely reminding you that this is the next significant level of POTENTIAL support, and there's still a 12-20% drop before we get there.
Careful out there, and keep stops in place. With FOMC in a few days, clearly this will be a volatile week.
Happy Trades,
CD

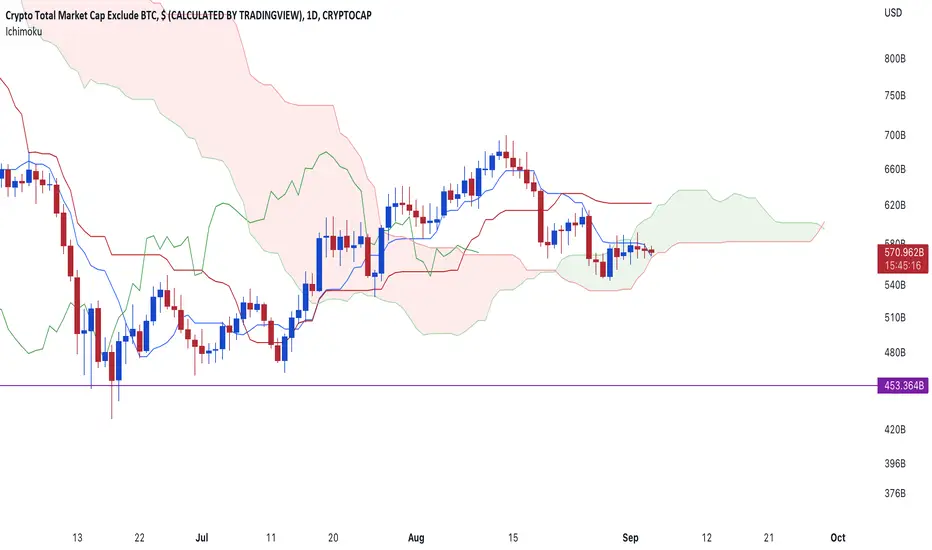
Ichimoku Analysis for TOTAL278.6% is a good local support. Losing it will be BAD for #ALTS . Keep an eye on Tenkan/Kijun crossover for further direction on this.

total total crypto market cap has managed to squeeze outside of the weekly bull channel and is now back-testing it from below;
it's also beneath the 55 monthly exponential moving average.
---
is this a trap?
or are about to see a -50% raid before a true bottom is in?
find out next month.

TOTAL2 vs BTC.D - Signs Of Potential Alt Season To Come When you compare Total Altcoin market cap (Crypto market cap excluding BTC) side by side, you can see that when BTC dominance (BTC.D) falls is usually when alt season happens. When BTC.D goes sideways, altcoins tent to do the same or even consolidate for a while, like we've seen for the last year or so.
An a chart altseasn is marked in green, consolidation/sideways movement in yellow and in blue is when crypto winter comes.
After BTC topped in Dec. 2017, BTC dominance continued to fall as BTC went into a retracement. Altcoins continued to rally into this moment. After that The whole market crashed and BTC dominance rose significant. This is a typical sign of bear market. This time is a bit different. After BTC made first ATH in 2021 and had its first major selloff, BTC dominance started to go sideways while altcoin market cap (TOTAL2) capitulated. BTC dominance than actually continued to go sideways even after whole marked crashed which does show a sign that the bull market, at least for the altcoins is not over. If it would be over, BTC dominance would have to be rising right now a lot, but it doesn't. Instead it is looking like it will continue to crash, which is a very good sign for altcoins. Remember that time is irrelevant here as no one knows for how long and when things will play out.
I am very positive that it will come while BTC will slowly be rising into a retracement.
DISCLAMER:
I am not a financial advisor so non of this should be taken as a financial advise. Be well.

TOTAL3 looks prepped for a launch anytime?TOTAL 3 weekly chart:
The Long yellow rectangle support box may
be the most important support in the entire
Market as a whole. When there is around 19,000
Alt-coin projects relying on BTC holding and this
huge monster support box holding, this is Do or
Die...Im confident in the coming 300 days,
we will see all time highs in the TOTAL 3 market.
The Green $2.674 Trillion is my Super bullish
prediction coming from measurements. and the
smaller yellow rectangles are the falling bearish
support boxes....lets hope we dont see the candles
fall lower. The RSI has never been this OVERSOLD, we honestly should be moving up
bc we are in uncharted territories and sentiment should change.

Highly possible scenario Crypto bearish cycle end in 28/10/2022It is highly possible that we end the bearish cycle and market final bottom end of October 2022

#TOTAL MARKET CAP 6Hr ANALYSIS !!Hello dear traders, we here new so we ask you to support our ideas with your LIKE and COMMENT, also be free to ask any question in the comments, and we will try to answer for all, thank you, guys.
TOTAL MARKET CAP ANALYSIS:- Broke out falling wedge, retesting above it and consolidating in a symmetrical triangle. RSI is in the oversold region, printing bullish divergence. It is also on the verge of symmetrical triangle breakout which will most probably target the first trouble area around $1.028T after a successful breakout.
This is not a piece of financial advice. All investments made by me are at my own risk and I am held responsible for my profits and losses. So, do your own research before investing in this trade.
Thank you for your time, we hope that our work is good for you, and you are satisfied, we wish you a good day and big profits.
Thanks.

Ichimoku Analysis for TOTAL2With the bearish kumo crossover, now we just wait for it to come below the cloud for actual SALE to begin.
🟥 Crypto total market cap drop soon. Share your opinion in the comments and support the idea with Like.
Follow me on tradingView, if you don't want to miss my next analysis or signals.
Thanks for your support!

💥Total Market Cap last dive to $960B#TOTAL (Update)
With regard to my previous idea here
Total just showed us a very good confirmation by breaking the inner trendline (rising wedge support) and falling towards the outer trendline.
Therefore, I expect Total to dive down to $960B before the move upward.
Not a financial advice🙅🏼♂️
Share your opinion in the comment section✍️
Please support this idea with a LIKE👍 if you find it useful🥳
Happy Trading💰🥳🤗

💥Crypto Total Market cap - Pump or Dump?#CRYPTO (Update)
Price got rejected at 1.176T and it’s approaching a weak trendline which can make the market dump.
Also, price can pump and break 1.23T zone and continue to rise.
Let’s wait and see how market will play out.
In the meantime, kindly share your opinion in the comment section about what we should expect this week, a pump or dump?✍️
Not a financial advice🙅🏼♂️
Share your opinion in the comment section✍️
Please support this idea with a LIKE👍 if you find it useful🥳
Happy Trading💰🥳🤗
