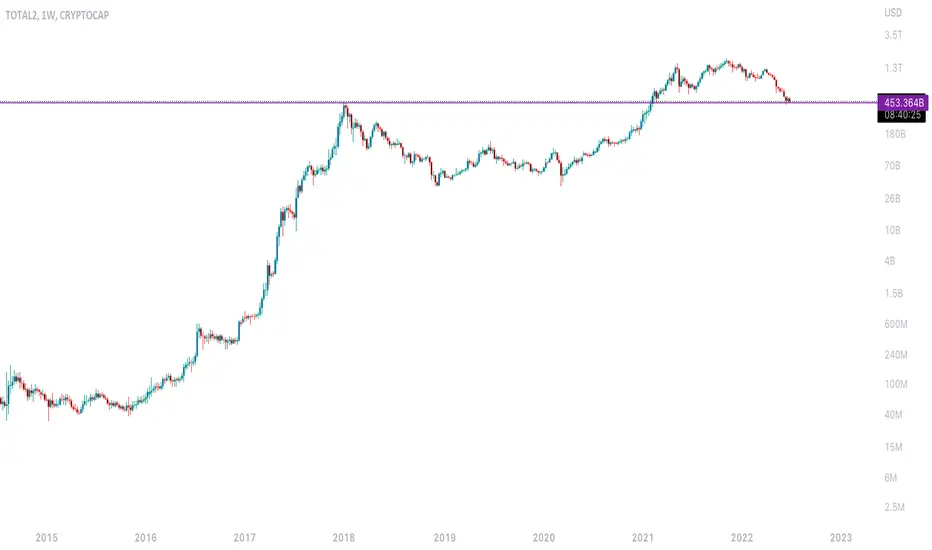
TOTAL2 1 Trillion +This one is also about to shoot up strong.
Over 1 trillion very likely in the weeks ahead.
Party weekend.
Or profitable weekend.
Green weekend.
Bullish weekend.
Money weekend.
The cryptocurrency weekend.
Namaste.
TOTAL2

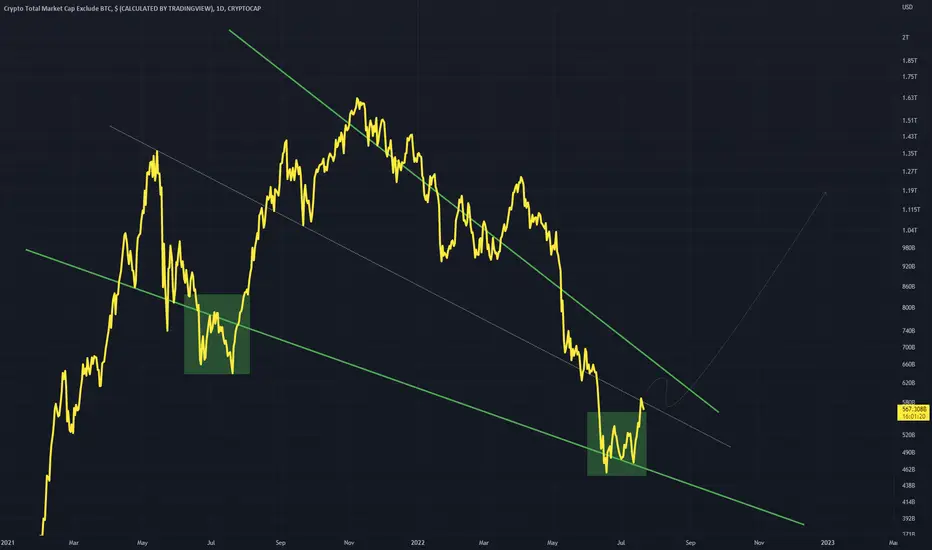
TOTAL2 Falling Wedge IdeaAn idea for the altcoin market showing a falling wedge , a bullish pattern
This pattern may lead to a greater break out
Similar bottoms in green rectangles along the lower band of the falling wedge
Daily timeframe
TOTAL2 BULLS ARE STRONG HERE|LONG
Hello, Friends!
After some time of sending us mixed signals
TOTAL2 is finally giving us a solid bullish bias
And judging by the price action at the lower timeframes
The pair is about to go up!
BUY!
✅LIKE AND COMMENT MY IDEAS✅

analysis of total2 1H time frameanalysis of #total2
1h time frame
#bearish
according gan fan anlysis

TOTAL2The support of 600-700 billion dollars of Total 2 has now become resistance, it seems to be pulling back to resistance.

#ALT MARKET CAP is on the run! 15% Rally ahead!Welcome to this quick update everyone,
Altcoin Marketcap is bouncing after printing a higher low.
The index reversed on 18th June 2022 with a low of $430.955 Billion Marketcap.
Currently its trading inside a rising channel and to cpmleyte it needs to print another higher high which gives us our short term target of $573 Billion, almost 15% from current level.
THERY TO KEEP IN MIND:-
Since this is a rising channel which is generally bearish in nature and often considered as a bearish continuation pattern unless broken to the upside.
This is a very interesting scenario here. BTC has been surprising us since the last few months and ALT MARKCAP breaking to the upside after printing a bearish pattern could be another surprise while the whole crowd is completely bearish.
This is just a theory. The chart along with multiple indicators are showing possibility of a 15% rally in this index which will eventually push the altcoins 20% to even 50%.
So take your trade decisions accordingly.
INVALIDATION:- A CANDLE CLOSE BELOW THE RECENT Higher low of $461 billion will invalidate this chart.
DYOR before taking any trade decisions based on this chart.
Do hit the like button and share your views in the comment section.
Follow me for more quality updates.
I don't post much , I only do when it's needed.
Thank you
#PEACE

Total analysisIn the long-term time frame, we are in the bullish channel.
We see the bearish Rising Wedge pattern in 1 day time.
There is a possibility of falling to 715B $.

TOTAL2 Can Grow by 150 Billion (25% Or More)Greetings my fellow cryptocurrency traders.
We are looking at TOTAL2 with a chart similar to Bitcoin and all major Altcoins.
This index is trading within a consolidation pattern which is very likely to break bullish based on how the market is doing when looking at the indiviual charts.
The targets are mapped on the chart.
We aim first at 670B but it can go higher.
We wait and see how this level is handled and after the data is in, it is easier to tell if it will continue higher or retrace to new lows.
More likely that a retrace after this target is hit ends up in higher low, to later hit a higher target before the next major correction.
This correction can set the bottom before sustained long-term growth.
That's my analysis of the crypto markets and this chart.
Namaste.

CRYPTO total ; ALTS ; repeating RSI patternsCRYPTO total ; ALTS ; repeating RSI patterns
as the title; the last one linked showed our potential roll over, which unfortunately has happened and a bear market is now in full swing. seems like we are at that capitulation omega point in the cycle.
hard to tell which one of those two red arrrows we are at IF we are just repeating cycle momentum here. looks like a potential bottom, or at least large bounce, after riding back to double bot on the small time frames here.
also we fast roll over here, and a massive last leg down happens real fast. like minus 30-50% in a day or two.
its actually an easy play because it will be strong and fast either way.
lesson: dont put your buy too low within the 'roll over dome threshold' lol! dont get too greedy on your bounce entry in other words.

ALTS MARKET CAP UPDATE Hi guys, This is CryptoMojo, One of the most active trading view authors and fastest-growing communities.
Consider following me for the latest updates and Long /Short calls on almost every exchange.
I post short mid and long-term trade setups too.
Let’s get to the chart!
I have tried my best to bring the best possible outcome to this chart, Do not consider it as financial advice.
ALTS MARKET CAP is making these two patterns in which one is bearish and one is bullish .
ALT MARKET CAP is forming bearish pennant in 4hr timeframe
If pannent broken downside then is ready for another 30% bearish wave.
TOTAL MARKET CPA is forming this symmetrical triangle also So let’s wait for a sustain break down or breakout will confirm the next move of the TOTAL MARKET CAP.
Let's see how the market will react in few hours.
Stay tuned
This chart is likely to help you make better trade decisions if it does consider upvoting it.
I would also love to know your charts and views in the comment section.
Thank you

Total Cryptocurrency Market Cap. Going Above 1.5B (75% Jump)The cryptocurrency market is starting to slowly recover after many months of strong bearish action.
We saw literally the worst period ever for Bitcoin since its inception... The recovery can be strong.
Up to 75% the TOTAL cryptocurrency market cap. can grow.
That's above $1,500,000,000...
This can turn into incredible growth.
Plan ahead and be prepared.
The summer will bring a stop to all the market blood.
In the summer we go green with the trees.
Namaste.

TOTAL3 is getting primed for a launch again!TOTAL 3 still intact and RSI is showing a tic
upward and this is a great sign. Price still remins
in the gold consolidation box.

TOTALMCAP - Bear Market RallyTwo charts for the TOTALMCAP, on the left excludes BTC
The left chart shows a bottom along 3.618, this may cause a breakout that coincides with a bear market rally
The right further shows this with vertical lines representing bull market and bear market periods, we are currently at the bear market rally stage
This aligns also with the 200MA which should also hodl

BTC Vs XVG Early FormationsBTCUSD formation while it being created in 2014 shares similarities with the current bull formation on Verge in 2022
Following this structure on BTC we all I think know what happened
Will it follow on to XVG? This structure I have also seen across a few other coins.
Promising

Total2 In a delicate position.Crypto market cap hanging by the edge. 50% more down from here if it fails to bounce.
#TOTAL MARKET CAP UPDATE Hi guys, This is CryptoMojo, One of the most active trading view authors and fastest-growing communities.
Consider following me for the latest updates and Long /Short calls on almost every exchange.
I post short mid and long-term trade setups too.
Let’s get to the chart!
I have tried my best to bring the best possible outcome to this chart, Do not consider it as financial advice.
#BTC/USDT ANALYSIS
BTC is making these two patterns in which one is bearish and one is bullish .
TOTAL MARKET CAP is forming bearish pannent in 6hr timeframe
If pannent broken downside then is ready for another 30% bearish wave.
TOTAL MARKET CPA is forming this symmetrical triangle also So let’s wait for a sustain break down or breakout will confirm the next move of the TOTAL MARKET CAP.
Let's see how the market will react in few hours.
Stay tuned
This chart is likely to help you make better trade decisions if it does consider upvoting it.
I would also love to know your charts and views in the comment section.
Thank you

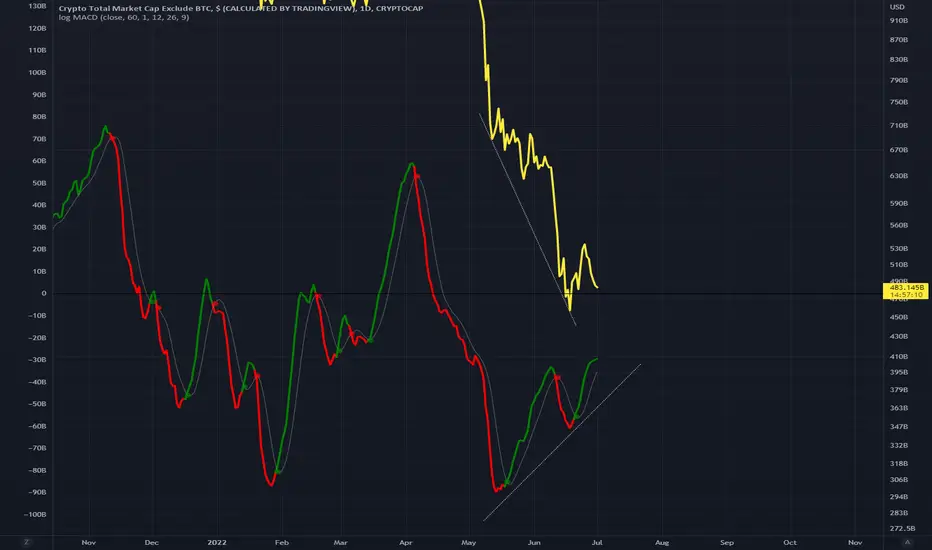
TOTAL2 - Daily Bullish DivergencePrice prints lower lows
While indicator prints a higher low
This is a Classic Bullish Divergence
Daily timeframe
#ALT MCAP $500 billion at critical level.
ALT MCAP is moving towards the 100 MA support around $500 billion mcap.
This is an important level to hold.
A green close above this level could trigger a bullish rally across the market, until it happens we are short-term BEARISH.
Be careful.
Let me know what you think in the comment section. Do hit the like button if you like me to post these small updates.
Thank you
PEACE

TOTAL2 - Altcoin Market Bottom (200MA) TOTAL2 has endured most of its bearish activity, with price finally reaching the Weekly 200MA
This 200MA aligns perfectly with the prior 2017 bull run
An entry along this line is optimal

TOTAL3 is getting even more bullish!look how the Convergence and
divergence with the Price action
and RSI move together...this is an
example of how charts work...we
have never been this oversold...
big things ahead for the ALT coins.

TOTAL MARKET CAP long-term update:must read!! Hi guys, This is CryptoMojo, One of the most active trading view authors and fastest-growing communities.
Do consider following me for the latest updates and Long /Short calls on almost every exchange.
I post short mid and long-term trade setups too.
Let’s get to the chart!
I have tried my best to bring the best possible outcome in this chart, Do not consider it as financial advice.
TOTAL MARKET CAP
Total market cap formed this big rising wedge pattern but it is yet breakout currently is lying on the lower support of this big wedge pattern as long as the lower support, we can expect a bounce from there. RSI is in the oversold range and we have 200ma as local support.
If it breaks the lower support or 200ma support then the chart will be invalided.
If you look closely at the first cycle and compare it to subsequent cycles, you will find that the beginning of 2021 was great for TOTAL MARKET CAP because it grew by almost 500% in 2 swings.
If you look at the second cycle, the price has risen at first, but later you realize that this is a trading range. In the trading range, there is a difference between the buyer and the seller.
After the failure of the trading range, the price enters a downward trend for a while and falls about 70%. You may think that this is too much and it is no longer possible for the price to return. In fact, this is not the case. It is necessary for the price and health of the market, although this decline did not happen easily, but it can be recovered from here.
Stay tuned
This chart is likely to help you in making better trade decisions if it did consider upvoting this chart.
Would also love to know your charts and views in the comment section.
Thank you

total 2 weekly total 2 shows a return in daily time frame
it can revive Altcoins but there is a plan B for a greater crash in market after the date we reach to this price .

TOTAL 3 weekly chart is sitting the biggest support in history.TOTAL 3 weekly chart:
The Long yellow rectangle support box may
be the most important support in the entire
Market as a whole. When there is around 19,000
Alt-coin projects relying on BTC holding and this
huge monster support box holding, this is Do or
Die...Im confident in the coming 300 days,
we will see all time highs in the TOTAL 3 market.
The Green $2.674 Trillion is my Super bullish
prediction coming from measurements. and the
smaller yellow rectangles are the falling bearish
support boxes....lets hope we dont see the candles
fall lower. The RSI has never been this OVERSOLD, we honestly should be moving up
bc we are in uncharted territories and sentiment should change.
