ALT SEASON IS COMING...In total2 we can see cup and handle pattern and it say alt season is coming in November and it start by bearish chart for BTC .D
HAVE A GOOD TIME ;)
TOTAL2

TOTAL2 Chart PatternsThis is the 4Hr chart analyzing the chart patterns present on the chart
Price is touching a strong support, price will likely test this line (solid line) and bounce upwards off it
This is for the altcoin market (TOTAl2)
Wedge structures are very common on this one

Total Market Cap: Cup & Handle COMPLETEIf the TOTAL index completes the pattern, we will see a crazy increase

TOTAL2 end-number 200+ trillion?Given some technics from the past few cycles we can establish that the duration of the "big gain" period is extending and the actual gains (%) decreasing. It could be more accurate, but the point is the bigger picture. Hold your coins. Don't get scared. You don't have to "buy the dip" and "sell the top", IF you have the patience and calm to zoom out and focus on the bigger picture.

TOTAL2 4HOUR UPDATEWelcome to this quick update of TOTAL2 analysis.
I have tried my best to bring the best possible outcome in this chart .
Very serious situation for ALTS!!
TOTAL2 broke the triangle and already retraced it and coming down or suppoet levels are 1.193T , 1.128T , 1.056T
I thing the price cam dump from here .
if its broke and close above the resistance level then the chart will become invalid.
Sorry for my English it is not my native languages.
Do hit the like button if you like it and share your charts in the comments section.
Thank you...


₿ TOTAL 1D ₿ : 11.Oct.2021 (Update)Well, as we see, the TOTAL index (market cap of the entire crypto market) has reached a very important resistance range, and if it does not succeed in breaking this range, the probability of crashing the market is very high ... But if this important X-Point level will brakes , Bitcoin and, by nature, the entire crypto market will grow well . and we will see new ATH for BITCOIN and Other Cryptoes ...
⚠️ This Analysis will be updated ...
👤 Arman Shaban : @Ar_M_An_4
📅 11.Oct.2021
⚠️(DYOR)


TOTAL2 : Crypto CapCap needs to break the falling resistance in order to move towards the eventual target of 1.80T.
Major levels of resistance are around 1.35T followed by 1.42T. Doing so would open ATH's for market cap.
Initial support is seen around 1.2T followed by 1.15T.

Altcoin market looking bullishNote that I'm not a financial advisor, this is just my opinion and I am not recommending anyone to buy or sell. DYOR and don't just listen to an Explosive Cow.
I am bullish on the altcoin market (TOTAL2 is the market cap of all the altcoins), although at the moment I'm uncertain weather altcoins will outperform BTC.
The reasons I'm bullish are the following:
We have already had one cycle of the Elliot waves since March 2020 with and impulse wave from March 2020 to May 2021 and a corrective wave from May 2021 to June 2021. Now that the cycle has ended, we are starting a new cycle and could possibly entering wave 3 of the impulse wave.
The 9 weekly-EMA acts as support.
The MACD (blue line) is above the signal line (orange line).
We are not in overbought territory on the RSI, meaning there is room to grow
Higher highs and lower lows since July 2020
The only thing I'd note is that there is bearish divergence on the Histogram of the MACD since the past few weeks, but since it's only been 5 weeks, it's not a significant time. This is also the only negative indicator, so it doesn't pose a threat.
TP : My TP is the at the 1.618 Fibonacci level taking the March 2020 low and the May 2021 high, which would put it at 2.4T market cap (86% increase).
I put the wave 3 ending in January, but that is highly subjective, it could be 6 months or more from now or more
Note: I currently hold several altcoins at this point.

ALT SEASON IS COMINGTotal 2 index is located in a sensitive area.
There are some positive points in it that can be evidence that it can register a new ATH and see the real ALT season.
Initially, a pattern of cups and handles was formed in the weekly time frame, and it was able to make a good candle this week.
The CCI is testing its 100 line break for the second time and is on an uptrend
Its MOM is above 65 and that is a good sign.
If this happens and it can break its resistance in the range of 1.44 - 1.49, each altcoin can grow by an average of 50%
I think the Alt season is on its way.

TOTAL2 - BIG MOMENT Hi, this is mye new update for Total Market Cap Exclude BTC. This is the moment guys, we have now completed a cup and handle pattern, in the NEXT couple of weeks we are going to see massive gains in Total Market Cap. One thing we have to notice is that the gains from bottom to previous top is 132% and from the definition of cup and handle, when we break the all time high then we are going to see another 132% gains, so be patient the new ALT season is going to start soon. I am LONG here ;)

BTC/USD (New Swing Top)💎Technical Analysis Summary💎
BTC/USD
-Finally, BTC broke above the previous swing top at 53k dollars
-Most short players got their stop loss hit after hitting as high as 56k dollars
-The Bulls are back in momentum but we will have a much better view once the weekly candle is closed
-For now, our immediate support is the Fib 0.236-0.382 region with the confluence of previous resistance
-As long as the Buyers can hold above this area, the point of view is still going up
-I can see strong coins showing a potential continuation pattern for new highs
-I'm currently into swing trades right now and it is on profits too after a big win recently
-My small losses are now covered so I will keep these winning trades ride the trend
-Happy trading everyone and always plan your next trade
⚠️Please always read the description⚠️
Thanks for donating 💰 via Tradingview coins TheDeFiPool 🙏🎉
``````````````````````````````````````````````
If you need help🙋 don't hesitate to
Send me a message here PolarHusk 😊
``````````````````````````````````````````````
Trading Involves High Risk ⚠️
Not Financial Advice 💸
Exercise Proper Risk Management 💱
``````````````````````````````````````````````

Alt season is coming soon The huge cup and handle pattern is almost ready on the total market cap of the Alts (without $BTC).
Alt season is coming soon.

Why I think we are going up TOTAL2The recent break up above the 50MA is a bullish sign
We are in for another more rapid period of a bullrun
This is a chart for the Altcoin market
see attached

BTC/USD (Test 53k Swing Top?)💎Technical Analysis Summary💎
BTC/USD
-Bitcoin is looking good today after a bullish retest on the S/R level
-The chances to retest the 53k recent swing top is highly probable now
-If BTC reaches the 53k level, we will have to observe for any price reaction
-If the price will go higher or faces rejection because the sellers might re-enter
-There is always a risk to consider if you have any position opened
-I'm currently in a big win trade and small loses
-I'm always keeping my losses small and keeping my winning trades hit my targets
-This is how I become consistent in this environment
-I want everyone to follow the same and please risk management is very important
-Alright, stay safe, and good luck everyone!
⚠️Please always read the description⚠️
Thanks for donating 💰 via Tradingview coins TheDeFiPool 🙏🎉
``````````````````````````````````````````````
If you need help🙋 don't hesitate to
Send me a message here PolarHusk 😊
``````````````````````````````````````````````
Trading Involves High Risk ⚠️
Not Financial Advice 💸
Exercise Proper Risk Management 💱
``````````````````````````````````````````````

TOTAL | H4 | Technical AnalysisThe crypto stock index (TOTAL) can rise again in the 16-20 range if there is strong support after this decrease in the range of 7-10%, which will be on average this week. %.
Attention! From today, this decrease will occur, please do not open a trade!

BTC/USD (Bullish Weekly Candle?)💎Technical Analysis Summary💎
BTC/USD
-The bulls showed their strength back after confirming the 40k dollar new key support
-The 40k dollar zone is a confluence of multiple factors like the S/R level, 50W MA, Fib 0.618
-This weekly candle is about to close in 3 hours, if this one closes above 46k that is a good sign
-A potential upside continuation up to its recent swing top around 52k dollar
-This will be an exciting week for the crypto space as I can see the market is back
-I am currently into swing trades right now and will add more to my positions soon
-Good luck everyone and make sure to plan your trades
⚠️Please always read the description⚠️
Thanks for donating 💰 via Tradingview coins TheDeFiPool 🙏🎉
``````````````````````````````````````````````
If you need help🙋 don't hesitate to
Send me a message here PolarHusk 😊
``````````````````````````````````````````````
Trading Involves High Risk ⚠️
Not Financial Advice 💸
Exercise Proper Risk Management 💱
``````````````````````````````````````````````

BTC/USD (Bullish Pattern Confirmed)💎Technical Analysis Summary💎
BTC/USD
-Finally, the bulls showed up after a double bottom reversal pattern is confirmed
-This pattern is also a confluence of a descending bullish channel
-Which is trading in the key area of interest around the 40k dollar zone
-Currently, BTC is testing the mid resistance level at 48k dollar
-If the bulls will continue to go higher, the next stop is the recent swing level at 52k dollars
-Congrats for the bulls today, all they have to do is to consolidate and stay above 44k to stay strong
-I'll start looking for coins that haven't move any significant or are ready for a potential upside reversal
-Stay safe and good luck everyone!
⚠️Please always read the description⚠️
Thanks for donating 💰 via Tradingview coins TheDeFiPool 🙏🎉
``````````````````````````````````````````````
If you need help🙋 don't hesitate to
Send me a message here PolarHusk 😊
``````````````````````````````````````````````
Trading Involves High Risk ⚠️
Not Financial Advice 💸
Exercise Proper Risk Management 💱
``````````````````````````````````````````````

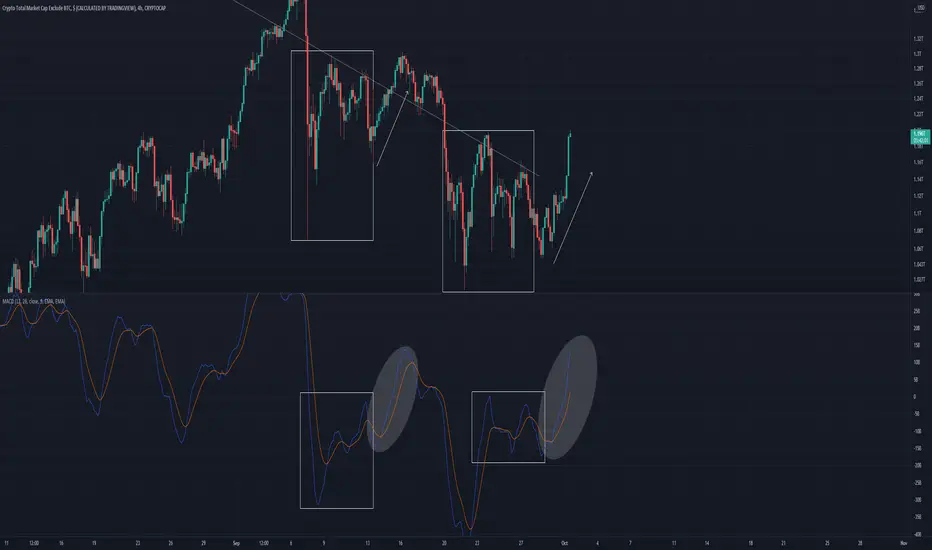
Cool Breakout Pattern TOTAL2Just observing the altcoin market rn
I see the breakout continuing
This is on a 4Hr timeframe so it doesn't really matter in the long run
thought it was cool tho
TOTAL market cap updateAnother update on TOTAL. We pulled into the channel and should chop around allowing the 200 to curl upwards bullish for price action to push above the 0.7836 Fib
Just a prediction. Nothing to base your trading or finances on only an idea of potential direction

BTC/USD (100D MA Acting Support?)💎Technical Analysis Summary💎
BTC/USD
-Every time the price goes above 44k dollars, the bears always enter the market
-We can see two downward trendline resistance which is acting heavy in the short term
-The only good thing right now is BTC is holding the Fib 0.5 and 100D moving average
-We will soon see a breakout direction within this week either up or down
-Guys, if you are holding any trade, please make sure to follow your stop loss location
-This is the time risk management discipline is very important for the past few days
-Regarding the BTC Dominance level, it is currently showing strength
-That is why the Altcoin space is looking weaker against the Bitcoin pairing
-Only two days left before the monthly candle closes
-Things are getting interesting for the coming month of October
⚠️Please always read the description⚠️
Thanks for donating 💰 via Tradingview coins TheDeFiPool 🙏🎉
``````````````````````````````````````````````
If you need help🙋 don't hesitate to
Send me a message here PolarHusk 😊
``````````````````````````````````````````````
Trading Involves High Risk ⚠️
Not Financial Advice 💸
Exercise Proper Risk Management 💱
``````````````````````````````````````````````

BTC/USD (Must Hold 40k Dollars)💎Technical Analysis Summary💎
BTC/USD
-The previous support area has turned resistant today
-This zone is a perfect entry for the sellers to enter the market
-Another lower high structure is being painted by the Bears
-The Bulls needs a lot of work to do, they need to defend its recent mid support
-If the buyers can hold the 40k dollar area and bounces up like a double bottom reversal
-That can be our next step to look for a new trading opportunity in the coming days
-I am still not into any swing trade yet, and I am patiently waiting for the best confirmation
-Stay safe everyone and please manage your risk if the market is not in your favor
⚠️Please always read the description⚠️
Thanks for donating 💰 via Tradingview coins TheDeFiPool 🙏🎉
``````````````````````````````````````````````
If you need help🙋 don't hesitate to
Send me a message here PolarHusk 😊
``````````````````````````````````````````````
Trading Involves High Risk ⚠️
Not Financial Advice 💸
Exercise Proper Risk Management 💱
``````````````````````````````````````````````
