BTC/USD (Good Monthly Support?)💎Technical Analysis Summary💎
BTC/USD
-Finally, after 3 months of red candles. The month of July finishes strong
-Bitcoin has a monthly immediate key area of support around 35k-29k dollars
-This is the zone we need to watch for the remaining months of this year 2021
-As long as this area will hold, BTC will remain Bullish until the end of the year
-For now, I'm expecting a few months of sideways trading again
-During this consolidation, Let us see if the Altcoins space will move stronger
-Because most of the time, Altcoins performs better when BTC trade-in range
-I will always keep my watchlist updated and hopefully share some of my public ideas
-See you and Good luck! :)
⚠️Please always read the description⚠️
Thanks for donating 💰 via Tradingview coins bitcoinpam 🙏🎉
``````````````````````````````````````````````
If you need help🙋 don't hesitate to
Send me a message here PolarHusk 😊
``````````````````````````````````````````````
Trading Involves High Risk ⚠️
Not Financial Advice 💸
Exercise Proper Risk Management 💱
``````````````````````````````````````````````
TOTAL2

CRYPTO MARKET OUTLOOKBTC, ETH, BTC.D, TOTAL1 and TOTAL2 Market Analysis based on the "Trade Structure" system.

TOTAL 3 ALT VS BTC ALT VS BTC ARE IN THE FALLING WEDGE.
Wait patiently for this big opportunity on the alt

BTC/USD (40k Area Acting Resistance?)💎Technical Analysis Summary💎
BTC/USD
-Bitcoin is currently testing the mid resistance area after a 40% increased from the 29k region
-This zone is a confluence of previous tops from January 8, May 26, June 15 trading
-Also, the 100 Moving Average is sitting inside this zone
-Take note, the RSI hit the 70 level or overbought territory
-After 9 trading days with all green candles, it is potential painting a red day
-If BTC tops out or slows down from here, expect a mini consolidation range
-A correction is likely to happen if not yet then BTC might break the 42k zone
-Let us wait and see which way the market will go within 24hrs-48hrs
-Good luck traders and stay safe!
⚠️Please always read the description⚠️
Thanks for donating 💰 via Tradingview coins bitcoinpam 🙏🎉
``````````````````````````````````````````````
If you need help🙋 don't hesitate to
Send me a message here PolarHusk 😊
``````````````````````````````````````````````
Trading Involves High Risk ⚠️
Not Financial Advice 💸
Exercise Proper Risk Management 💱
``````````````````````````````````````````````

BTC/USD (New Strength)💎Technical Analysis Summary💎
BTC/USD
-Bitcoin finally confirms the weekly key support area
-After a strong recovery back above the 50W MA and hitting the 40k level
-We can say BTC is safe for now in the coming weeks
-But the Bulls can't stay relax because the 40k dollar is acting as a strong barrier
-And also, we have a new CME price gap of around 34k-32k dollars
-We know these gaps are likely to get filled soon
-If you noticed some Altcoins are not doing well during BTC run-up
-It is because the Bitcoin Dominance level increases too by 5%
-The Altcoin space may move weak or slow in the coming days
-Unless the BTC Dominance decreases and Bitcoin moves in a range
-Congrats for the Bulls, let us see if they can make another follow-through
⚠️Please always read the description⚠️
Thanks for donating 💰 via Tradingview coins bitcoinpam 🙏🎉
``````````````````````````````````````````````
If you need help🙋 don't hesitate to
Send me a message here PolarHusk 😊
``````````````````````````````````````````````
Trading Involves High Risk ⚠️
Not Financial Advice 💸
Exercise Proper Risk Management 💱
``````````````````````````````````````````````

Altcoin MCAP Fibonacci Circles - Huge Upside? In the first scene we can see OTHERS bouncing off 3.618 strongly off the strongest trendline available
A possible falling wedge breakout
This level was seen as resistance previously before the massive run up we saw, now it is support
In the second scene we can see TOTAL2 (altcoin cap) approaching 2.618, during the last bull run as price approached 0.618 of this same trend a massive run up through the transition occurred, will we see another massive run up through 2.618 (another .618) level
If it occurs this will lead to phase two of the bull run, a more aggressive, and sharper rise across the board.

BTC/USD (29k Last Area of Support?)💎Technical Analysis Summary💎
BTC/USD
-Bitcoin is saved by the last area of support and 200 Moving Average on 2D TF
-If BTC will continue to move higher in the coming days
-I expect a retest of the 20 Moving Average in this 2D time frame
-This short-term 20MA may act as resistance again as seen in the past
-The Bulls and Bears are differently in a tug of war until the last one surrenders
-The market trading range is getting tighter and tighter each day
-We will soon see breakout direction either up or down
-So please always be prepared and manage your position size correctly
-Good luck and stay safe everyone!
⚠️Please always read the description⚠️
Thanks for donating 💰 via Tradingview coins bitcoinpam 🙏🎉
``````````````````````````````````````````````
If you need help🙋 don't hesitate to
Send me a message here PolarHusk 😊
``````````````````````````````````````````````
Trading Involves High Risk ⚠️
Not Financial Advice 💸
Exercise Proper Risk Management 💱
``````````````````````````````````````````````

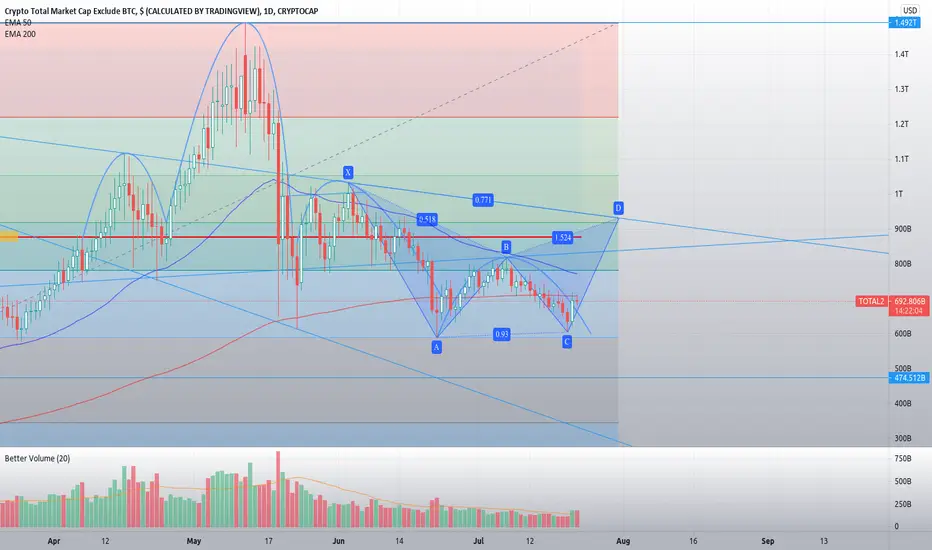
Alts Getting a Boost on TOTAL2Musk | Woods | Dorsey activated!! The technicals were showing a Gartley point "C" shored up on Bitcoin and as Bitty goes, so goes the crypto market, naturally alts are gonna hitch a ride. Check out that broadening / descending wedge on the longer term trend (bullish) BUT we have some interim oscillation to contend with before the bull really stands tall once again. We have a Gartley on TOTAL2, not a ton of volume but enough to risk a small long if you've got liquidity. We may push aloft the 200 EMA and sandwich in under the 50 with hopes of a bullish rise to break above that. Watch the Fibs and trendlines and as always, not investment advice and DYOR. Enjoy the show friends!
Time to enter altcoins slowlyHello Traders,
I just published an idea on June 11 and warned you about the upcoming downtrend on altcoins. And, it happened. Now, it's time to enter altcoins slowly because we will see a bounce up to 50k on Bitcoin soon.
Reason: 38.20% Fibonacci reversal level (~593B). We had a bounce up from the 38.20% fib level so far.
Please like and share the idea.
Thanks.

Bitcoin Dominance Is Going To Hit The ResistanceBitcoin dominance:
On 21st May 2021 the Bitcoin dominance index started the formation of an ascending triangle. Now the priceline is very close to the resistance of this triangle. Previously we have seen so many rejections by this resistance. If the Bitcoin index will be rejected again by this resistance and breaks down the support of this ascending triangle, then it can even touch the lowest value of 35. After breaking down the support and the altcoins will be free to move towards upside or downside Bitcoin dominance. But in case of breaking out the resistance, Bitcoin can again drive the altcoins with its move.
Altcoin index:
But only breaking down the Bitcoin dominance is not sufficient. In order to start a big altcoins bullish move we need to watch the altcoin index as well and that is Total2 index. This index shows the altcoin market performance excluding Bitcoin. If we take a look at this Total2 index then it can be noticed that previously it was moving in an up-channel and after breaking down the support it has formed a down channel. While moving within this new down channel it has moved very close to the very strong price level support and the support of this down channel as well. So we will need to break out this channel along with the breakdown of Bitcoin dominance as well.
Conclusion:
Most of the traders are only watching the Bitcoin dominance chart, and waiting for the dominance to be decreased or break down the support. But we also need watch the altcoin index (Total2 index) as well. Because at one side if the BTC dominance will be broken down and on the other side the altcoins index will be moved up then an altcoin season can be started like we have witnessed in Jan 2018. Therefore, it is important to watch both charts.


total2this is my idea.this area is a powerful support zone.I hope the market has a pullback in this area.
1T zone is a good support

Crypto Might Get NUKED!!!If that Triangle breaks to the downside then GG. I guess the discounts will be crazy :)
Supports are in White...
Elliot Wave Extended 5th wave correction, Killer!
FUD and Blood on the Streets!
Capitulation will bring us to oversold territory, sparking the next bull run!

BTC/USD (Warning Signal?)💎Technical Analysis Summary💎
BTC/USD
-Warning sign for BTC, the price closes below the 50W Moving Average
-It is now trading below the weekly key area of support
-If BTC is unable to get above the 33k area in the coming days
-Please be cautious and manage your position sizes
-Because we don't know how far BTC will go if this downward continues
-Good luck traders and stay safe!
⚠️Please always read the description⚠️
Thanks for donating 💰 via Tradingview coins bitcoinpam 🙏🎉
``````````````````````````````````````````````
If you need help🙋 don't hesitate to
Send me a message here PolarHusk 😊
``````````````````````````````````````````````
Trading Involves High Risk ⚠️
Not Financial Advice 💸
Exercise Proper Risk Management 💱
``````````````````````````````````````````````

TOTAL2 RepeatAltcoin market cap similarities obvious
Critical point approaching
will it turn out as last time? (2)


TOTAL Where we are at in the bullrunSimilar pullbacks in red
Green line is the major trendline that is holding
We are currently moving through a big fib area, which I do not think is an appropriate Top

#ALTCOINs in Danger? Welcome to this quick update.
In my last update, I said if ALT Mcap CLOSES BELOW 738 Billion altcoins will be bearish AND YET WE SAW dump in ALTCOINS but it didn't follow how I expected.
Just shifting a few trendlines and I got the chart above.
Looks like it's still under the channel and a bounce is likely from here.
It will take some time with sideways action or even little pullbacks during the weekend.
Close below this channel could create a panic in the altcoin market with blood everywhere.
Let's hope we see a bounce from here.
Let me know your thoughts on this.
Thanks for reading, Do hit the like button if you like it and share your views in the comment section.
Thank you
Stay safe
#PEACE

TOTAL2 The PullbackThe pullback exhibited within the bull run comparing to points in the previous bull run

BTC - FIB play PART IIHello trader,
Nice week and profitable deals 💲
This BTC 1D chart is a combination of:
1. FIBretracement from 3k low to 64k high
2. FIBretracement from Wave 2 to Wave 3
3. FIBretracement from 64k Top to Wave3
4. 2017 Top
5. FIBextencion from Wave 2 to Wave 4
6. FIBextencion from Wave 2 to Wave 3
7. Pitchfork
Detailed BTC
FIB roadmap
Weekly logscale roadmap II and Fractal
Roadmap 3
I would like to mention that all I post are just options and my own opinion !
Always trade with SL, and do not risk more than 1% of your portfolio (max 3%) per trade.
No trading advice !
➡️If you like my posts smash the like👍👍 button, comment or follow me.⬅️
Thanks for reading my ideas,
Trade save!!


#ALTCOIN SEASON only if it happens!!!Welcome to this quick update, everyone.
I got many requests for analyzing the Altcoin Marketcap
BTC has been acting strangely these days and I am more of a TA guy rather than the fundamentals.
TBH Fundamentals play a very major role in Crypto.
But charts always give us a hint ahead of the news, doesn't matter Bearish or Bullish .
Let's get straight to the chart:-
The TOTAL2 represents the Total Altcoin market cap.
According to this chart, the Alt mcap must rally towards $800 billion in the next few weeks keeping in mind the $733 Billion mark holds.
Currently, we are at an important level of support.
Observe the channel support as well as the Yellow trendline.
Trying to breakout positively. Breakout and a bullish retest confirm the uptrend in altcoins which will eventually give us a green altcoin week.
What's your thought on this?
Do you think Alts will rally?
Share your views if you have any in the comment section and do not forget to hit the like button if you like my updates.
Thank you
#PEACE

