Price at Bullish Curve TOTAL2Price is touching and wanting to break out of this bullish curve it is touching
Very bullish situation for BTC and altcoins along this trend line
Daily chart
TOTAL2

TOTAL2 - Down Channel Breakout An example of a strong move out of the current down channel on TOTAL2
This breakout could continue to a position of strong resistance which i have labelled with the horizontal line
Good time to buy alt coins
2Hr chart

TradeCityPro | Bitcoin Daily Analysis #63👋 Welcome to TradeCity Pro!
Let’s move on to the analysis of Bitcoin and key crypto indices. As usual, in this analysis I want to review the futures session triggers for New York.
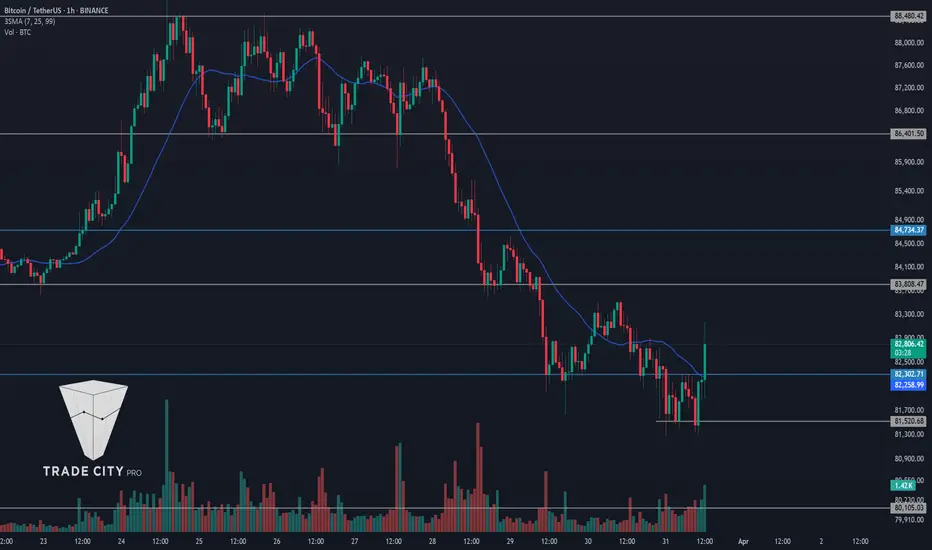
⏳ 1-Hour Time Frame
Yesterday, a short position could have been opened that might have already brought you good profit.
🔄 In yesterday’s analysis, I told you that if the price pulls back to the 85482 zone, gives a confirmation candle, and buying volume increases, you could open a long position. That didn’t happen—there was no confirmation candle, and the zone turned out to be a fake breakout.
👀 For a short position, I also mentioned that if the price fakes the breakout of this zone, you could enter a short position on lower time frames after the break of a short-term trigger, targeting 83233. This scenario played out exactly, and the price gave a trigger on lower time frames and dropped to 83233.
📉 But today we also have a trigger for opening a position, so don’t worry too much—you haven’t missed a lot. Yesterday’s position was opened in a risky context, and if you followed proper risk management, you shouldn’t have taken much risk on that position, and naturally, wouldn’t have made a large profit either.
🔑 A fake breakout of a box top indicates strong seller momentum, so currently, bearish momentum is stronger than bullish, and the price leans more toward decline. On the other hand, the 83233 zone is very significant, and the price has reacted to it several times, making it an important support zone.
📚 So, with that in mind, if the 83233 zone breaks, you can enter a short position. If, before breaking this zone, the price creates a lower high compared to 85482, we’ll have even more confirmation—because based on Dow Theory, when price fails to reach its previous high, it shows that buyers are weakening. So breaking the low, which overlaps with the 83233 support, gives us a very solid position.
💫 But an important point to consider is that the price formed several bullish legs before creating this box, so overall, the current market momentum is still more bullish, and all short positions carry more risk than long positions.
📈 For a long position, the 85482 zone remains a valid trigger, and if the price stabilizes above it, we might see the next bullish leg. Personally, I prefer that the price tests the 85482 zone once more so we can get a more accurate level, and then break it on a subsequent attempt, which would make opening a position easier.
✔️ Of course, even if the zone is broken on the first try, I’ll open a long position, but if it's broken on the second or third attempt, we can enter with more confidence and take more risk.
📊 After the range box was broken, market volume has been declining, and only a few candles have significant volume—these are considered outliers and can be ignored. So the most important thing is that if a trigger is activated, the volume should align with that direction and support the price move, showing convergence.
👑 BTC.D Analysis
Let’s take a look at Bitcoin dominance. It’s still bullish and, after breaking above 63.87, has continued its new bullish leg.
🧩 As a reminder, as long as BTC Dominance hasn’t changed trend or turned bearish on higher time frames like the daily or weekly chart, buying any altcoin isn’t logical. We need to wait for a trend change. For now, we see dominance as bullish, so long positions on Bitcoin and short positions on altcoins are suitable choices.
📅 Total2 Analysis
Now for Total2 analysis: yesterday, both short triggers I gave were activated, and the price moved downward.
🧲 Currently, a low has formed around the 932 zone, and if this zone breaks, the price could continue its downtrend. On the other hand, if the 947 zone breaks and the price moves back above it, we can consider opening a short-term long position in lower time frames.
📅 USDT.D Analysis
Let’s look at Tether dominance. Yesterday, I mentioned that dominance was interacting with the 5.39 zone and that if it breaks, the market could move upward.
🚀 But that didn’t happen—instead, the price moved upward and even broke above the 5.53 ceiling. Currently, it’s returning to its range box again and may head back toward the 5.39 level. If that zone breaks, we can still take it as a confirmation of a bearish shift in dominance.
❌ Disclaimer ❌
Trading futures is highly risky and dangerous. If you're not an expert, these triggers may not be suitable for you. You should first learn risk and capital management. You can also use the educational content from this channel.
Finally, these triggers reflect my personal opinions on price action, and the market may move completely against this analysis. So, do your own research before opening any position.

The 4 Crypto Market Cap charts and SMA's comparedTop Left TOTAL CRYPTO MARKET CAP
Top Right TOTAL 2 CRYPTO MARKET CAP ( Minus Bitcoin )
Bottom Left TOTAL 3 CRYPTO MARKET CAP ( Minus BTC and ETH )
Bottom Right OTHERS CRYPTO MARKET CAP ( Top 125 coins Minus Top 10 by dominance )
50 SMA RED
100 SMA BLUE
128 SMA GREEN
TOTAL Cap is the ONLY one that has broken above the 2021 ATH and has subsequently dropped back under but is still "touching the line" with a Wick up from the current candle.
It can also be seen how it is only the TOTAL chart that has remained easily above the 50 SMA since late 2023. The toer charts can be seen to have needed to bounce of it in 2024
The TOTAL 2 & 3 charts have very similar Candle moves and 50 SMA use.
To me, this is telling us about the Higher Cap ALT coins.
The fact that both TOTAL 2 ( Minus BTC ) and TOTAL 3 ( Minus BTC and ETH ) are similar shows me the little impact of ETH on price rise. These Charts are held up by the Higher ALT coins like SOL, INJ, SUI, XCN, HBAR to name a few. Most of these are still less than 100% gains over the last 12 months.
But what the slight Difference there is between the two charts does show us that ETH is a burden. It is dragging the TOTAL 2 chart down lwoer than the TOTAL 3 and that difference, though small on a monthly chart, is VERY SIGNIFICANT
OTHERS tells a huge story of how the Mid to Lower Caps are paying the price of Bitcoins adoption by Corporations and the fact that, as a result of these Corporations HOLDING, Bitcoin Dominance remaining High. The money that has once been used to Feed the ALT Market is static.
OTHERS is also the only chart that has fallen below its own 50SMA
That is not Bullish and very clearly shows how the Crypto Market has now matured and the absolute Tidal wave of New, worthless, useless ALT coins are failing.
This does not mean that will continue but I am inclined to believe that while we have such uncertainty in the world, the utter risk of investing in something with no use or history and security does not appeal to many.
To many extents, this could be seen as the beginning of the " Dot Com" Bubble burst for Crypto, where the best Coins / Projects are adopted and the rest, well, fall aside......
We shall see

TOTAL2 - Support CurveA curved support line on the 4H chart for TOTAL2
I suspect this to HODL and price to rise on the right side of the larger overarching pattern
The dashed green line is a strong horizontal support
4HR chart

TradeCityPro | Bitcoin Daily Analysis #62👋 Welcome to TradeCity Pro!
Let’s move on to the analysis of Bitcoin and key crypto indices. As usual, in this analysis I want to review the futures session triggers for New York.
⏳ 1-Hour Time Frame
In the 1-hour time frame, as you can see, the price has a bullish structure that is still ongoing, and currently, one of the resistance levels at 85482 has been broken, and the probability of a bullish price move is high.
✔️ If you already have a position from the break of 85482, you have likely hit neither the target nor the stop-loss yet. The target for this position could be the 88502 zone.
✨ But if you don’t have an open position and are looking for a trigger, a price pullback to the 85482 zone with confirmation, or even a break of one of the short-term resistances in lower time frames, can be a suitable trigger for a short position.
📉 For a short position, if the price fakes the breakout of the 85482 resistance and moves downward, with confirmation in lower time frames and a break of the Fake Breakout trigger, we can enter a short position. The main short trigger is the break of the 83233 zone.
👑 BTC.D Analysis
Let’s take a look at Bitcoin dominance. As you can see, dominance has started another bullish leg and after breaking 63.61, it reached 63.80, and now with the break of 63.80, it's ready to carry out its main bullish move.
🔼 For now, we see the trend in dominance as bullish, so long positions on Bitcoin and short positions on altcoins are suitable.
📅 Total2 Analysis
Let’s take a look at the Total2 analysis. As I mentioned, since dominance is bullish, Bitcoin is moving more than altcoins. Right now, we can also see this in Total2, where momentum is less than Bitcoin and it has moved slightly away from its top, while Bitcoin has broken its high.
🔍 For a long position, the break of the 980 zone is still valid, and if it breaks, the price could move up to the 1.2 zone. For a short position, we have two triggers.
📉 The first trigger is the 956 zone, which is a good entry point but risky, and the chance of hitting stop-loss is high. The second trigger is the 947 zone, which is a more reliable trigger, but if it breaks, opening a position will be harder and we might not get a solid confirmation candle.
📅 USDT.D Analysis
Let’s move on to Tether dominance. You could say the entire market is waiting for Tether dominance to move, and even Bitcoin, despite breaking its resistance, hasn't moved yet because the 5.39 zone in dominance hasn't broken.
🎲 This zone is a very important one, and if it breaks, we could see a bearish leg down to the 5.24 zone, which would push the market upward. The bullish trigger for dominance for now is the break of 5.53.
❌ Disclaimer ❌
Trading futures is highly risky and dangerous. If you're not an expert, these triggers may not be suitable for you. You should first learn risk and capital management. You can also use the educational content from this channel.
Finally, these triggers reflect my personal opinions on price action, and the market may move completely against this analysis. So, do your own research before opening any position.

TradeCityPro | Bitcoin Daily Analysis #61👋 Welcome to TradeCity Pro!
Let’s move on to the analysis of Bitcoin and key crypto indices. As usual, in this analysis I want to review the futures session triggers for New York.
🔍 Yesterday, one of our short position triggers was activated. Let’s get into the analysis to see how we can open a position today.
⏳ 1-Hour Time Frame
In the 1-hour time frame, as you can see, the trigger we gave yesterday at the 84382 level was activated and the price moved down toward the 82813 area. Today, I’ve adjusted the position of these lines since the price has created a better structure and the placement of the levels can change accordingly.
✔️ Currently, the price has formed a box between 83233 and 85482 and continues its ranging structure.
📈 For a long position, we can act if 85482 breaks. If this level breaks, since the trendline has also been broken, this time the price can move upward with more momentum, and the first target of this position would be 85482.
📊 Market volume is currently ranging, and we can’t extract specific data from this tool. But if volume increases along with an upward price movement, it would be a very good signal for the continuation of the bullish trend.
🔽 If that doesn’t happen and the price moves downward, the 83233 trigger is a very good one, and a break of this area gives us confirmation of a trend reversal, and the price can move further down.
👑 BTC.D Analysis
Let’s look at Bitcoin dominance. Dominance is still ranging and hasn’t moved much compared to yesterday.
⭐ A break of 63.61 would be suitable for a bullish move, and a break of 63.23 would be suitable for a bearish move.
📅 Total2 Analysis
Let’s move on to the Total2 analysis. This index is acting very similarly to Bitcoin and is currently near its long trigger.
🔼 For a long position, a break of 980 is suitable, and for a short position, a break of 947 is appropriate.
📅 USDT.D Analysis
Let’s check out Tether dominance. We’re still waiting for a break of 5.39, which is a very important level, and if it breaks, the price could have a long-term bearish move.
💫 For a bullish move in dominance, breaks of the 5.53 and 5.59 levels are also suitable.
❌ Disclaimer ❌
Trading futures is highly risky and dangerous. If you're not an expert, these triggers may not be suitable for you. You should first learn risk and capital management. You can also use the educational content from this channel.
Finally, these triggers reflect my personal opinions on price action, and the market may move completely against this analysis. So, do your own research before opening any position.

Crypto Market Cap: Short-Term Pullback Before Major RecoveryTechnical Analysis
The chart illustrates a well-defined ascending channel for the total crypto market cap (excluding BTC), currently experiencing a downward retracement. The price action suggests a probable dip towards the lower boundary of the channel around the $969 billion support zone before rebounding significantly. This level aligns with previous price reactions and serves as a strong demand zone, making it a potential bottom before the market resumes its uptrend.
Fundamental Analysis
Liquidity Flow & Market Sentiment
The broader market has seen increasing stablecoin dominance (such as USDT’s market cap exceeding $130 billion), indicating risk-off behavior as investors move to safety. This suggests a short-term sell-off in altcoins before a reinvestment phase.
Institutional inflows into ETFs (like Ethereum and broader crypto ETFs) will likely drive the next bullish wave, but the current correction reflects temporary uncertainty.
Macroeconomic Factors
Interest Rate Policies: If the Federal Reserve signals rate cuts in mid-2025, risk assets (including crypto) will likely benefit from increased liquidity.
Regulatory Clarity: The market is awaiting key regulatory developments, especially in the U.S. and EU, which could influence capital inflows into crypto.
Altcoin Cycle & Market Recovery
Historically, the crypto market experiences phases of correction before a strong recovery. With the next Bitcoin halving approaching (April 2025), the overall crypto market cap is expected to rebound as bullish momentum returns.
DeFi, gaming, and AI-based tokens continue to gain traction, setting the stage for an altcoin-driven rally once risk appetite returns.
Conclusion
A short-term pullback to the $969 billion support level is highly probable, after which a strong bullish reversal is expected. Long-term investors might see this dip as a buying opportunity, anticipating a rally towards the upper boundary of the channel (above $2 trillion) as macroeconomic and institutional factors align in favor of crypto.

TradeCityPro | Bitcoin Daily Analysis #60👋 Welcome to TradeCity Pro!
Let’s move on to the analysis of Bitcoin and key crypto indices. As usual, in this analysis I want to review the futures session triggers for New York.
🔍 Yesterday, both of the long triggers I gave were activated, and the price moved upward. Today is also an important day, and we can look for both long and short positions.
⏳ 1-Hour Time Frame
In the 1-hour time frame, as you can see, our long triggers from yesterday — the 83899 and 84572 levels — were activated, and the price moved up to the 85552 zone.
✔️ If the position you opened had a small stop-loss, it likely already hit your target. But if you entered with a wider stop-loss, it probably hasn't reached the target yet, which is reasonable, as your position is longer-term.
⚡️ Now for today, as you can see, the price has broken its ascending trendline and it seems the trendline trigger is getting activated. If a candle closes below the 84382 level, the price is likely to move downward.
📊 The next support the price has is at 82813, and if this level breaks, we can say that the trend has changed and the price might head toward lower lows.
💥 The 50 level on the RSI is also significant, and if the break of 84382 coincides with a break below 50 on the RSI, strong bearish momentum could enter the market.
👑 BTC.D Analysis
Let’s look at Bitcoin Dominance. This index is in a range box between 63.23 and 63.80. There’s also a mid-range level at 63.51 — breaking it would give us temporary confirmation of a bullish move in dominance.
🔽 For bearish confirmation, breaking 63.23 would be suitable.
📅 Total2 Analysis
Now onto Total2: this index hasn't fully stabilized below its trendline yet and still shows slightly more bullish momentum compared to Bitcoin.
📉 For a short position, we have a 966 trigger, but it’s quite risky. Personally, I wouldn’t open my main position with this trigger — I’d wait for confirmation using Dow Theory with a lower high and lower low.
🔼 For a long position, the trigger is clear: we can enter if the 980 level breaks.
📅 USDT.D Analysis
Let’s check Tether Dominance. This index has made a bearish move and dropped to 5.39.
⭐ The next drop trigger is the same 5.39 level, which is a very good one. For a bullish scenario, we currently need to wait for a new structure to form.
❌ Disclaimer ❌
Trading futures is highly risky and dangerous. If you're not an expert, these triggers may not be suitable for you. You should first learn risk and capital management. You can also use the educational content from this channel.
Finally, these triggers reflect my personal opinions on price action, and the market may move completely against this analysis. So, do your own research before opening any position.

TradeCityPro | ARB: Key Levels in DeFi Coin’s Descending Channel👋 Welcome to TradeCity Pro!
In this analysis, I want to review the ARB coin for you. It's one of the DeFi coins, currently ranked 54 on CoinMarketCap with a market cap of $1.41 billion.
⏳ 4-Hour Time Frame
In the 4-hour time frame, as you can see, we're witnessing a downtrend within a descending channel, and the price is moving downward.
✔️ There is a very important support at the 0.2501 level, which is the main support, and the price has already reacted to it once, bounced from the bottom of the channel, and is now positioned above the channel’s midline.
🔽 If the price fails to reach the top of the channel and gets rejected from lower levels such as the 0.3172 resistance, the probability of the channel breaking to the downside increases, and more bearish momentum may enter. When the price gets rejected before reaching the channel top, it indicates weakening buyer strength.
✨ So, if the price gets rejected from the 0.3172 resistance, we can open a suitable position. The lower the rejection, the higher the probability of a drop. A rejection from the channel top or even a fake breakout can also act as a valid trigger.
📉 The main trigger for a short position is the break of the 0.2501 level, which is a very strong support, and its break can lead to a significant bearish leg.
⚡️ For a long position, the first trigger is the break of 0.3172, which is a good area but very risky, because just above it lies the channel ceiling, and the price might get rejected from there and move downward.
🔼 Therefore, it's better to wait for the channel to be broken first and then look for a long trigger. Currently, the most reliable trigger for a long position after a channel breakout is at 0.4018, but this level is quite far. So, for a long position, we can also enter on a pullback to the channel or after getting confirmation from Dow Theory.
📝 Final Thoughts
This analysis reflects our opinions and is not financial advice.
Share your thoughts in the comments, and don’t forget to share this analysis with your friends! ❤️

TradeCityPro | Bitcoin Daily Analysis #59👋 Welcome to TradeCity Pro!
Let’s move on to the analysis of Bitcoin and key crypto indices. In this analysis, as usual, I’ll review the futures session triggers for New York.
🔄 Yesterday, one of the long triggers was activated, and the price moved up to the 83899 zone. Let’s see what triggers we can identify from today’s price action.
⏳ 1-Hour Time Frame
In the 1-hour time frame, as you can see, the price broke through the 83349 level yesterday and moved up to 83899. However, the candles weren’t strong enough to break this zone, and the price reached the resistance range between 83899 and 84572, then got rejected.
✨ An ascending trendline that started from the 74760 low has been accompanying the price, and each time the price has touched this trendline, the following bullish leg has been shorter, indicating a gradual weakening in bullish momentum.
✔️ Currently, the price is near the trendline, and if bearish momentum enters the market and selling volume increases, breaking the trendline trigger can give us a short position.
💫 The current trendline trigger is at 83813, and if it breaks, the price could open positions down to 80595 or even 78778.
💥 As mentioned, there is a resistance zone above the current price, which seems quite strong. The first trigger to break this resistance is 83899, and the second is 84572. The first trigger is riskier and more likely to hit the stop-loss. The second trigger, being higher, might not give a good candle setup, making it harder to enter a position, but it’s more reliable.
📊 If buying volume increases, a bullish move toward 88502 is likely. If selling volume increases, the likelihood of the trendline breaking also rises.
🔑 The RSI oscillator is also oscillating in the upper half. Entering the overbought zone could be a signal for long positions, while a break below 50 would be suitable for shorts.
👑 BTC.D Analysis
Let’s take a look at Bitcoin Dominance. Yesterday, BTC.D had a bullish move up to 63.80 but got rejected from that area and has now returned to the range between 63.30 and 63.50.
⭐ Today, a bearish confirmation for BTC.D comes with a break below 63.30, while a bullish continuation is confirmed with a break above 63.50.
📅 Total2 Analysis
Moving on to Total2: today this index continued its bullish movement and even broke the 957 trigger. If this move continues up to 989, altcoins could experience significant growth—especially considering the weakening momentum in BTC Dominance.
🧲 Today, there is no long trigger for Total2, but if this move turns out to be a fakeout, the 934 zone will be a good trigger for a short position.
📅 USDT.D Analysis
Now for Tether Dominance: its short trigger has been activated. The next support level is at 5.41, and if this zone breaks, we could see a sharp downward move.
⚡️ For a bullish reversal in dominance, the first trigger is the 5.59 area, and if dominance stabilizes above this level, we can consider opening short positions on Bitcoin and altcoins.
❌ Disclaimer ❌
Trading futures is highly risky and dangerous. If you're not an expert, these triggers may not be suitable for you. You should first learn risk and capital management. You can also use the educational content from this channel.
Finally, these triggers reflect my personal opinions on price action, and the market may move completely against this analysis. So, do your own research before opening any position.

TradeCityPro | Bitcoin Daily Analysis #58👋 Welcome to TradeCity Pro!
Today, we'll delve into the analysis of Bitcoin and key crypto indices. As usual, I want to review the triggers for the New York futures session.
🔄 Yesterday, the price broke through the support zone between 80,595 and 81,522, retracing down to 78,778. Let's see what triggers the market could offer us today.
⌛️ 1-Hour Timeframe
On the 1-hour timeframe, as you can see, after breaking the 78,778 level, the price quickly recovered and climbed back above the 81,522 zone. Currently, it is hovering near 83,349.
🔍 Today, for a long position, we can consider opening a trade upon breaking the 83,349 resistance. The next resistance level at 84,572 could act as the following trigger point.
🔽 For short positions, we need to wait for a new market structure to form and observe whether the 81,522 or 80,595 zones can serve as our triggers.
⭐️ The RSI oscillator is near the Overbought zone, and a breakout above 70 into Overbought territory would provide good confirmation for a long position.
📊 Market volume has been increasing since the bullish leg started from 78,778. If this volume growth continues, the probability of breaking through the 83,349 resistance will rise.
👑 BTC.D Analysis
Now, let's move to Bitcoin Dominance (BTC.D). Yesterday, the 63.50 resistance was broken, and as Bitcoin's price climbed, its dominance also rose. This has caused altcoins to underperform compared to Bitcoin.
🔼 Currently, the next resistance for BTC.D is at 63.86. A break above this level would confirm the next bullish leg in Bitcoin Dominance.
📉 For a bearish move in dominance, the Futures triggers are at 63.50 and 63.30. However, for a confirmation in spot trading, we would need a break below 62.65.
📅 Total2 Analysis
Moving on to the Total2 (altcoin market cap excluding Bitcoin), I've slightly adjusted the zones and updated the triggers for altcoins.
✨ As I mentioned in the Bitcoin Dominance analysis, altcoins have been lagging behind Bitcoin. Even though Bitcoin reached 83,349, Total2 failed to retest its previous highs and instead formed a lower high.
✔️ For long positions on altcoins, a break above 940 would be ideal. For short positions, you can look for confirmation if 903 is broken.
📅 USDT.D Analysis
Finally, let's analyze USDT Dominance (USDT.D). Yesterday, it bounced from the 5.53 support level, climbing to 5.84 before starting a new downtrend, now approaching 5.53 again.
⚡️ To continue the bearish move, a break below 5.53 would be significant. Conversely, for a bullish move, the first trigger is at 5.84.
❌ Disclaimer ❌
Trading futures is highly risky and dangerous. If you're not an expert, these triggers may not be suitable for you. You should first learn risk and capital management. You can also use the educational content from this channel.
Finally, these triggers reflect my personal opinions on price action, and the market may move completely against this analysis. So, do your own research before opening any position.

TradeCityPro | Bitcoin Daily Analysis #57👋 Welcome to TradeCity Pro!
Today, we'll delve into the analysis of Bitcoin and key crypto indices. As usual, I want to review the triggers for the New York futures session.
🔄 Yesterday, there was news from Trump granting a 90-day tariff reprieve to all countries except China, which activated both long triggers I outlined for you yesterday—one before the news and one after.
⏳ 1-Hour Time Frame
In the hourly time frame, as you can see, after the price was supported at 74760 in yesterday's analysis, I mentioned that breaking 77735 could be a risky long entry and breaking 80595 would activate the Double Bottom long trigger.
🔍 As observed, the first trigger at 77735 provided a very good entry, allowing us to open a robust position. However, the 80595 position, as it activated a four-hour pattern, naturally takes longer to reach the target or stop-loss.
📈 Currently, the price has made a bullish leg and is in a correction phase, and we need to see how far this correction can continue. A new support is forming at 81522, where the price had previously shown support and is now being supported again.
✔️ With 80595 and 81522 being close, we can say that a yet unconfirmed support zone has formed around this area, and the price could start its next bullish move after correcting into this zone.
🔼 Thus, for a long position, reacting to this support zone and breaking the short-term ceiling in lower time frames can give us a position. The next trigger is breaking the ceiling at 83349, which could start the next bullish leg upon making a higher high.
💫 However, the main trigger for going long is breaking 84572, which is a major resistance. Since this area is very significant, I wouldn't open a position with just the break of 83349, as a rejection from 84572 could hit our stop-loss and poses a high risk.
✨ If you recall, in analysis number 52, I drew a trendline in the daily time frame that now coincides with this price area, and the trigger for breaking this trendline overlaps with 84572, another reason this resistance is significant and why its breach is crucial.
🔽 For short positions, as you know from following my analyses, I trade based on the current momentum and market trend. Since we have entered a bullish momentum and no bearish structure has been formed yet, there is no reason for a short position. However, if you still want to open one no matter what, breaking areas 81522 or 80595 could be very risky but suitable.
👑 BTC.D Analysis
Yesterday, there was a detailed analysis of Bitcoin dominance, complete with explanations of its utility and why we use it. I strongly recommend reviewing that analysis to understand why this chart needs to be checked and what's happening in its higher time frames.
☘️ Yesterday, the dominance faked out from the area of 63.30, then returned above this area, moving towards the ceiling of the box it had created, 63.50, and now it seems to be faking this area too.
⚡️ When this occurs in the chart, it indicates that the chart is not analyzable correctly, and we must wait until a proper structure is formed. Until then, we can decide candle by candle, following the momentum of each candle.
📅 Total2 Analysis
Moving on to the analysis of Total2, triggers in the areas of 896 and 920 were activated, and the price movement continued near the area of 965, now entering a corrective phase.
📊 The support floor being formed is slightly above 920, and we should wait for a new structure. Until then, breaking 965 for a long and breaking 920 for a short are suitable.
📅 USDT.D Analysis
Let's turn to Tether dominance, which, like Total2 and Bitcoin, has had its triggers activated and moved downward, reaching the support area at 5.53.
🎲 We confirm the continuation of the downtrend with the break of this 5.53, and for further correction, breaking 5.73 gives us confirmation.
❌ Disclaimer ❌
Trading futures is highly risky and dangerous. If you're not an expert, these triggers may not be suitable for you. You should first learn risk and capital management. You can also use the educational content from this channel.
Finally, these triggers reflect my personal opinions on price action, and the market may move completely against this analysis. So, do your own research before opening any position.

TradeCityPro | Bitcoin Daily Analysis #56👋 Welcome to TradeCity Pro!
Let's dive into the analysis of Bitcoin and key crypto indices. Today, as usual, I will review the New York futures session triggers.
✔️ Yesterday, the short trigger we discussed was activated, and the price moved downward to the area of 74760.
👀 Today, the market conditions are favorable for opening positions, both long and short.
⏳ 1-Hour Timeframe
As I mentioned yesterday, the price executed another downward leg after pulling back to the 80595 area, activating our trigger at 78913 and moving to the main support floor. Today, I have adjusted this area, and we will explore why this adjustment was made.
📚 Positions like the one yesterday, which are opened for scalping, I usually set with a risk to reward ratio of 2 or 3, and I don’t leave them open for long, opting instead to secure profits. If you also open such positions, I recommend not holding them long term.
💥 However, today, as you can see, the price is forming more structure and giving us more logical triggers. The SMA99 indicator is nearing the price, and the RSI is showing divergence compared to the first bottom that the price made at 74650, which was accompanied by divergence.
🔼 For the divergence in RSI to activate, it needs to break the area of 59.87. If this happens, we can say that the divergence is active, and we can look for a price trigger for a long position.
⚡️ The first trigger for a long position is the 77735 area, which is considered risky, and with the breaking of this area, you can open a scalping position. The main long trigger is the breaking of 80595, which, if broken, activates a Double Bottom pattern that could change the market trend.
⭐ Keep in mind, there is currently no Double Bottom, and only if the 80595 area breaks will this pattern form.
📉 For a short position, the 74760 trigger is still appropriate, and you can enter a short position if this area breaks. However, it is important to note that this area is very close to the 71779 area, and opening a position on the break of 74760 will be risky.
👑 BTC.D Analysis
Let's now analyze Bitcoin dominance, which continues to range between the areas of 63.30 and 63.50. Breaking this box could define the positions we open today.
💫 If the 63.30 area breaks, dominance might temporarily decline, allowing more capital to flow into altcoins. Conversely, if the dominance breaks upwards at 63.50, more capital will flow into Bitcoin. Soon, we will have a comprehensive analysis of Bitcoin dominance that I highly recommend not to miss.
📅 Total2 Analysis
Moving on to the analysis of Total2, yesterday the Total2 trigger at the 896 area was activated, and altcoins, like Bitcoin, declined, causing this index to drop to the area of 860.
🔍 Today, for a short position, breaking the 860 area is appropriate. However, for a long position, I recommend seeking confirmation from Bitcoin itself and its dominance.
📅 USDT.D Analysis
Finally, for the Tether dominance analysis, this index activated its upward trigger at the 5.84 area and performed an upward leg to 6.13.
📊 Currently, confirmation for the next upward leg in dominance will be with the breaking of 6.13, and the confirmation for a downward turn remains at the 5.73 area.
❌ Disclaimer ❌
Trading futures is highly risky and dangerous. If you're not an expert, these triggers may not be suitable for you. You should first learn risk and capital management. You can also use the educational content from this channel.
Finally, these triggers reflect my personal opinions on price action, and the market may move completely against this analysis. So, do your own research before opening any position.

TradeCityPro | Bitcoin Daily Analysis #55👋 Welcome to TradeCity Pro!
Let's delve into the analysis of Bitcoin and key crypto indices, focusing today on the New York futures session triggers as usual.
🔄 Yesterday, the market was in a corrective phase of a downward trend, coinciding with news about the date of a meeting between Iran and the USA, which caused a slight upward movement in the market.
📊 As I mentioned, due to the low market volume, any news from the USA can significantly impact the price. The news was that Iran and the USA have scheduled a meeting for Saturday to negotiate an agreement.
📰 However, a more significant news item that the whole world is waiting for is China's reaction to the 35% tariffs imposed by the USA. Trump has declared that if China does not accept these tariffs within the next few days, he will increase them to 50%.
🎲 If this happens, the next downward leg in price might begin. However, if news comes out that these two countries are nearing an agreement and are ready to negotiate tariffs, the market will undoubtedly move upwards, and this news could even be the start of a new bullish trend.
Let's move on to the chart to find the technical triggers.
⏳ 1-Hour Timeframe
As I said yesterday, with the breaking of the 50 area in the RSI, the price underwent a deeper correction and moved upwards.
⭐ It appears that an ascending structure is forming, and the price is steadily moving upwards. However, this movement doesn't have much upward momentum, and its volume isn't very high.
🔽 Today, for a short position, we can open a position in line with the trend at a high risk with the break of the 78913 area. The price has corrected to a reasonable extent and has pulled back near the SMA99. If the price moves towards this SMA and gets rejected, the importance of breaking 78913 will increase.
📉 The main trigger is currently the 74760 area, which is the market's primary floor. However, in general, I believe that the market structure isn't yet in a state where we should open major positions, and we should wait for more structure to form. This way, we can open more secure and precise positions, which would allow us to take higher risks and ultimately make more profit.
💫 If you want to open a short position with the break of 78913, the RSI moving below the 50 area could be a good confirmation, but be careful not to involve too much risk.
👑 BTC.D Analysis
Let's move to the analysis of Bitcoin dominance, which is still ascending and has created a temporary support floor at 63.30. If this area breaks, we might temporarily confirm a decline in dominance.
🚀 Keep in mind that the dominance trend is bullish in all market cycles, and breaking this area does not mean a bearish trend. However, if it breaks 63.30, dominance might pull back to 63.07 and could enter a correction phase for a few days, which would impact our position choices.
✔️ If dominance is supported from this area, the likelihood of its continued growth increases.
📅 Total2 Analysis
Moving on to the analysis of Total2, as you can see, with the slight correction of Bitcoin dominance, this index has performed slightly better than Bitcoin and has currently reached a similar peak at 920.
📉 The short trigger I gave on Bitcoin at 78913 is a better trigger compared to Total2, where the 896 area has not yet been tested and is riskier than Bitcoin.
🔼 For long positions, you can open one with the break of 920, but I do not recommend it because the market is in a downward trend, and there is a downward momentum in the market, and since I do not trade against the trend, I also do not recommend that you take a long position against the downward trend.
📅 USDT.D Analysis
Finally, the analysis of Tether dominance is performing similarly to Total2 and is currently fluctuating between 5.73 and 5.84.
✨ Both of these areas could be used as triggers, but as I mentioned, it's better to wait for the market to create more structure and reveal the main triggers.
❌ Disclaimer ❌
Trading futures is highly risky and dangerous. If you're not an expert, these triggers may not be suitable for you. You should first learn risk and capital management. You can also use the educational content from this channel.
Finally, these triggers reflect my personal opinions on price action, and the market may move completely against this analysis. So, do your own research before opening any position.

TradeCityPro | Bitcoin Daily Analysis #54👋 Welcome to TradeCity Pro!
Let's delve into the analysis of Bitcoin and key crypto indices. As usual, I will review the New York futures session triggers for you.
⚡️ The market has experienced a drop since yesterday, and I had identified the triggers for this drop in the previous analysis. Let's analyze today to see what we can do in the market.
⏳ 1-Hour Timeframe
In the 1-hour timeframe, as you can see, the price made a downward move after the triggers at 82633 and 81473 were activated, even breaking the important support at 79120 and now has rebounded from the area of 74760.
✔️ If we draw a Fibonacci from this downward leg, we can find potential resistance levels. A few moments ago, there was also a fake news report from Trump stating that he would give 90 days to all countries except China to start tariffs, which, although fake, had a significant impact on the market.
📊 The market volume is very low, which makes it susceptible to such short and small news about tariffs to react this way.
📰 If such news continues and the market acts emotionally, the technical analysis I perform for you will not be very reliable, and the price will move more emotionally.
🔼 However, if these emotional moves end and the price stabilizes in these areas, the potential resistances we have are the Fibonacci levels of 0.5, 0.618, and 0.786, where the 0.5 and 0.786 areas overlap with static price resistances, and the 0.618 area, being the golden Fibonacci, could prevent further price drops.
💥 The RSI oscillator, after a sharp fall and being mostly in Oversell yesterday, has finally exited this area and now reached around 50. If this area is broken in the RSI, the likelihood of a deeper correction will increase.
📉 Today, for a short position, we only have the break of the 74760 area, which I also suggest not opening a position with this trigger because the market has recently moved and needs to create a new structure.
📈 For long positions, according to the strategy I have, it does not make sense for me to open a position in this trend that has so much downward momentum. The best analogy is that when a knife is falling, you shouldn't try to catch it mid-air because it might cut your hand; you should wait for it to fall to the ground so you can pick it up safely without risk.
Let's look at the indices to take a look at the situation with altcoins.
👑 BTC.D Analysis
Bitcoin dominance has made another upward move after breaking 63.07. This caused altcoins to fall more than Bitcoin during this drop, and short positions on altcoins would have given us more profit compared to Bitcoin.
🚀 In the analyses of Bitcoin and altcoins, I've repeatedly told you that for buying altcoins, we should wait until Bitcoin dominance starts to drop. That hasn't happened yet, and it still has a strong upward trend, so today if the market gives a short trigger, altcoins would be more logical.
📅 Total2 Analysis
As you can see, this index has fallen much more than Bitcoin, experiencing a very sharp downward leg upon activating the trigger at 965.
⭐ Currently, I've only added the 949 line to the chart, which overlaps with the 0.786 Fibonacci of this downward leg, and I haven't added any other lines and am waiting for the price to create its structure.
✨ The nearest support the price has is 816, which is very important, and there is nothing else notable about Total2 yet, and we need to wait until a structure is created that can be analyzed.
🎲 The only opinion I can give for now is that the 816 area is very important, and reaching this area in Total2 could end its downward trend, which is more like a prediction than an analysis and is a gut feeling and currently has no logical reason.
📅 USDT.D Analysis
Let's move on to the analysis of Tether dominance, which is very similar to Total2 but seems like a reverse of it.
👀 Yesterday, the trigger at 5.53 activated simultaneously with 965 in Total2, and the dominance moved upward. There's not much I can analyze about this chart, and the main resistance is in the area of 6.34, which acts like the 816 in Total2.
❌ Disclaimer ❌
Trading futures is highly risky and dangerous. If you're not an expert, these triggers may not be suitable for you. You should first learn risk and capital management. You can also use the educational content from this channel.
Finally, these triggers reflect my personal opinions on price action, and the market may move completely against this analysis. So, do your own research before opening any position.

TradeCityPro | Bitcoin Daily Analysis #53👋 Welcome to TradeCity Pro!
Let's dive into the analysis of Bitcoin and key crypto indices. As usual, I want to review the New York futures session triggers for you.
💥 If you missed yesterday's analysis, I highly recommend checking it out. I cleared all the lines from all charts yesterday and redrew them from scratch, and now we have new areas that are optimized compared to before.
⏳ 1-Hour Timeframe
In the 1-hour timeframe, as you can see, there was a symmetrical triangle that has broken downwards, and now it's ready to activate its trigger if it breaks and move downwards.
⚡️ So, for opening a short position, you can enter upon breaking the short-term support at 82633. Preferably, keep a small stop loss so that if the price reaches 81473, the target of the position becomes active.
🎲 Although the triangle has broken, no significant selling volume has entered the market yet, and it's evident that the price is waiting for a good volume to enter to bring momentum.
📊 If no selling volume enters the market, the price could potentially move upwards towards the trigger at 83555. This trigger is risky for a long position, and breaking this area, we can open an early long position.
👑 BTC.D Analysis
Moving on to the analysis of Bitcoin dominance, as you know from yesterday's analysis, we concluded that the dominance trend is upward, and recently, with the breaking of 62.24, the next leg has started.
✔️ Currently, in this timeframe, a ranging box has formed between 62.65 and 63.07, and breaking the top of this box could continue the upward trend. On the other hand, breaking the floor at 62.65 could disrupt the upward trend for now, but as long as this doesn't happen, I still think the dominance has an upward trend.
📅 Total2 Analysis
Moving on to the Total2 analysis, this index is on a very important support floor in the area of 965B, and given the downward momentum that this index has had before, there is a possibility that this area might break.
🔑 If this support breaks, the next downward leg can start. Conversely, the same reason might cause this support to become so strong that it doesn't break.
📈 If the price is supported from this area and moves upward, the first risky trigger for long is at 989B, and the main trigger will be at 1.02T.
🔽 For short positions, as I mentioned, the 965B area is very important, and breaking this area could open a long-term position.
📅 USDT.D Analysis
Moving on to the analysis of Tether dominance, this index is dealing with an important resistance in the area of 5.53, and breaking this area would be akin to breaking the 965B in Total2.
☘️ For confirmation of a long position, 5.41 is suitable.
❌ Disclaimer ❌
Trading futures is highly risky and dangerous. If you're not an expert, these triggers may not be suitable for you. You should first learn risk and capital management. You can also use the educational content from this channel.
Finally, these triggers reflect my personal opinions on price action, and the market may move completely against this analysis. So, do your own research before opening any position.

TradeCityPro | Bitcoin Daily Analysis #52👋 Welcome to TradeCity Pro!
Let's delve into the analysis of Bitcoin and the key cryptocurrency indices. Today, we have a detailed analysis on hand, and I want to start from scratch by drawing all the lines for Bitcoin and other indices so we can get informed about the higher time frames without drawing unnecessary lines.
🔍 Let's get into the analysis, where the charts will be examined in weekly, daily, and 4-hour time frames.
🦁 Bitcoin Analysis
📅 Weekly Time Frame
Let's explore the weekly timeframe. As you can see, the market trend is bullish, and since the price reached the low of 16,000, a bullish structure has formed, and the price has moved upward along a curved trendline. The trendline isn’t very clear on the chart, so I'll put another chart below for you if needed.
✔️ Currently, after two powerful bullish legs that occurred after breaking 31,000, the price has reached the resistance of 104,000 and has entered a corrective phase. The price was moving up with high momentum and no divergence until it reached 71,000, but the next peak at 104,000 was accompanied by divergence, and now the RSI is near triggering this divergence.
⚡️ Overall, the price is in a very critical and sensitive area, and breaking the 44.83 area on the RSI could activate the divergence, and simultaneously, the price may also break the curved trendline, which is not a good sign for the bullish trend and could indicate a trend reversal.
🔼 We must consider that the last bullish leg from 54,000 to 104,000 was much shorter compared to the leg from 31,000 to 71,000. However, I personally see the trend as bullish until the price drops below the 71,000 area, and until a lower high and low are seen below this area, the trend will remain bullish.
📊 If the price sharply falls, breaking 54,000 will confirm a trend change. However, we can get confirmation of a trend change sooner in lower time frames, which I will discuss in the continuation of the analysis.
💥 But everything is set for Bitcoin to rise. The RSI oscillator is at its main bottom, and in this bullish cycle, each time the RSI reached this area, the next bullish leg started. On the other hand, the price has reached the curved trendline, and there is positive news like Bitcoin's strategic reserves in the US, so conditions are ripe for a rise.
📈 Thus, with a break of 104,000, we can confirm the next leg and buy Bitcoin targeting a new ATH.
🎯 To find the target, we can use Fibonacci Extension. As you see, the price has moved up to the 0.618 Fibonacci level and reached the 104,000 area, currently in a corrective phase to 0.382. If it can rise above 0.618 again, the next targets are 0.786, 1, and 1.272, which correspond to areas 123,000, 154,000, and 204,000, respectively.
👀 Let’s go to the daily timeframe to observe the price details more closely.
📅 Daily Timeframe
In the daily timeframe, as you can see, in the bullish leg that occurred after breaking 71,000, the price moved upward and reached 106,000 and, after breaking the 0.236 Fibonacci overlapping with 92,000, went into a deeper correction to 0.5.
⭐ In this corrective leg, the price has created a descending trendline that has been touched several times by the price and is now still engaging this area. If it can break this trendline, the correction will end, and we could see a price increase again.
🧩 In the RSI oscillator, a resistance has formed at 52.26, and breaking this area could bring bullish momentum into the market, which increases the likelihood of breaking the trendline and activating its trigger.
⚡️ There is also a temporary support in the area of 82,124, and if the price gets rejected from the trendline, the likelihood of breaking this support increases, and the price could undergo another bearish leg down to areas 76,000 or 71,000.
🛒 Currently, for buying Bitcoin in spot, the first trigger is the breaking of 87,740, which is a trendline trigger and will be activated after the trendline is broken. The main trigger will be after breaking 106,546, which is the ATH, and a new bullish phase could start.
☘️ The next trigger for Bitcoin is further falls and reaching lower support areas. If the price reaches areas 76,000 or 71,000 and forms a structure there, with the break of the ceiling of the structure, we can carry out a spot purchase, and if this happens, I will specify its triggers in future analyses.
⏳ 4-Hour Time Frame
Let's go to the 4-hour timeframe to review the triggers for Bitcoin futures.
🎲 As you see in this timeframe, a descending triangle has formed, and the price is moving inside it. The dynamic line of this triangle is the daily trendline, and the static line of this triangle is the 81,509 area, which both are important areas and can have a significant impact on the price.
✔️ We are currently in the latter half of the triangle, which is why behaviors and irrational fluctuations have increased, and as you can see, the price has once broken the ceiling of this triangle but couldn’t reach the trendline break trigger and has returned to the triangle.
📈 Currently, for a long position with the break of 84,414, you can enter a position. This position is risky because the trigger is inside the triangle and will be a prelude to breaking the daily trendline. The next main trigger will be after breaking the trendline and activating the 88,344 trigger.
🔽 For a short position, the bottom 81,509 is a very important floor, and with the break of this area, the price can move towards the triangle's target and the 78,620 support.
👑 BTC.D Analysis
📅 Weekly Time Frame
Let's move on to the analysis of Bitcoin dominance. In the weekly timeframe, as you see, a slow and steady bullish trend has been created after breaking 47.33, moving upward along with a bullish trendline, and has once broken this trend from below but has returned above this dynamic area.
🧲 As long as this index is bullish in the bullish legs of the market, Bitcoin will move up more than altcoins, and the increase in Bitcoin dominance causes altcoins to behave very similar to Bitcoin, and it is less likely that the trends of altcoins and Bitcoin diverge.
📚 You can see the impact of this trend inside the Bitcoin and altcoin charts. Bitcoin has registered its previous peak at 106,000 and has recorded a much higher ATH compared to 69,000, but most altcoins in this leg that the market had didn't even reach their previous peaks.
✨ The trend is still bullish without any weakness, and recently, an important ceiling in the area of 60.37 has been broken and has pulled back to it, and now it is moving towards the next resistance, namely 71.43.
💥 But I think dominance will fall before it reaches 71.43 because the dominance is very high right now, and any correction that Bitcoin has causes very severe falls inside the chart, and well, when altcoins fall enough, whales and major investors will enter the altcoin market, which naturally causes Bitcoin dominance to fall.
🔑 So to know when major investors and whales enter altcoins, we have to wait until Bitcoin dominance falls, and this event is currently happening in the weekly timeframe after breaking the trendline and confirming a trend change below this trendline, and until then, Bitcoin will be the capital for better purchases.
📅 Daily Timeframe
Let's move to the daily timeframe. As you can see, after breaking the resistance of 60.37, dominance created a box between 60.37 and 62.16, and now with the break of the box's ceiling, a new bullish leg of dominance has started.
✔️ I usually analyze dominances only with simple tools like support and resistance, but now because I can't get any targets out for dominance, I took help from Fibonacci, and as you see, the potential resistances of dominance are 63.31, 65.15, and 66.49.
🔍 Currently, there is no sign of weakness or trend change in this timeframe, but if for any reason dominance falls and returns below 62.16, we will take the main confirmation of trend change from 60.37.
😎 Let's go to the 4-hour timeframe to find suitable triggers for these dominance futures.
⏳ 4-Hour Time Frame
In this timeframe, we have a temporary ceiling in the area of 63.02, and if it is broken, the price can continue its bullish movement.
💫 For dominance to fall, we currently don't have any triggers in this timeframe and have to wait for a bearish structure to form.
📈 Total2 Analysis
📅 Weekly Timeframe
Let's move on to the analysis of Total2. In this chart, we can very clearly see the impact of Bitcoin dominance on altcoins.
👀 As you can see, the conditions of Total2 are very similar to Bitcoin and are converging, but Bitcoin in the last bullish leg it had registered a new ATH, and Total2 could not do this. On one hand, Bitcoin has just reached its curved trendline and is reacting to it, but Total2 has broken this trend line and has performed a bearish leg. For example, Bitcoin has not yet reached the 71,000 area, but Total2 has long broken 1.21T and is moving towards the bottom of 816B.
🔑 The reason for all these events is that Bitcoin dominance is bullish and causes more money relative to altcoins to enter Bitcoin, and this also makes the bullish trend of Bitcoin more powerful than this index.
🛒 For buying altcoins, the triggers of Total2 are areas 1.21T and 1.61T, but until Bitcoin dominance falls and its trendline is broken, do not pay attention to these triggers and enter the market with Bitcoin triggers while dominance is bullish.
📅 Daily Time Frame
Let's move to the daily timeframe. Concurrent with the fall of Total2, a descending channel has formed, which in Bitcoin was a descending trendline, but here, as you can see, Bitcoin is involved in breaking the trendline and starting an upward wave, but Total2 has long been rejected from the trendline and is involved in breaking the middle line of the channel, which overlaps with the 961B area, and with the break of this area, the next price leg can start.
⚡️ This is another example of the impact of Bitcoin dominance on the market. I mentioned these examples to get you to take dominances seriously and know how important they are and can help us in analysis.
🔽 The trigger for the fall and bearish turn of Total2, as I said, is the breaking of 961B, and if this area is broken, the price can move to the static supports of 816B and 683B. The dynamic support is the bottom of the channel, which can act as a support to prevent the price from falling.
📈 For bullishness and buying spot, breaking 1.1T is suitable. Again, I remind you that until Bitcoin dominance falls, these triggers are not very useful and do not initiate the trend of altcoins.
⏳ 4-Hour Time Frame
Let's move to the 4-hour timeframe to review the triggers for futures.
⭐ In this timeframe, I don't have much to say, and I just want to specify the triggers for you. For a long position, the area of 1.02T is suitable, but it is better that this happens after breaking the channel, which would turn it into a better trigger. The main long position will occur after breaking 1.1T.
📉 But for a short position, we have a very good and important trigger in the area of 961B, and I suggest that you definitely have a short position on an altcoin if this area is broken.
✔️ USDT.D Analysis
📅 Weekly Time Frame
In the weekly timeframe, Tether dominance has created a large box between 3.78 and 6.21 and has been moving between these two areas since early 2024.
💥 On the other hand, it has a descending trendline that the price has touched twice, and now it has reached it for the third time. A trendline that has been reacted to twice is not a very reliable trendline, but if the price returns from this area this time, we can confirm that this trendline exists and is a dynamic supply area.
☘️ Currently, with the range box that has formed, we have a very easy job for Tether dominance. With the break of 6.21, we confirm bullishness, and with the break of 3.78, we confirm bearishness.
📅 Daily Time Frame
Let's move to the daily timeframe, where we can witness more details.
🎲 As you can see, the price is very close to the trendline that was evident in the weekly timeframe and can activate its trigger.
⚡️ If the trendline is broken, a very important trigger exists in the area of 5.68, and with the break of this area, we can get confirmation of the bullishness of dominance at least until the ceiling of 6.34.
🧲 On the other hand, if dominance is rejected from this trendline, with the break of 5.03, dominance can create another bearish leg down to 5.37 or 3.78.
💣 I have nothing else to say about Tether dominance because its trend is ranging, and its situation is clear for now, let's move to the 4-hour timeframe to review the triggers for futures.
⏳ 4-Hour Time Frame
In this timeframe, we can change the trigger for bullishness a bit and bring it to the area of 5.56. If this area is broken, dominance can start a bullish leg.
🧩 For Tether dominance to fall, we also have a riskier trigger in the area of 5.43, and the main trigger will still be the area of 5.03.
🚨 This was a complete analysis of Bitcoin and the indices. It had been a while since we had looked at the higher timeframes, so I decided to review all the symbols in three timeframes. I hope this helps you and you can use this analysis.
❌ Disclaimer ❌
Trading futures is highly risky and dangerous. If you're not an expert, these triggers may not be suitable for you. You should first learn risk and capital management. You can also use the educational content from this channel.
Finally, these triggers reflect my personal opinions on price action, and the market may move completely against this analysis. So, do your own research before opening any position.

Massive storm hiting the crypto market soon!The Correlation Between SPX500 (Wall Street) & Crypto 📉📈
The relationship between SPX500 and crypto is not always stable. Sometimes they move in sync, like the Earth and Moon, and other times, they are completely decoupled. But rarely, we get an eclipse—a moment of total disconnection.
And guess what? That’s about to happen.
🔎 What’s Happening?
Looking at the charts, SPX500 had a massive rally last year, but while Wall Street boomed, crypto was bleeding. Most altcoins were slaughtered, and the TOTAL crypto market cap suffered.
But now, SPX500 is overbought, while crypto is oversold.
👉 This time, the decoupling will work in crypto’s favor!
💰 $2 Trillion in Sidelined Cash Ready to Flow In
Right now, about $2 trillion USD is sitting on the sidelines—money that institutional investors are hesitant to deploy due to market uncertainty. Many are keeping their funds in USD or foreign bonds instead of taking risks.
However, if you check my April/May forecast, we can see that:
✅ Crypto will be deeply oversold (confirmed by RSI & weekly MACD crossover).
✅ The US Dollar is weakening, forcing investors to move their money into other assets.
✅ SPX500 turning bearish = capital rotating into crypto.
🚀 The Perfect Storm for Crypto
📉 SPX500 bearish
💵 USD weakening
📈 Crypto bullish
This creates the perfect setup for rich investors to flood the crypto market with fresh liquidity.
💡 What does this mean for prices?
- CRYPTOCAP:BTC could double (100% gain).
- Altcoins could skyrocket (x10 to x100).
- This would finally trigger the altseason we’ve been waiting for—the parabolic move that happens once every four years.
📆 Timeline: April – June 2025
This move will be so explosive that it will eventually trigger a correction—possibly leading to a bear market. However, since crypto now moves in 6-month cycles, this correction should end by December 2025, setting up another leg up.
🏁 Final Thoughts
This kind of SPX500 & crypto decoupling is extremely rare, so positioning before the rotation starts is crucial.
⏳ Exact timing? Hard to say. But April/May looks like the moment when everything aligns.
🚨 DYOR as always—anything can happen to invalidate this idea.

TradeCityPro | Bitcoin Daily Analysis #51👋 Welcome to TradeCity Pro
Let's move on to the fiftieth analysis of Bitcoin and key crypto indices. In this analysis, as usual, I want to review the New York futures session triggers for you.
⏳ 1-hour timeframe.
As you can see in the 1-hour timeframe, after the news of US tariffs, the market experienced a drop to the support zone, and now, for the second time, it has penetrated this area.
🔍 If this range between 81520 and 82302 is broken, the price could start the next bearish leg, but another important support is located at 80105, which might prevent further decline.
🔽 For a short position, breaking this range is suitable. For a long position, it's better to wait until a new structure forms.
👑 BTC.D Analysis
Moving on to Bitcoin dominance, the 62.64 zone has also been broken, and dominance has pulled back to it and is now moving upward.
💫 I cannot determine a resistance level at the moment, and we need to wait until the price structure forms new resistance levels.
⚡️ For now, I see Bitcoin dominance as bullish, so it's better to choose Bitcoin for long positions and altcoins for short positions.
📅 Total2 Analysis
Moving on to the Total2 analysis, yesterday the price pulled back to 990 and has now reached 953.
✔️ If this zone is broken, the price could experience a sharp bearish movement and start the next leg. For a long position, like Bitcoin, we need to wait for a new structure to form.
📅 USDT.D Analysis
Moving on to USDT dominance, a very sharp upward move with strong momentum has occurred, and a higher low compared to 5.05 has been formed.
🧩 Currently, there is an important resistance at 5.56, and the price has reached this level. If this zone is broken, dominance will turn bullish.
💥 For a bearish move in dominance, like other indices, we need to wait for a new structure to form.
❌ Disclaimer ❌
Trading futures is highly risky and dangerous. If you're not an expert, these triggers may not be suitable for you. You should first learn risk and capital management. You can also use the educational content from this channel.
Finally, these triggers reflect my personal opinions on price action, and the market may move completely against this analysis. So, do your own research before opening any position.

I think we will see 1.7T in 2026.The most probable scenario in my head.
* What i share here is not an investment advice. Please do your own research before investing in any digital asset.
* Never take my personal opinions as investment advice, you may lose all your money.

TradeCityPro | Bitcoin Daily Analysis #50👋 Welcome to TradeCity Pro
Let's move on to the 50th analysis of Bitcoin and key crypto indices in this analysis as usual I want to review the New York futures session triggers for you
🫶 Before starting the analysis I want to thank you for all the support you have given us along the way so that we could reach the 50th analysis I hope that the number of these analyses increases much more and that we are always with you and that you also benefit from the analyses❤️
⏳ 1-hour timeframe
Yesterday Bitcoin rose from the 82302 zone and moved upward finally forming a base after the sharp and deep decline it had and even managed to go above the 83808 zone
⚡️ I slightly adjusted this zone and moved it to 83510 because the price reacted better to this zone
💫 Currently, we are witnessing a rejection from the 84486 zone which has pushed the price back towards 83510 if selling volume increases the price may drop further
✔️ If the price goes below the 83510 zone again in lower timeframes and with the activation of the fake breakout trigger we can open a short-term short position the main trigger is in the 82302 zone
🔼 For a long position breaking 84486 is suitable and with this breakout, the price can start the next bullish leg the entry of RSI into Overbuy will also be a momentum confirmation and can cause us to see large bullish candles
👑 BTC.D Analysis
Moving on to Bitcoin dominance today dominance faced a rejection from 62.35 which could cause dominance to decline
💥 The trigger for confirming this rejection and the downtrend is in the 62.06 zone and breaking this zone could move the price towards the 61.81 and 61.63 zones
📈 Stabilization of dominance above 62.35 will also confirm the uptrend again
📅 Total2 Analysis
Moving on to the Total2 analysis yesterday the 1.01 trigger was activated and the price has also pulled back to it but today we have a trigger for both long and short positions
🔽 For a short position breaking 990 and for a long position breaking 1.02 can confirm opening positions on altcoins
📅 USDT.D Analysis
Moving on to USDT dominance a Head and Shoulders pattern has formed where the neckline in the 5.41 zone has also been broken and the price is pulling back to it
📉 If the price is rejected from the 5.41 zone we will confirm the activation of this pattern and with the break of 5.33 we can confirm the downtrend of dominance
⭐ For an uptrend in dominance breaking 5.41 and invalidating the pattern can be a suitable trigger
❌ Disclaimer ❌
Trading futures is highly risky and dangerous. If you're not an expert, these triggers may not be suitable for you. You should first learn risk and capital management. You can also use the educational content from this channel.
Finally, these triggers reflect my personal opinions on price action, and the market may move completely against this analysis. So, do your own research before opening any position.

TradeCityPro | Bitcoin Daily Analysis #49👋 Welcome to TradeCity Pro!
Let's dive into the analysis of Bitcoin and key crypto indices. As usual, I will review the futures session triggers for the New York market.
⌛️ 1-Hour Timeframe
In the 1-hour timeframe, as you can see, the downtrend continues, and yesterday the price dropped below 82,302, now reaching 81,520.
📊 Selling volume has increased in the market, and the SMA 25 has been tracking the price movement effectively in this cycle. Currently, as the price pulls back to 82,302, it is also testing the SMA 25, placing it in a critical zone.
🔽 For a short position, considering this pullback to the SMA 25, you can enter a trade if 81,520 breaks. The next support level in case of a further decline is 80,105.
📈 For a long position, we still need to wait for a proper trend reversal structure to form. There is no valid trigger for a long entry at this moment.
👑 BTC.D Analysis
Now, let’s analyze Bitcoin dominance. Yesterday, the ascending trendline was broken, but the trigger at 62.06 was not activated, leading to a bullish move instead.
⚡️ Currently, 62.30 has broken, and if this breakout holds, dominance could rise to 62.66.
💥 However, if the 62.30 breakout turns out to be a fakeout, a break below 62.06 would confirm a bearish trend reversal.
📅 Total2 Analysis
Moving on to Total2, yesterday the 0.984 support broke, but it now appears to be a fakeout, as the price is stabilizing back above this level.
💫 For a short position, confirmation will come if the price closes below 0.984. If that happens, the next downside target would be 0.953.
🔼 For a long position, a break above 1.01 would confirm the trend reversal, given the fakeout at 0.984.
📅 USDT.D Analysis
Now, let’s analyze USDT dominance. A range has formed between 5.41 and 5.56, and dominance has rejected from 5.41, now moving downward again.
✔️ If 5.41 breaks, it would be the first confirmation of a trend change.
✨ For a bullish continuation, a break above 5.56 would confirm the next bullish leg.
❌ Disclaimer ❌
Trading futures is highly risky and dangerous. If you're not an expert, these triggers may not be suitable for you. You should first learn risk and capital management. You can also use the educational content from this channel.
Finally, these triggers reflect my personal opinions on price action, and the market may move completely against this analysis. So, do your own research before opening any position.