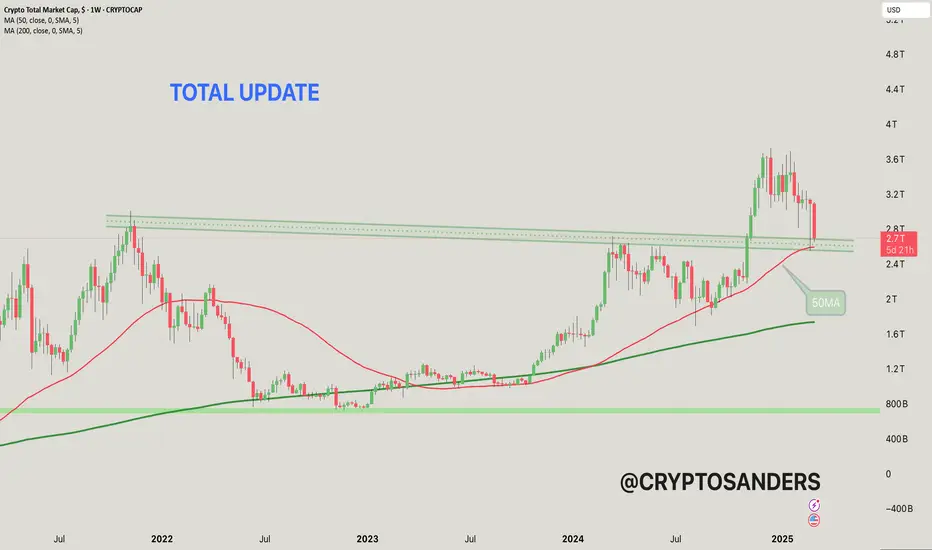
This chart shows the total cryptocurrency market capitalization,
The current value is around $2.271 trillion, which represents a significant drop of 12.51% from the recent peak.
50-MA (moving average): The red line represents the 50-week moving average, which is currently around $2.59 trillion. It acts as a short-term trend indicator and potential support level.
200-MA: The green line represents the 200-week moving average, which is around $1.73 trillion, which indicates a long-term trend and strong support level.
The horizontal green lines represent support levels around $2.4 trillion and $2.6 trillion. These levels are important for a potential bullish reversal if retested.
The dotted line above the price represents resistance levels near historical highs.
The recent decline suggests the market may be in a bearish trend after failing to break the resistance levels.
If the price is above the 50-MA, it could signal a reversal towards the resistance zones and a potential recovery. However, a break below the 50-MA could signal further decline. Keep an eye on the key levels around $2.4 trillion (support) and $2.6 trillion (resistance).
If you found this analysis helpful, hit the Like button and share your thoughts or questions in the comments below. Your feedback matters!
Thanks for your support!
DYOR. NFA
Total2usd
TOTAL2 2 scenariosTOTAL2 2 scenarios im looking at. Purple arrow means bullish for alts. If we go down to green arrow it means we get a pullback

Total 2 Altcoin Marketcap Total 2 AltCoin ~ 1W
#Altcoin Season Super Cycle will start after this resistance block is successfully penetrated. you will see a super cycle increase in AltCoin.

ALTS Market Cap Chart AnalysisThe ALTS market cap has broken out of a descending broadening wedge, triggering a strong bullish rally. However, it is facing resistance at a key horizontal supply zone.
The Ichimoku Cloud shows strong bullish momentum, indicating the possibility of a continued upward move. A decisive breakout above this resistance level could trigger a significant rally, further strengthening the upward trajectory of the ALTS market.
For updates on other coins or personalized insights, feel free to reach out to DM.
@Peter_CSAdmin

ALTCOINS total2 update; zoomed in short term pivotALTCOINS total2 update; zoomed in short term pivot
Care with leverage here / stops
looks dubious.
cmon bulls show us your balls.

Provides analysis of cryptocurrency market cap (CRYPTOCAP)The red line shows the 50-week moving average, which appears to be a crucial support level for the overall trend. Historically, the market cap has respected this moving average, with upward momentum when trading above it.
This area acts as a strong support level, as it has historically provided a solid foundation for price recovery. The total market cap has rebounded from this level several times, indicating buyer interest.
This is a crucial resistance level, as the market has reversed from this area before. If the total market cap approaches this area, selling pressure may occur.
The white diagonal line shows a long-term ascending trendline, suggesting a steady upward trend since 2018. This line further strengthens the overall bullish trend, as long as the total market cap stays above it.
Currently, the total market capitalization is testing the 2.728T level, which is close to recent highs, with a possible bounce if it breaks above the red resistance zone.
The overall outlook appears to be bullish, but it is essential to keep an eye on any significant moves around the resistance zone and the 50MA, as these will influence the long-term trend.
Disclaimer: This analysis is for informational purposes and is not financial advice. Always stay updated with market movements and adjust your trading strategies as needed.
You can DM us for information on any other coin.
@Peter_CSAdmin

#ALTSEASON is Coming! Don't Fall for the TRAP!I'll keep it brief—it’s all in the chart. TOTAL2 is simply retesting after breaking above the 50-weekly EMA, a historically strong signal for timing altseasons. The falling wedge pattern should break in the coming weeks with an impulsive move.
Current price action seems like a shakeout, pushing out weak hands right before the major rally everyone’s been waiting for.
This is not financial advice—DYOR—but IMHO, this is the worst time to give up. Being out of the market is riskier than holding, no matter how down your altcoin bags are.
Cheers!
Hit the like button If you like it, I'll be sharing more altcoin charts soon. Stay tuned!
#PEACE

ALTCOIN MARKET UPDATEALTCOIN MARKET UPDATE
this is the bullish option obviously. that long term momentum looks,,, well placed. nicely shaped.
zoom in for various fractals; will be tracking them to see which one fits best but they share quite a few key targets.
that is if the bull is in control here.. pretty convinced.. guess it depends on the US election, ukraine etc
gl

TOTAL2 bullish#TOTAL2 chart (top 125 #altcoins) bouncing on daily EMA200 support level... I expect no big corrections on Alts anymore, a few percent at most...
It's a good moment to start DCA, and prepare your portfolio before Q3...

Worried about holding Alts? Remember this chart!
The Alt market cap is currently showing strong support around the $1.112T mark. After a decisive breakout from the descending channel, we are now seeing a period of consolidation. This suggests a potential for further upside if support holds.
📈 Key Observations:
- Breakout from the descending channel indicates a bullish trend reversal.
- Support around $1.112T is crucial; maintaining above this level could lead to further gains.
- Watch the weekly close for confirmation of this trend.
Stay vigilant
Do hit the like button.
Thank you
#PEACE

TOTAL2 - Monthly Strong Bull Phase BeginsIn each circle the alligator indicator can be seen to be stretched out or "open"
When in a state like this bull action is most common
This is the Monthly timeframe so patience is required for big gains, regardless we will be seeing more green days than red.
BULLISH

Total 2- 2020 - 2021 Bull RunDid you find this crypto market analysis helpful? Stay updated about the latest crypto market update. Please continue to follow my analysis and feel free to ask any queries, you may have. I am here to assist you. TradingView: @frmnCapital

TOTAL2 update; ends sooner than you thinkTOTAL2 update; ends sooner than you think
now some months have passed we can see reasonably clearly where we are at since the last analysis right at the start of the macro move up.
obviously black swan etc can ruin this or it just does it differently this time. prob not though tbh and if there is a black swan id bet its around those dates. the events tend to fit the chart for some odd reason not the other way around.
leaning towards the early version. im seeing mid april on a lot of other fractals. basically double tops or just slightly higher last highs then splat.
or it just keeps marching up and up and we all get raris and citadels.
im good with either.
lfg
gl

ALTCOINS recovery is around the cornerHi traders
Altcoins are dimping way more than Bitcoin therefore let's have a look at TOTAL2.
TOTAL2 is in a downtrend but when we zoom out , we can see that in fact , it's just a consolidation inside the channel and long process of building the market structure.
It looks like we can see another crash (20 -25 %) in the altcoins market overall. Some altcoins will dump 20 % from current levels and some altcoins will go down probably even more, but it doesn't look like a market cycle phase when you want to short crypto s coins forever .
Chart shows opposity. We are in an accumulation phase on altcoins and dips are for buying.
In my opinion the problem is with increasing number of altcoins that exist .
As we analyze the Total2 (all altcoins' market cap) , but there are continually new coins coming to the market, it will be impossible for some altcoins to recover fully (and history shows that only few altcoins recover fully and make new all time highs), therefore it's recommended to choose altcoins wisely.
Anyway, once the accumulation phase is finished, we will see a mark-up phase where we would target 0.618 fib level (1,20T).
When it's gonna happen? Probably not in 2023. Patience is a key.
Long story short:
* If you wanna short, do so. But keep in mind that downside is limited
* DCAing into altcoins once (and if) we get the next altcoins crash may be a profitable strategy if you play it with a long-term horizon.
* Choose your altcoins wisely
* Be patient. Buy low, hold and sell high (0.618 fib leve)
What do you think?
Share your opinion!
Good luck

CONSERVATIVE ALTCOIN MARKET CAP PREDICTION WITH DATESThis is my conservative Total2 (no BTC included) altcoin market cap prediction for a minimum all-time high.
Following the past trend, we can expect a high around ~$2.9 trillion . This is +156% from our current price and only a +75% increase from the all-time high prior to the last high in 2021. The expected date is an estimate taken from the number of days from the 2nd last ATH to the last ATH.
The data is only a single set and should not be taken as fact in the slightest. However, if we use it as an estimate, we will reach a new ATH on October 27, 2025 , which is 609 calendar days from today.
This is a strictly TA breakdown of the Total2 market cap. With full transparency, I think it is realistic that we will see a greater move than this. We may see this trend line only as resistance before breaking even further above $2.9T. I have no time estimate for this.
Everyone knows we now have Bitcoin institutionally adopted. ETFs have exceeded inflow expectations and could lead to greater ATH's than predicted, which could be an indicator for the same moves for altcoins.

TOTAL MARKET CAP: HISTORICAL CYCLES!People are talking a lot about altcoins in the cryptocurrency market. They think there might be a big season coming up where altcoins, which are alternative cryptocurrencies to Bitcoin, could be worth a total of $5 trillion by 2025. This idea comes from looking at past data and patterns in the market.
Historical
Let's look at some past data:
It took about 762 days for the total cryptocurrency market value to be higher than it ever was before.
If things happen like they did before, we might see a new high around December 2024.
The last time prices went really high lasted for about 1066 days, and this time it could be similar.
Fractal Analysis:
This is a fancy term, but it just means looking for similar patterns in the past:
Between 2014 and 2015, prices stayed pretty steady for about 610 days.
Then, from 2016 to 2017, the value of altcoins shot up to around $400 billion.
After that, from 2018 to 2019, there was another period of steady prices for about 609 days.
Now, from 2022 to 2023, we've seen about 548 days of steady prices, which might mean a big change is coming.
Future Projections:
Based on what we've seen before, here's what some people think could happen:
They're guessing that altcoins could be worth $5 trillion by 2025, which would be a huge jump.
They think this might happen around September or October 2025.
Conclusion:
Looking at all this information, it seems like altcoins could be in for a good run in the next few years. If they really do reach $5 trillion by 2025, there could be some big opportunities for investors. It's something worth keeping an eye on as things develop in the cryptocurrency world.

TOTAL2 ScenariosLooks like there are 2 scenarios currently. The third one is breaking down, which woudl be a huge surprise. Low probability even tho the pattern usually breaks to the downside.

TOTAL 2 Cycles SynchronizationHere is the Cycles Synchronization of Crypto Total Market Cap Excluding BTC (TOTAL 2). At some point, between mid november and mid december 2025, I do expect around 3.5T Market Cap to be the top for the cycle. 1 year later, the Market Cap could be at around 1.5T, I think.
Will follow with interes...

#ALTCOINS are about to surge higher than your expectation!#TOTAL2 : Altcoin market cap retraced to the local trendline support we plotted a few hours back. Continuation is highly likely from here.
Now isn't the time to be scared of the dip; these are opportunistic moments.
My plan: I don't want to buy in aggressively right now. Instead, I'll ladder in partially in case we hit the lower support of $630 billion.
#CryptoNews 📈

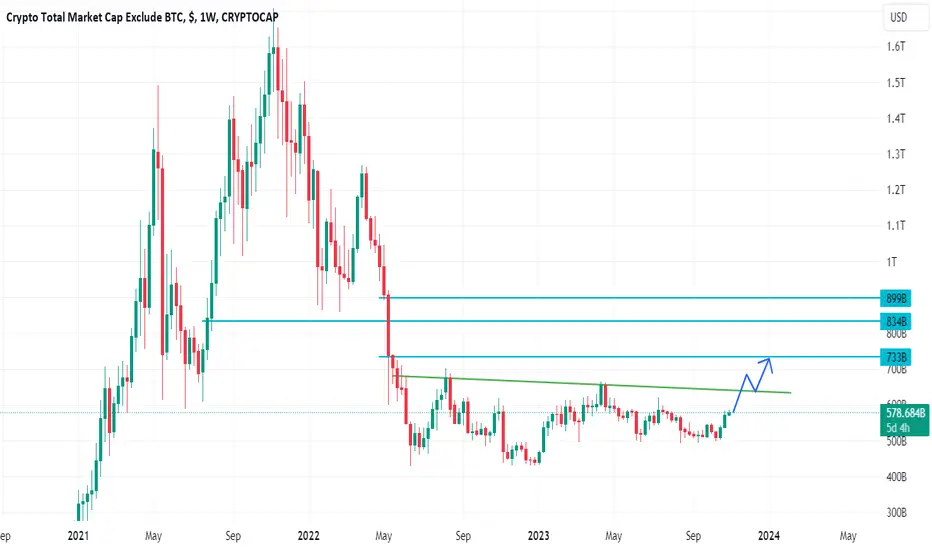
TOTAL2TOTAL2
TOTAL2 is the total market capitalization of cryptocurrencies, excluding the total capitalization of BTC.
On the chart, after a long accumulation since May 2022, we see the first glimpses of growth. 2 week green candles.
For further growth, we need to break through the green resistance and gain a foothold above it. After this we will be able to take the following targets: 733 - 834 - 899
If this happens, then we will see how all the alts will start shooting. In case of updates, we will definitely inform you.
Don't forget to show your support by like(rocket) and comment✅
TOTAL2 is About to Explode!The crypto market is abuzz with a significant phenomenon - the shrinking of the total market capitalization, excluding Bitcoin (BTC). Contrary to what one might expect, this contraction often precedes a major pump in the world of cryptocurrencies, signifying the potential for exciting price movements. 🌌💥
Unpacking the Market Cap Contraction
Market cap contraction is a fascinating occurrence, one that hints at the complex dynamics of the cryptocurrency market. When we talk about the total market capitalization excluding Bitcoin, we're essentially looking at the collective value of all cryptocurrencies other than the big BTC.
The Compression Effect: A Precursor to a Pump
Why does contraction matter? It's because, in crypto, this phenomenon frequently acts as a precursor to a "pump," a substantial increase in prices. When the total market capitalization of altcoins starts to shrink within a defined range, it often indicates that the market is preparing for a major move.
Anticipating the Upward Surge
For crypto traders and enthusiasts, keeping an eye on this contraction is vital. It suggests that exciting price surges could be on the horizon for the world of altcoins. Such periods of compression often lead to increased trading activity, resulting in significant price movements.
Trading Strategy: Positioning for the Pump
As this exciting market cap contraction unfolds, cryptocurrency traders should consider crafting trading strategies to harness the potential pump. The market dynamics may offer numerous opportunities to capitalize on these upcoming price surges.
Conclusion: Crypto's Dynamic Landscape
Understanding the nuances of the crypto market is crucial, and the market cap contraction phenomenon is one of its fascinating aspects. As we navigate this period of compression, let's remain vigilant, prepared, and ready to embrace the opportunities that a potential pump can bring.
🚀 Crypto Insights | 💡 Trading Strategies | 💰 Market Analysis
❗See related ideas below❗
Share your thoughts and insights 💚🌐💚

#altcoins will have a blood bath?Here' s the #altcoin #totalmarketcap incl. #ethereum . This chart shows , altcoins' market cap have come to the top of the channel. Declination here is will doom altcoin bag holders. Clear breaking channel with volume and weekly closings is the invalidation. I showed the support levels on the chart. The war is not good for markets, a friendly reminder. Always use stop losses. I don' t say buy or sell , always train yourself and this is NOT FINANCIAL ADVICE.

Structural Similarities - TOTAL2The formation we are seeing now which is a potential bottom is similar in my eyes to what was seen before the massive moonshot on total2 post 2016
will there be a follow up run?
I am very bullish right now on TOTAL2 and cryptocurrency.
