Total 3 Crypto Market CapOur opinion on the market cap of alt-coins:
Currently we are not seeing big volume in the crypto space, there are selective coins making higher highs but majority of the market is down in general.
On balance of probabilities, the total market should drop by 75% to regain the energy and interest required to start a new price discovery mode.
Our bias is short for the reasons given above, and we are working on trading plans to execute when time arrives.
Total3

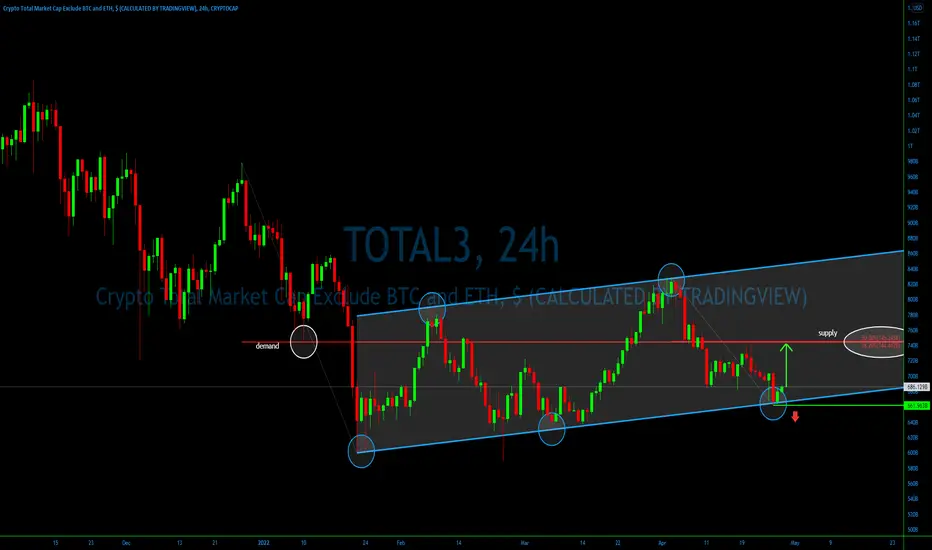
Altcoins bottomed or expect another drop❓💎Today we will look at the TOTAL3 price action. TOTAL3 is a crypto market cap excluding the Bitcoin and Ethereum capitalization, which is providing the perspective for the Altcoin potential.
💎Back on February 24, TOTAL3 formed a double bottom at 600B, which is strong psychological support. Since then we can observe the price action within the ascending channel. Yesterday TOTAL3 tested and bounced off the bottom of the channel.
💎The low has been printed at 661B, and this might be critical .......
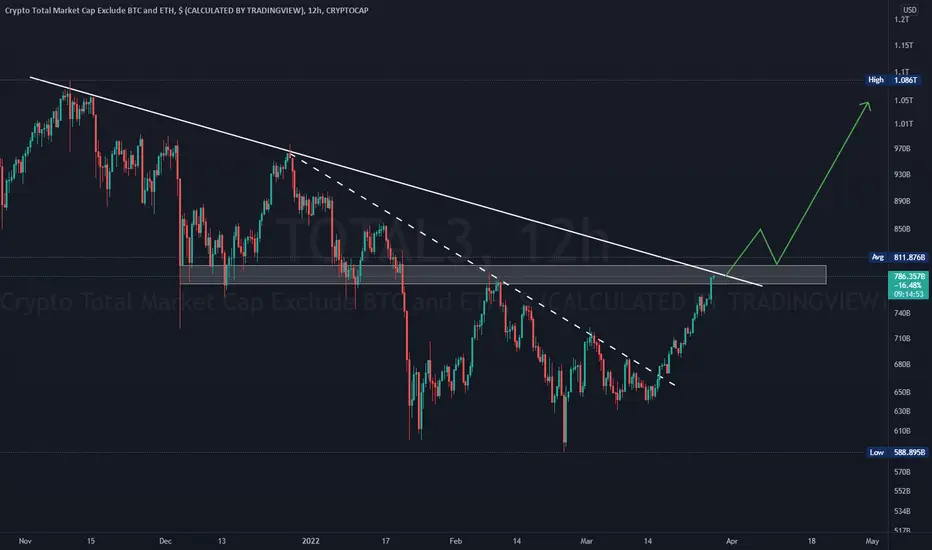
TOTAL MARKET CAP 12 HOURS UPDATE Hi guys, This is CryptoMojo, One of the most active trading view authors and fastest-growing communities.
Do consider following me for the latest updates and Long /Short calls on almost every exchange.
I post short mid and long-term trade setups too.
Let’s get to the chart!
I have tried my best to bring the best possible outcome.
TOTAL 2 UPDATES:
total 2 is making this big ascending channel pattern, currently, it is making this falling wedge pattern inside the channel.
we bounced from the lower support of this channel but we need to break out this falling wedge pattern let's see how it goes.
RSI is showing some bullish divergence move.
if it breaks the lower support of this channel then the chart will be invalided
This chart is likely to help you in making better trade decisions if it did consider upvoting this chart.
Would also love to know your charts and views in the comment section.
Thank you

TOTAL.3-4HAs you can see, there is a double bottom pattern is forming, 730B neckline must be broken and price must hang above it by closing 4H candles.
But I'm still not convinced that this is the rally that will take us to 50k, BTC is so weak and fragile. Still, I will trade it if neckline breaks.
NFA, DYOR.

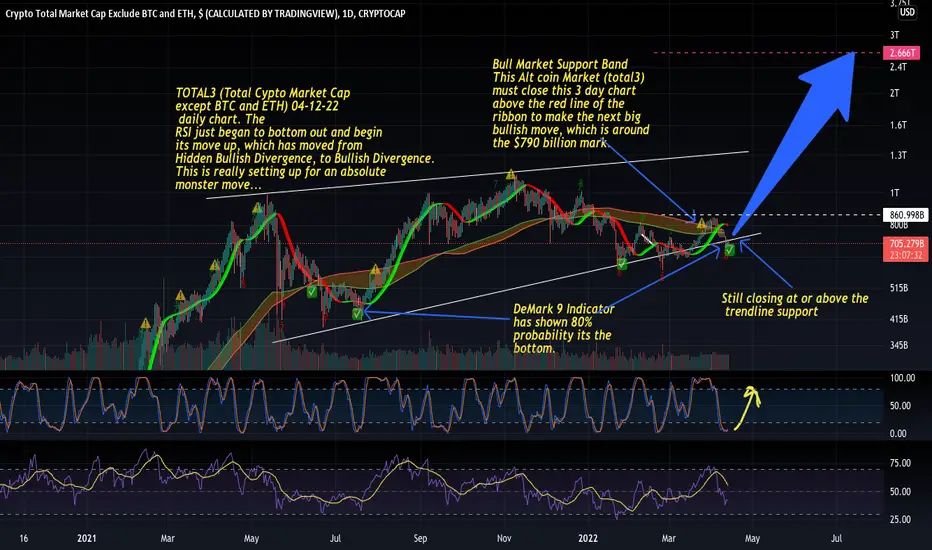
TOTAL3 daily remains at the bottom of the trendline but?TOTAL3 (Total Cypto Market Cap
except BTC and ETH) 04-12-22
daily chart. The
RSI just began to bottom out and begin
its move up, which has moved from
Hidden Bullish Divergence, to Bullish Divergence.
This is really setting up for an absolute
monster move...
TOTAL MARKET CAP 3 DAYS UPDATE Hi guys, This is CryptoMojo, One of the most active trading view authors and fastest-growing communities.
Do consider following me for the latest updates and Long /Short calls on almost every exchange.
I post short mid and long-term trade setups too.
Let’s get to the chart!
I have tried my best to bring the best possible outcome in this chart, Do not consider it as FINANCIAL ADVICE.
TOTAL UPDATE
TOTAL MCAP has reached its important support range.
We might see a few % down from here but eventually, a bounce is inevitable.
Also, most of my alt positions have been stopped with decent losses and a few with major losses.
I'll take those as a lesson.
Not rushing to get into any positions.
So basically we need to look into three assets and indexes here, BTC USDT.D and TOTAL
Better to wait for that green candle.
Let's see how the daily candle closes.
This chart is likely to help you in making better trade decisions if it did consider upvoting this chart.
Would also love to know your charts and views in the comment section.
Thank you

total 3 3 day chart is ready to explodeTOTAL3 (Total Cypto Market Cap
except BTC and ETH) 04-07-22
3 day chart. The
RSI just began to bottom out and begin
its move up, which has moved from
Hidden Bullish Divergence, to Bullish Divergence.
This is really setting up for an absolute
monster move...

TOTALThe overall market index is resisting the Moving 200 and Fibo 0.5. After its failure, we will see more market growth.

TOTALThe overall market index is resisting the Moving 200 and Fibo 0.5. After its failure, we will see more market growth.

TOTAL MARKET CAP TO REACH $4-5 TRILLION BEFORE JAN 2023!?- As we can see a similar pattern seems to be forming with the total market cap.
- As long as we break out of the YELLOW RESISTANCE LINE we could see the market continue higher!

TOTAL | H16 | Technical AnalysisHello everyone! Due to the intensity of the work, I was absent for a long time, but I came back again...
I studied the Crypto Total chart long term. And most likely, I predicted that the price would go up to the 2,750T level again.
This forecast will most likely come true by July.
Stay tuned!

TOTAL3 is getting even more bullish!TOTAL3 (Total Cypto Market Cap
except BTC and ETH) 03-28-22
3 day chart. The
RSI just began to bottom out and begin
its move up, which has moved from
Hidden Bullish Divergence, to Bullish Divergence.
This is really setting up for an absolute
monster move...

#Altcoin MarketCap TOTAL3 after breaking the small daily trendline now its ready to break above the massive trendline.
Expecting another wave to start after this breakout!
ALTSEASON confirmed by this unique pattern.This is the TOTAL3 index which displays the Total Crypto Market Capitalization excluding Bitcoin and Ethereum. The time-frame I chose is the 2W as on this, a very unique indicator (MFI/ MA) shows a pattern that should not be ignored.
As you see, this month, the indicator formed a Bullish Cross, similar to those of April 2020 and February 2019. The common characteristic of those two past crosses, was that they confirmed the past two Altcoin Seasons (Altseasons). The whole pattern is virtually identical with 2020, even with the 2018 (for as far as data are provided).
In each case, the Altseason ended with the indicator's Bearish Cross. In our view, a new Altseason has just started and we can hold until the very first sign of a confirmed Bearish Cross.
--------------------------------------------------------------------------------------------------------
** Please support this idea with your likes and comments, it is the best way to keep it relevant and support me. **
--------------------------------------------------------------------------------------------------------

Total 3 looking boollish 3 solid bounces on the up trendline (A)? yes
Broke out the down trendline (C) and standing above an important support (B)--Seems a valid breakout to me
RSI and MACD looking good
1st target: 986B
2nd target: 1.2T
--A newbie. Just making all these for my own record, very welcome to correct or educate me tho--

TOTAL 3 STILL INTACT AND LOOKING GREATTOTAL3 (Total Cypto Market Cap
except BTC and ETH) 03-19-22
3 day chart. The
RSI just began to bottom out and begin
its move up, which has moved from
Hidden Bullish Divergence, to Bullish Divergence.
This is really setting up for an absolute
monster move...Also the 3 day is continuing to close at or above the trendline support.

Total Crypto Market cap ~So I'm starting to completely entertain the idea of the entire crypto ecosystem imploding on itself from around the current levels.
I don't know what is going to be the worldly cause of this, but I got this intuitive feeling that I really cannot ignore.
If I'm right about this, alts will take one of the biggest hits since December 4th 2021.
----
I could also very well be wrong about this, so take my words with a total grain of salt.

$TOTAL3 ALTCOINS MINUS $ETH$TOTAL3 price action is shaping up to have two equally valid paths from here. On one end I can see a rejection of the red trendline to jump start a bearish nuke down to the $520 Billion level with a couple bearish retest in the middle. On the other hand price can break above the red trend line and retest indicating possible start of new money inflow into the space. I will be watching closely in the coming days on the reaction near the red trend line, which stems from the charts all time high. A crucial swing is upon the market IMO.

TOTAL3 is getting even more bullish!TOTAL3 (Total Cypto Market Cap
except BTC and ETH) 03-12-22
3 day chart. The
RSI just began to bottom out and begin
its move up, which has moved from
Hidden Bullish Divergence, to Bullish Divergence.
This is really setting up for an absolute
monster move...

Bitcoin Daily Analysis Update🟢🟢#BTC on daily TF looks messy as it more looks like the price is ranging more. Currently, the price faces strong physiological resistance at 40,000$ and holds the 39,000$ area as support. If the daily candle closes above 40000$ then Expect a strong breakout this weekend. It is so important to keep 36800$ Support By next week we can see some clear direction in it. Use proper stop in all your trades.
⚠ This Analysis will be updated.
✍ Analyzed by AmirHossein.
📆0.3.12.2022

TOTAL 3 in Inverse Head & ShouldersTOTAL 3 has created an inverse head & shoulders on the 4hr and below timeframes. On the 1hr and 15 min timeframes TOTAL 3 has created smaller inverse h&s and seems to be building up momentum for a larger move to the upside. AltCoins should have a rally coming up

Money pouring into the market, Altseason Coming?Money pouring into the market, Altseason Coming?
Green = Target
Red = Support
Cheers,
MRHPx/CRACKadabra

TOTAL3 continues its path to the upside.TOTAL3 (Total Cypto Market Cap
except BTC and ETH) 02-28-22
3 day chart
is reading Hidden Bullish Divergence.
which means the price has a higher low,
and the RSI has a lower low.
