Total #002 ( Look at the Future !!! )Hello dear traders.
Good days.
First of all thanks for your comment and support.
---------------------------------------------------
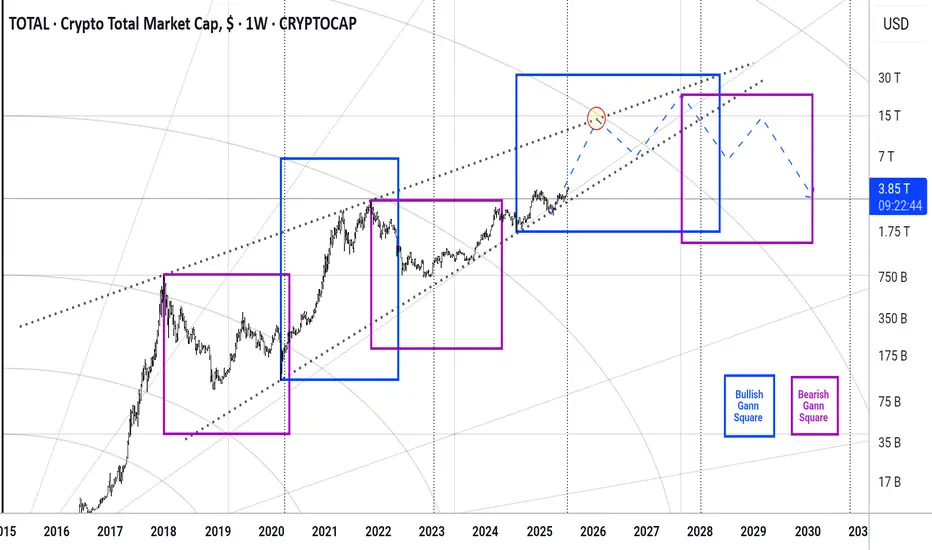
In beautiful rising wedge of total market cap , the total market in this month broken 0.5 monthly Gann Square price level which means will be ready for test and retest 0.618 for final round befor market collapse.
With refer to the daily Bullish Gann Square ( Blue Square ) and Bearish Gann Square it is expected to within a year market will grow fast .
Safe trades and good luck.
Totalcap
Crypto Total Market Cap (CRYPTOCAP:TOTAL) As of March 12, 2025, the Total Crypto Market Cap sits at 2.63T USD.
Let’s dive into the monthly chart for a technical breakdown:
Since 2016, price has been moving within a long-term ascending channel. Right now, we’re testing the lower trendline support zone (2.4T - 2.5T).
This level has historically acted as a strong base – both the 2017 and 2021 bull runs kicked off from similar support zones.
Volume profile shows a 15-20% increase over the past 3 months, indicating growing buyer interest and improving market liquidity.
RSI is at 40 (neutral zone), not yet in oversold territory but signaling a potential base for a recovery.
Bullish Scenario: If the 2.5T support holds, we could see a move toward the channel’s midline (3T - 3.5T range), potentially retesting the 2021 highs above 3T.
Bearish Risk: A break below 2.5T could lead to a deeper pullback toward 2T, so keep this level on your radar.
💡 My Take: I believe we’re either at the bottom or just a few weeks away from the start of a new uptrend. April could mark the beginning of a bull run, signaling the end of the bloodbath – at least based on the technicals of the Total Market Cap.
What’s your view? Will the 2.5T support hold, or are we in for another correction?

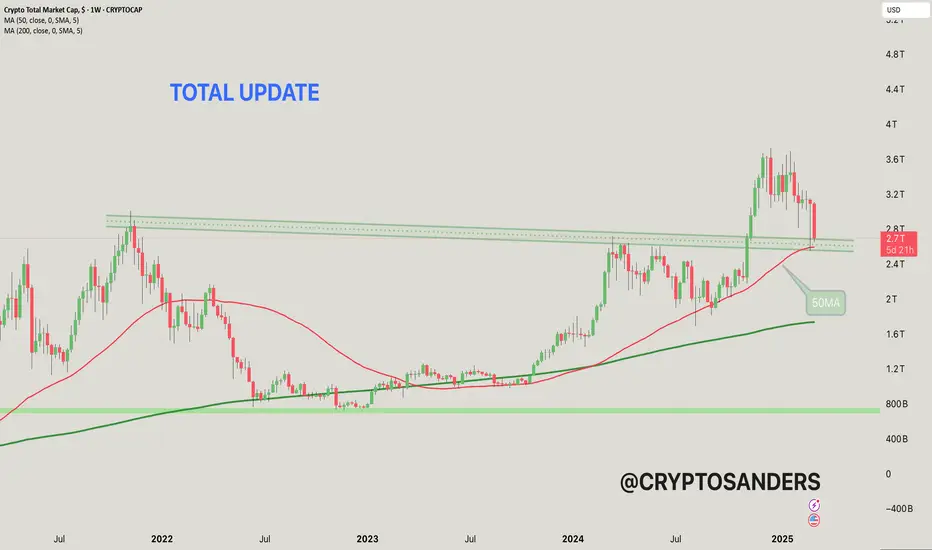
This chart shows the total cryptocurrency market capitalization,
The current value is around $2.271 trillion, which represents a significant drop of 12.51% from the recent peak.
50-MA (moving average): The red line represents the 50-week moving average, which is currently around $2.59 trillion. It acts as a short-term trend indicator and potential support level.
200-MA: The green line represents the 200-week moving average, which is around $1.73 trillion, which indicates a long-term trend and strong support level.
The horizontal green lines represent support levels around $2.4 trillion and $2.6 trillion. These levels are important for a potential bullish reversal if retested.
The dotted line above the price represents resistance levels near historical highs.
The recent decline suggests the market may be in a bearish trend after failing to break the resistance levels.
If the price is above the 50-MA, it could signal a reversal towards the resistance zones and a potential recovery. However, a break below the 50-MA could signal further decline. Keep an eye on the key levels around $2.4 trillion (support) and $2.6 trillion (resistance).
If you found this analysis helpful, hit the Like button and share your thoughts or questions in the comments below. Your feedback matters!
Thanks for your support!
DYOR. NFA
TOTAL ideaThese are the key area im looking at for TOTAL during this bullrun. If I change my mind I will update below this post.

ALTS Market Cap Chart AnalysisThe ALTS market cap has broken out of a descending broadening wedge, triggering a strong bullish rally. However, it is facing resistance at a key horizontal supply zone.
The Ichimoku Cloud shows strong bullish momentum, indicating the possibility of a continued upward move. A decisive breakout above this resistance level could trigger a significant rally, further strengthening the upward trajectory of the ALTS market.
For updates on other coins or personalized insights, feel free to reach out to DM.
@Peter_CSAdmin

Provides analysis of cryptocurrency market cap (CRYPTOCAP)The red line shows the 50-week moving average, which appears to be a crucial support level for the overall trend. Historically, the market cap has respected this moving average, with upward momentum when trading above it.
This area acts as a strong support level, as it has historically provided a solid foundation for price recovery. The total market cap has rebounded from this level several times, indicating buyer interest.
This is a crucial resistance level, as the market has reversed from this area before. If the total market cap approaches this area, selling pressure may occur.
The white diagonal line shows a long-term ascending trendline, suggesting a steady upward trend since 2018. This line further strengthens the overall bullish trend, as long as the total market cap stays above it.
Currently, the total market capitalization is testing the 2.728T level, which is close to recent highs, with a possible bounce if it breaks above the red resistance zone.
The overall outlook appears to be bullish, but it is essential to keep an eye on any significant moves around the resistance zone and the 50MA, as these will influence the long-term trend.
Disclaimer: This analysis is for informational purposes and is not financial advice. Always stay updated with market movements and adjust your trading strategies as needed.
You can DM us for information on any other coin.
@Peter_CSAdmin

TOTAL3TOTAL3 ~ 1W ✅
If you want to see when is the right time for AltCoin to rise parabolically,. You need to pay attention to this chart.
A breakout of this descending pattern will allow Altcoins to rise massively.

Chart Idea - TOTALWaiting for this inverse head n shoulder to playout. In order for BTC to move further up and liquidate more shorts, TOTAL needs to break the neck line of this inverse head n shoulder pattern. We will see BTC going down again if it gets rejected from here. Will keep on updating here.

TOTAL # 001 ( Last PUSH UPWARD before Market COLLAPSE !!! ) Hello dear traders.
Good days.
On monthly Gann Square, Total market didn’t grow more than 0.25 of Monthly Gann Box level price and it can try to test at least 0.5 Monthly Gann Box Fib level which will be 2.55 T $ .
It can grow beyond to test 0.618 @ 2.91 T $ Or even try to reach itself to 0.75 Gann Box Fib Level which will be about 3.4 T$ .
Weekly and Monthly Gann Square Can match each other to reach to the mentioned Targets and Finally proceed to Hug Bearish Correction at the end of Monthly Or Weekly Gann Square which is depended .
Chart is plotted with help of Gann Square and Gann Box.
Good luck and safe trades.
Thanks for your support and comments.

TOTAL 2After encountering resistance from previous highs, the price is now retracing towards the horizontal support level.

USDT.D 4HHi Guys Hope you well
I show you the analysis for USDT.D ,completely against the trend of bitcoin.
SecondChanceCrypto
⏰04/May/23
⛔️(DYOR)
always do your research.
If you have any questions, you can write them in the comments below, and I will answer them.
And please don't forget to support this idea with your likes and comment

Crypto market cap $ Money flow💰. TOTAL CRYPROCAP 📈📉updateHello guys. This is an update of previous analysis (blow link), The chart is very similar to Bitcoin now. The market broken its strong resistance zone in 1.16-1.18T, which is a sign of money flow. So after a retest of this area and fixation, we will see the continuation of the upward trend and the entry of money to the crypto market to 1.5T. Consider it and monitor the price's action in the circles.
Good luck.
If you like the idea, do not forget to support with a like and follow me for next analysis :)
Write your comment and opinion here to me
.
Salam doostan aziz, yek update az tahlile gozashte (linke zir) hast, hame chiz rooye chart moshakhas shode. market nahiye moghavemati ghavi khodesh ro shekaste dar 1.16-1.18 T, ke in neshane voroode pool be bazar hast. pas baad az yek retest ya pullback be in nahiye va tasbit balaye an, ma shahede edame harkate so'oodi va voroode pool bishtar be bazar khahim bood be target 1.5T. ino darnazar begirid va raftar bazar dar dayere haro rasad konid.
moafagh bashid.
like va follow faramoosh nashe :)

What's up about crypto market cap💰. TOTAL CRYPROCAP 📈📉Hello guys. This is an update of previous analysis (blow link), The chart is very similar to Bitcoin now. After breakout the trend line , I expected some correction as a pullback and complete the pattern then continuation of upward but this has not happened yet and the market needs that ,Consider it and monitor the price's action in the circles.
Good luck.
If you like the idea, do not forget to support with a like and follow me for next analysis :)
Write your comment and opinion here to me

TOTAL Crypto Market Cap DAILYThe TOTAL PA is sliding down the Support nicely while the MACD cools off. Its not ready to turn just yet so we may remain like this till Weekend.
The Long wicks show the battles going on right now and you can see how the 50 MA ( Red) acted as support yesterday.
There is little doubt the Bears are trying hard to drop the price but the Bulls are holding on
Support should hold despite the FUD and attempted destablising by the IMF nd SEC, which are all representatives of the traditional Banking industry
No surprises there then

What's up about crypto market cap💰. TOTAL CRYPROCAP 📈📉Hello guys. This is an update of previous analysis (blow link), The chart is very similar to Bitcoin now. After breakout the trend line, I expect some correction as a pullback and complete the pattern then continuation of upward ,Consider it and monitor the price's action in the circles.
Good luck.
If you like the idea, do not forget to support with a like and follow me for next analysis :)
Write your comment and opinion here to me

#TOTAL MARKET CAP IMPORTANT UPDATE MUST READ!!Hi guys, This is CryptoMojo, One of the most active trading view authors and fastest-growing communities.
Consider following me for the latest updates and Long /Short calls on almost every exchange.
I post short mid and long-term trade setups too.
Let’s get to the chart!
I have tried my best to bring the best possible outcome to this chart, Do not consider financial advice.
TOTAL MARKET CAP UPDATE
As you can see in the chart or absorb in the chart here TOTAK MARKET CAP is making this falling wedge pattern as same it marked in 2018 and dropped 43% and invalided this pattern that was the last drop of the bull market.
Technically as we all know that this is a bullish pattern if this pattern breaks up out and test successfully then we can accept a bounce technically but if it Breaks down 700 billion support then it may drop almost 40%. Yes same as it was done in 2018.
This chart is likely to help you make better trade decisions if it does consider upvoting it.
I would also love to know your charts and views in the comment section.
Thank you

Total MarketCap BTC ETHtotal marketcap breaks the long term bullish trend . be careful with your money
it means cryptos are exchanging to usd and other currencies. so we will see Red Markets again

TOTAL2 - Developing the Bottom Structure Plotting a bottom along the 4.618 of a strong downtrend Fib Circle
As you can see the price is moving along this thicker green line
I expect the second bottom to occur and consequently a double bottom occurring
Following this double bottom a rise is in order
This is a complementary post to the one below

🟢 TOTAL M.CAP - 1D (22.09.2022)🟢 TOTAL Market Cap
Here is possibly some more confirmation that a crypto pump is due before continuing the downtrend.
RSIs have bottomed on 1D and looks like it is building a base here to take off from.
The target is between $1.05t - and $1.01t - this could put BTC somewhere between $21-25k.
This idea invalidates if it drops below around $805b.

TOTAL2 Alternate Bull Trap ScenarioPrice right now is pretty stagnant this could be indication of a bottom or a bull trap similar to one seen in prior bear market
This is a max pain scenario
Linking my other analysis which suggests this price action is the bottom. Its gotta be one of them right?

#TOTAL MARKET CAP TECHNICAL ANALYSIS!!Hi guys, This is CryptoMojo, One of the most active trading view authors and fastest-growing communities.
Consider following me for the latest updates and Long /Short calls on almost every exchange.
I post short mid and long-term trade setups too.
Let’s get to the chart!
I have tried my best to bring the best possible outcome to this chart, Do not consider financial advice.
TOTAL MARKET CAP UPDATE
As you can see in the chart or absorb in the chart here TOTAK MARKET CAP is making these two patterns.
first symmetrical triangle pattern which is a semi-bullish pattern, here we need a breakout or breakdown to confirm this pattern.
The inverse head and shoulder pattern is a bullish pattern but here we need to break out the nice line of this pattern to conformation this pattern.
This chart is likely to help you make better trade decisions if it does consider upvoting it.
I would also love to know your charts and views in the comment section.
Thank you

Total Crypto Market Cap Monthly chart looks to have hit bottom. Total Crypto Market Cap Monthly chart
can you see how this is super bullish? Look
at the Ascending Bullish Trendline holding
support perfectly. The DeMark9 Indicator
is showing that there is a super high probability
that the enitre Total Crypto MarketCap is at the bottom.
The 100 Day and the Bull Market Support Band
is at the exact same place on the chart. The
monthly candle only needs to get above and close
above the green line and Bull Market is back in action.
Im looking for us to get there in the coming 30-90 days.

TOTAL Up Channel Idea and Future Price ActionThe areas in green boxes are very similar
Acting as bottom points for price and the end of the bear market
Price then following this progresses to climb over dotted diagonal line and retrace briefly back above the dotted diagonal (red horizontal)
From there the rest of the bull run comes
Bars pattern placed shows what I think price action will do
