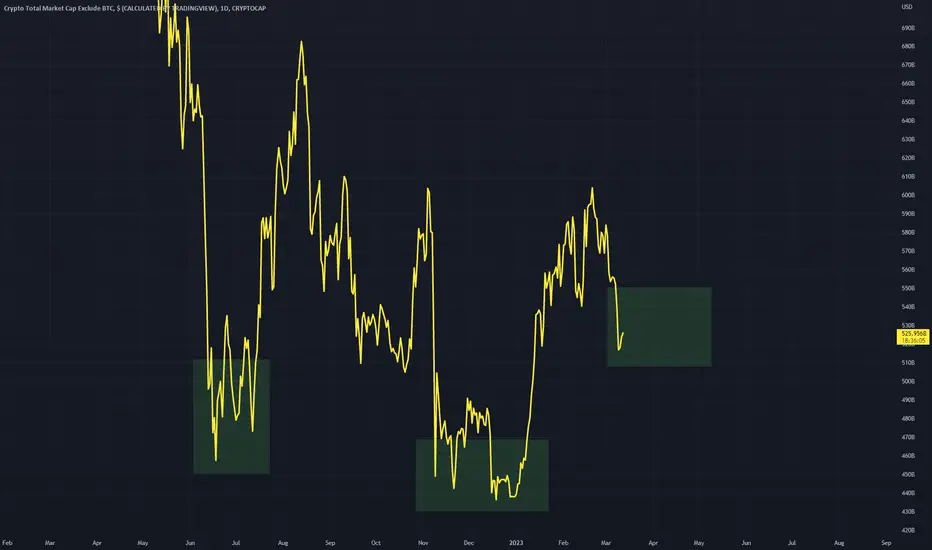
Total Market moving up with possible correctionWe may rise 4% to hit the imbalance area before dropping to the correction target.
Totalmarketcap

TOTAL CRYPTO MARKET CAP TO $40 T- As we can see every time there was a btc halving event there was a bullrun, then within 12-18 months we had a cycle top!
- Same to repeat again?


TOTAL Crypto Market CapAs with many other Markets, Crypto took a Dive as fears about SVB came tot he surface but as soon as ideas of safty came out, Look how it recovered. This is one of the MAJOR advatages of Crypto, it really is 24/7, trading any day and at any time. Some people Still cannot get their heads around that.
Anyway, Look at the Volume that came in. thats shows Huge amounts of support
But for now, the Rise in PA may need to take a breather as getting overbought on lower timeframes, and yet, given how the markets are, it would not surprise me if PA jumped once more at some point - it really is a matter of Watch what happens and react accordingly.
Fundimentals may emerge that could knock Crypto market heavily, for instance, the Universal Commercial Code (UCC) guidelines update, - that is actually a new law that bans crypto as a "Currency" but paves the way for CBDC's. Be VERY careful about this.

Total CapThe crypto market has seen tremendous growth in recent years, with an increasing number of individuals and businesses adopting cryptocurrencies as a viable alternative to traditional fiat currencies. This has led to a surge in demand for blockchain technology, as it provides the foundation for cryptocurrencies and enables secure and transparent transactions.
One of the most promising applications of blockchain technology is in the field of decentralized finance (DeFi). DeFi is a financial system that is built on blockchain technology and is designed to provide users with greater financial autonomy and control. It enables users to access financial services without the need for intermediaries such as banks, and allows them to trade, borrow, and lend cryptocurrencies in a decentralized and secure manner.
Moreover, the integration of artificial intelligence (AI) in the crypto industry is also on the rise. AI has the ability to process vast amounts of data quickly and accurately, and can be used to analyze market trends and make predictions about future market movements. This has the potential to revolutionize the way people invest in cryptocurrencies, enabling them to make more informed decisions and ultimately generate higher returns.
Furthermore, the adoption of AI in the crypto industry has also led to the development of more sophisticated trading algorithms that can execute trades automatically based on predefined criteria. This has led to increased efficiency and accuracy in trading, as well as a reduction in the risk of human error.
In conclusion, the expansion of the crypto market, the adoption of AI by the industry, and the advantages of DeFi are all exciting developments that have the potential to transform the way we think about finance and investing. With continued investment and development, we can look forward to a future where cryptocurrencies and blockchain technology play a central role in shaping the financial landscape, and where DeFi and AI enable greater financial autonomy and control for users all over the world.

TOTAL2 Inverted H&SInverse H&S structure is forming on the altcoin market cap chart
This right shoulder might push the cap much higher and result in a recovery
Chart pattern analysis
Daily timeframe
TOTAL Crypto Market Cap WEEKLYThe chart speaks for itself mostly. PA still in long term descending channel, Wicked down to lower trendline and found support
VRVP shows a lot of resistance above and not a lot of support below IF PA breaks out of channel
Fundimentals right now are very Biased against Crypto and to many extents, unjustified. IT is the simple Fact that Crypto has been relent on Banking to ALLOW funds into Crypto space and as we have seen, the issues on some banks liquidity forcing Crypto to pay the price. It is much the same situation as we had in 2008 - Banks Lending to possibly unsecure clients.
Once Crypto has its own Financials, independent of the Trad Fi banking System, will this change ?
Only if the Cobwebs of " I lend to you, you lend that out and then it gets lent again and we all crash when one can't pay" Stops happening.
Anywya, on a TA Front, PA broke out of long term resistance and is currently coming back down to test it as support Simple Bullish behaviour
Just needs to be "Allowed" to carry on......The FED may try and find something else to try and weaken t

Total 2 #total2
I see an accumulation on the monthly chart and this is how I determine my possible roadmap.

Understanding the Crypto Market CapThe cryptocurrency market has experienced significant growth but more recently saw a huge decline as sentiment soured due to several scams, insolvencies and a lack of regulation.
Bitcoin, the first and most well-known cryptocurrency, has played a significant role in this growth. In this analysis, we will explore the relationship between the crypto market cap and Bitcoin.
Bitcoin's dominance in the cryptocurrency market has been significant, with the market capitalization of Bitcoin accounting for over 40% of the total crypto market cap.
As a result, changes in Bitcoin's price often have a ripple effect on the entire crypto market. When Bitcoin's price rises, it can create a positive sentiment across the market, leading to increased demand for other cryptocurrencies and driving up the total crypto market cap.
Conversely, when Bitcoin's price falls, it can lead to a decrease in demand for other cryptocurrencies, causing the total crypto market cap to decline.
There are several factors that influence the relationship between the crypto market cap and Bitcoin.
One of the most significant factors is the overall sentiment toward cryptocurrencies. When the sentiment is positive, investors are more likely to invest in Bitcoin and other cryptocurrencies, leading to an increase in the total crypto market cap.
However, negative sentiment towards cryptocurrencies can have the opposite effect, leading to a decrease in demand and a decline in the total crypto market cap.
Another factor that can influence the relationship between the crypto market cap and Bitcoin is regulation.
Regulatory changes, such as bans on cryptocurrencies or increased oversight, can have a significant impact on the market. For example, when China announced a crackdown on cryptocurrency mining and trading in May 2021, it led to a sharp decline in Bitcoin's price and a subsequent drop in the total crypto market cap.
Furthermore, technological advancements and developments in the crypto space can also influence the relationship between the crypto market cap and Bitcoin.
For example, the rise of decentralized finance (DeFi) has led to the development of new blockchain-based financial products and services, driving demand for cryptocurrencies and increasing the total crypto market cap.
So, what does this mean for investors and traders?
Understanding the relationship between the crypto market cap and Bitcoin can be useful in making informed investment decisions.
When considering investments in cryptocurrencies, investors should carefully monitor the price of Bitcoin and its impact on the total crypto market cap. Additionally, keeping an eye on sentiment, regulation, and technological advancements can help investors make more informed decisions.
However, it is important to remember that the crypto market is highly volatile and can experience rapid price movements, making risk management strategies crucial for success in this market.

Uptrend in the crypto market. Or at least showing beautiful signTotal crypto market by the end of 2025 will have +10 T

TOTAL MARKET WALL STREET SCHEMEPsychology of a Market Cycle.
Where is Crypto on the Wall Street Cheat Sheet!

What's up about crypto market cap💰. TOTAL CRYPROCAP 📈📉Hello guys. This is an update of previous analysis (blow link), The chart is very similar to Bitcoin now. After breakout the trend line , I expected some correction as a pullback and complete the pattern then continuation of upward but this has not happened yet and the market needs that ,Consider it and monitor the price's action in the circles.
Good luck.
If you like the idea, do not forget to support with a like and follow me for next analysis :)
Write your comment and opinion here to me

TOTAL Crypto Market CapAs we can see from the chart, PA has got above the neckline of the FTX drop and more importantly, is now using it very clearly as support while things cool off
This line of support also happens to be the 236 Fib retracement line.
Golden Cross on 500 / 200 MA
MACD & RSI all in good shape to push up again. The Only thing is the StochRSI on the weekly, which is overbought but can range longer. A Small Dip in PA would take that back down.
There also appears to be little resistance above. Maybe that target of $30K is a possibility now
But be under no false impressions, I am still expecting the Summer period to be hard for everyone as "Debt Ceilings" get called out in the USA economy and the treasury stops "helping"
This could upset things
Lets take it step by step and for now, Bitcoin & Crypto looks good, as recent 600%+ gains in various smaller cap coins shows.

TOTAL MARKET CAP 12Hr UPDATE BY CRYPTOSANDERS
Hello dear traders, we here new so we ask you to support our ideas with your LIKE and COMMENT, also be free to ask any question in the comments, and we will try to answer all, thank you, guys.
TOTAL MARKET CAP ANALYSIS UPDATE:-After getting rejected from the strong supply zone, it is now bouncing off the ascending trendline support, where the Ichimoku cloud is also acting as a support.
The MACD crossover is losing bearish momentum, and as long as it holds above the Ichimoku cloud, we can expect a continuation of the bullish trend. While a solid break of the Ichimoku cloud will signal further correction in the Alts.
Sorry for my English it is not my native language.
Hit the like button if you like it and share your charts in the comments section.
Thank you

Crypto market capitalization: infinite bullish 🚀?🛑 If the worst happens, we have a bull trap on this diagonal resistance.
For now everything is normal, if it doesn't break the previous week's low.

Crypto total market cap compared to wall street cheat sheetIf crypto total market cap is following wall street cheat sheet fractal:
Capitulation (3AC/LUNA) created first low
Anger (FTX implosion) created lower low
Depression creates final low
Prediction: we sweep the FTX lows from Nov/Dec 2022 creating an August 2015 style bottom in August 2023

TOTAL Crypto Market CapLooks like PA is likely to come back down and test the Neck line of the FTX recovery, as support
This is NOT a bad thing
If we continue through the neckline, THATS a bad thing
GOOD Things are the possible, Very likely GOLDEN CROSS with the 50 /200 MA on thursday - should lead to more positive Sentiment

TOTAL Crypto Market cap DAILY UpdatePA is ranging while the daily MACD cools off, as it has now done. It could Drop lower and signs are it may well do so. RI is nearer 0 and may bounce of it if PA decides to continue to range and not come back down to test support on the neckline of the FTX Recovery ( Dashed /white line). What has kept the TOTAL PA up while BTC has been ranging are the lower cap coins, or OTHERS, though I feel this may change now as the Bitcoin Dominance chart shows a turn of trend maybe towards more bullish end of week, possibly
What is interesting is that we are approaching that "Golden Cross" on the TOTAL chart, the 50 EMA ( Red) crossing over the 200 ( Yellow) - Should PA drop to the neckline, this will postpone this very Bullish sign, depending on how fast that drops. For me, I see it crossing on Thursday but maybe remaining a very shallow distance between the two for a while.
Over all, I feel things are stuill good in Crypto space and we all should be looking ahead and accumulating..
The New age of Finance is here and it is developing VERY WELL

TOTAL2 Scenarios, Bull and Bear TOTAL2 has formed a strong upward movement, this could be followed by further upward movement, favoring continuation or a downward move, favoring the chart pattern of an inverted H&S
TOTAL2 is the altcoin market, but largely follows BTC and TOTAL
Lets see what happens
4Hr chart

TOTAL - Crypto market phases🟩🟨🟥⬜️Update on this chart since ~5 month dear Crypto Nation😎🚨
These repeating patterns of different market phases are still valid IMO🟩🟨🟥⬜️
Did we finish the A-B-C correction and are at the start of the Bottom market phase for Cryptocurrencies ❓
Let me know your thoughts in the comments🤗
⬇️⬇️⬇️
Likes and Follow for updates appreciated🤗
Disclaimer:
Not financial advice
Do your own research before investing
The content shared is for educational purposes only and is my personal opinion

Total Cap Drop ComparisonPossible pattern comparing against previous drop with the Total Cap. Fake break out right now and retest previous resistance. Dropping about the same percentage.

TOTAl weekly observation EDITTEDPREVIOUS VERSION OF THIS POST GOT MESSED UP AND I LOST TIME TO EDIT SORRY
this one should make more sense
The Green box we are in currently has acted as Support and resistance for a few months now but maybe its time is coming to an end.
Note the exact same day spans on the marked zones.
Note that the Descending channel that PA is in, is getting tighter and currently, as PA remains pressed under the line of resistance, the other trendline Gets closer.
Time is running out for PA to react and react it Must - As you can see, the 112 day limit on the right is exactly when the two lines of Resistance cross each other
Failure of PA to react to this would be a big move to lower support, probably back to wicking down to the $17K Mark on a weekly Candle
We shall see

TOTAl weekly observationThe Green box we are in currently has acted as Support and resistance ofr a few months now but maybe its time is coming to an end.
I notalso note that the Descending channel that PA is in, is getting tighter and currently, as PA remains pressed under the line of resistance, the other line Gets closer.
Time is running out for PA to react and react it Must - As you can see, the 112 day limit on the right is exactly when the two lines of Resistance cross each other
Failure of PA t esed the similar time spans, as marked on the chart, and the 3rd should see us out of that Box, in an uptrend.
You will acpe this would be a big move to lowwer support, probably back to wicking down to the $17K Mark on a weekly Candle
PA needs to break UP
Lets see
