TOTAL2 - Support CurveA curved support line on the 4H chart for TOTAL2
I suspect this to HODL and price to rise on the right side of the larger overarching pattern
The dashed green line is a strong horizontal support
4HR chart
Totalmarketcap

TOTAL Bearish PennantThe Parameter known as TOTAL has a currently working bearish pennant formation.
Market is bearish and every green candle on Total means another Short opportuinty.
If Total breaks 2.58T (which is a montly pivot value), we can expect more dumps. 2.36 would be the main target.
When Total reachs 2.36, look for a long wick. If the daily candle close isn't happening, it's a Long opportuinty.

Crypto Market at Critical Crossroads: Is History Repeating?Maybe an altcoin season seems too luxurious for us investors right now.
The TOTAL market cap is currently at a critical point, showing price action similar to past cycles.
Previously, we had COVID as our black swan event - could today's equivalent be a trade war?
We're probably approaching the final wave before the market truly enters a downtrend. It's crucial now to stay alert and prepare carefully.
Everything the US is currently doing—including tariffs—serves one goal: shrinking their huge federal debt load, absorbing wealth from other global economies, and keeping gold prices in check. This gives the FED more room to reduce interest rates and reignite growth.
Eventually, global markets always rebalance. Governments typically respond by printing more money to ease the pain, and historically, that's positive news for BINANCE:BTCUSD
Cheap money policies always return; it's just a matter of when.
Your job now is straightforward:
- Be patient
- Stay flexible
- Maintain solid cash reserves
Remain calm, stay sharp, and be ready for opportunities.
#BTC #FED #TotalMarketCap #CryptoTrading #TechnicalAnalysis #CryptoVeteran #TheCryptoFire

Bitcoin Analysis: Potential Path to $150K and Market TrendsCurrent Price & Key Levels
- BTC/USDT Price: BINANCE:BTCUSDT (as per chart).
- Critical Support: Bottom of the ascending channel .
- Key Resistance: Upper trendline of the channel (to be confirmed).
Technical Signals
1. Ascending Channel:
- Price is at the bottom of the channel, historically a bounce zone.
- A break above the upper trendline could signal a bullish continuation.
2. Moving Averages:
- SMA 200 (4H) and SMA 20 (1D) are critical for trend confirmation.
- A bullish crossover (e.g., SMA 20 > SMA 200) would strengthen the buy signal.
3. Dominance (BTC.D):
- If Bitcoin dominance turns bearish, expect capital rotation into altcoins (altseason potential).
- Monitor dominance alongside price action for market shifts.
$150K Target: When and How?
- Scenario 1:
- A strong breakout from the ascending channel + rising volume → Acceleration toward $150K.
- Timeline:Mid-2025/Late-2025 (historically aligns with post-halving cycles).
- Scenario 2:
- Slow grind upward with corrections → $150K likely by 2026, pending macroeconomic stability (e.g., ETF inflows, regulatory clarity).
Altcoin Season Watch
- Trigger:
- If Bitcoin’s dominance drops below 57%, altcoins may surge.
- Focus on high-cap alts (ETH, SOL) and narratives like AI, DePIN, or RWA.
Trade Strategy
- Entry:
- Buy on confirmed breakout above the channel + SMA crossover.
- Stop Loss:
- Below the channel’s lower trendline (e.g., $80,000).
- Take Profit:
- targets: $100,000.120,000
- Final target: $150,000 (scale out profits).
Risks to Monitor
- Macro Factors: Fed rate decisions, geopolitical tensions.
- Bitcoin ETF Flows: Sustained inflows/outflows impact momentum.
- Regulation: Crackdowns or approvals (e.g., ETH ETF).
---
Conclusion
- Bullish Outlook: $150K is achievable if Bitcoin holds the ascending channel and dominance remains stable.
- Altseason Hedge: Prepare a basket of altcoins if BTC.D trends downward.
Like, comment, and follow for updates! 🚀

USDT Dominance New UpdateIn short time frames, USDT.D has formed an Head and Shoulders pattern. If the neckline is broken, we expect a little dump in here which will make some of alts recover for a short while.
Due to BTC dominance is a lot higher than a week ago, I consider to long Bitcoin only.

Long BTC, Long MSTR, Neutral to XAUExpecting BTC to consolidate relative to Gold for a few more days and then breaking out and outperform Gold. The ratios make it a more attractive trade with more upside potenial. Im buying NASDAQ:MSTR because of it´s leveraged bet in Bitcoin. I believe Microstrategy will outperform BTC in this scenario breaking out to new all time highs.
CME:BTC1!
COINBASE:BTCUSD
BINANCE:BTCUSD
BITSTAMP:BTCUSD
FX_IDC:XAUUSD
OANDA:XAUUSD
NASDAQ:MSTR

Is the Total Crypto Marketcap gearing up for a major move?A few months ago, the total crypto market cap surged past its previous highs, reaching a new all-time high of $3.7 trillion.
The current pullback appears to be a bullish retest of the breakout level, potentially setting the stage for the next upward leg.

short opportunity total market cap cryptosee chart for specific trade setup annotated with play and rationale

Lets Make Life Changing Money TogetherMartyBoots here , I have been trading for 17 years and sharing my thoughts on CRYPTOCAP:OTHERS .
.
CRYPTOCAP:OTHERS is looking beautiful , absolutely beautiful and a very interesting chart for more upside, it is now getting into support. Just like NASDAQ:AMZN did back in 2008.
Do not miss out on CRYPTOCAP:OTHERS as this is a great opportunity to make life changing money on ALT Coins.
Regulation is going to moon this market
Be Ready
Watch video for more details

My Final Idea on Total 3 based on wyckoff method !we're in Accumulation phase right now and we have to wait for price to make a clear direction above the resistance line
Leaving this zone means we're ready for good moves and changing the market direction
in other hand we have to wait for USDT.D and BTC.D Move to lower prices
2025 is gonna be the best year for crypto market Be sure about that !

TOTAL2 - Weekly Support Possibility The middle of this indicator was previously seen as a strong support
Right now this is being tested as support right now
Will it act as support as before or break down further?
Weekly timeframe for this indicator which is still in its bullish state

TOTAL2 - Bull IdeaAfter some short term bear movement I expect a strong bull move as we enter the final stage of this bull market
I have shown this bull movement with the green bars pattern with an extension up to 1.272
Don't get shaken out as we are in a large green upward channel
Daily timeframe

Ethereum — March 2025 Edition. The Lord Giveth and Taketh AwayWe have discovered already at @PandorraResearch Team a month ago or so in earlier published idea , that Donald Trump's recent policies and statements have generated significant negative sentiment towards Ethereum and the broader cryptocurrency market. As he resumes the presidency, his administration's approach to cryptocurrencies is expected to be more regulatory and cautious, which could impact Ethereum investors.
Donald Trump's actions and announcements have had a negative influence on Ethereum prices through several mechanisms.
Disappointment Over Strategic Bitcoin Reserve Order.
Trump's executive order to establish a Strategic Bitcoin Reserve was initially seen as a positive move, but it did not lead to immediate government purchases of cryptocurrencies. Instead, it focused on creating a budget-neutral strategy, which meant no taxpayer funds would be used for spot purchases in the short term. This lack of immediate action led to disappointment and selling in the market, affecting Ethereum's price.
"Pump & Dump" Effect.
Trump's rhetoric and announcements often create a "Pump & Dump" effect in the cryptocurrency market. This phenomenon involves a brief surge in prices followed by a sharp decline as investors realize there is no concrete action behind the rhetoric. Ethereum, along with other cryptocurrencies, experienced this volatility after Trump's statements about including Ethereum in a crypto reserve.
Trade Tensions and Tariffs.
Trump's tariff announcements have exacerbated global trade tensions, which negatively impact the broader financial markets, including cryptocurrencies. Ethereum has been particularly sensitive to these developments, experiencing significant price drops in response to tariff threats against major trading partners like Canada, Mexico, and China.
Market Volatility and Uncertainty.
Trump's unpredictable policies and statements contribute to market volatility and uncertainty. This environment can deter investors and lead to price fluctuations in Ethereum and other cryptocurrencies. The lack of clear regulatory guidance under his administration adds to the uncertainty, affecting investor confidence and Ethereum's price stability.
Technical challenge.
The main technical graph for Ethereum BITSTAMP:ETHUSD indicates on further Bearish trend in development (since mid-December 2024) with acceleration occurred a day before Mr. Trump entered the White House.
Previous key supports were considered as 100-week SMA (near $2550 per Ethereum), $2200 flat multi bottom and 5-years SMA (near $2100 per Ethereum), so all of them are broken to this time. That is why we believe (in this case of multi breakthrough), it could lead the Ethereum price much lower, as it described on the chart.
Conclusion.
Overall, Trump's influence on Ethereum prices is characterized by disappointment over unfulfilled expectations, market volatility driven by his rhetoric, and negative impacts from trade tensions and regulatory uncertainty.
--
Best 'Trump & Dump' wishes,
@PandorraResearch Team 😎

TOTAL2 - Daily Uptrend RetestI think price will retest green circle, a point which was seen as a great support point leading to a strong bull move.
This bull move may occur again on this second retest of the upward white line within this broadening structure
still bullish it just may take another test of this downward movement
Daily timeframe

We are due a 2017 style ALT season.One for the memory banks!
Now
do we actually get what we are "owed" ?? :)
We don't know
and nothing is owed to us of couurse
But
Selling too soon could be quite disastrous... as many peopleI speak to say to me 5X - 10X I am out..
Which may be prudent
If you are out. Stay out and don't FOMO back in again near the tops
So it's best to scale out in my opinion
last cycle was a quite difficult Alt season ... some bag holders actually did not get to experience any euphoria
Hence why I am leaning to an exsplosive alt season
BTC at $70k doesn't feel euphoric
so what will it take?

Russel 2000 Compared to General MarketTVC:RUT has continued to sell off since my last couple posts and I believe we could see a huge market correction this year if price doesn't look to stop selling.
The next play on RUT I would like to see price pullback to the last breakout zone ($2,200) to confirm a continuation in trend
This play also looks very familiar to the 2022 selloff with equal highs to our current price structure. Seeing that AMEX:SPY is at a higher high tells me there is market-wide divergence and a topping pattern could be in play.
Now when we add CRYPTOCAP:BTC and $OTHER to the mix we can see bitcoin actually tops out first while Alts and SPX look to make one more leg up before crashing out.
The Trend Reader at the lower tab has topped out and has a bearish crossing in the overbought zone indicating we can see a long term play to the downside.

TOTAL Crypto Market CapThe CRYPTOCAP:TOTAL Crypto Market Cap dipped below its 2021 highs once more.
Last week's candle held, but prices slid lower this week.
Watching the weekly close to sustain the high timeframe uptrend.

Total Market on the preATH supportThe TOTAL MARKET for crypto is on the previous ALL TIME HIGH , after broke above that in Oct-Nov 2024 now is back testing that, which is a very classic movement to continue to the upside in my opinion

TOTAL CRYPTO MARKET CAP is back-testing the cup & handle patternIt's no mystery that the crypto market has been getting hit pretty hard since mid-December. However, the total market cap—which had previously broken out of a nice cup-and-handle pattern—is now backtesting the rim line and looks to be setting up for what could be an incredible move upward over the next 6 to 9 months, with the potential for a double within that timeframe.
Good luck, and always use a stop loss!

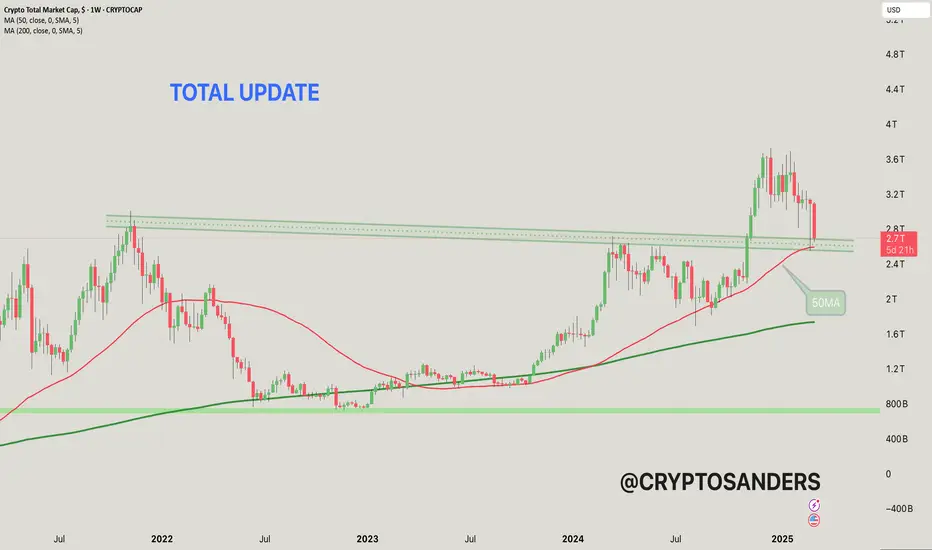
This chart shows the total cryptocurrency market capitalization,
The current value is around $2.271 trillion, which represents a significant drop of 12.51% from the recent peak.
50-MA (moving average): The red line represents the 50-week moving average, which is currently around $2.59 trillion. It acts as a short-term trend indicator and potential support level.
200-MA: The green line represents the 200-week moving average, which is around $1.73 trillion, which indicates a long-term trend and strong support level.
The horizontal green lines represent support levels around $2.4 trillion and $2.6 trillion. These levels are important for a potential bullish reversal if retested.
The dotted line above the price represents resistance levels near historical highs.
The recent decline suggests the market may be in a bearish trend after failing to break the resistance levels.
If the price is above the 50-MA, it could signal a reversal towards the resistance zones and a potential recovery. However, a break below the 50-MA could signal further decline. Keep an eye on the key levels around $2.4 trillion (support) and $2.6 trillion (resistance).
If you found this analysis helpful, hit the Like button and share your thoughts or questions in the comments below. Your feedback matters!
Thanks for your support!
DYOR. NFA
This is the alt season CRYPTOCAP:BTC.D BINANCE:BTCUSDT
Bitcoin dominance has toped out .
This is the start of alt season.
Remember to take profits

TOTAL MARKET CAP 2016\2017TOTAL MARKET CAP 2016\2017
TotalMarketCap final shakeout process before parabolic run!
CRYPTOCAP:BTC CRYPTOCAP:ETH and Altcoins will accompany the parabolic run!
Don't be shaken!

TOTAL is bearish (1D)The TOTAL structure is bearish. After breaking the previous high, there was no pullback to the previous high, meaning that buy order collection for the continuation of the trend has not occurred.
We are waiting for this index to reach the designated line.
Do not enter the position without capital management and stop setting
Comment if you have any questions
thank you
