Breaks of a Parabolic TrendRight now we are experiencing bearish action which will ultimately result in a break of this parabolic trend, this might seem grim, however the past two times have led to a recovery of the trend
This might occur again and the bull market will resume.
The white zones of the RSI are the break points of the Trend
I am suggesting a further down move, but a stronger recovery to follow this.
I do not believe the Bull market is completely over. Perhaps im a permabull.
Totalmarketcap

A super longterm look at the crypto market as a whole.Some price targets mapped out by my log curve. I took into account Fibonacci and EW as well.

Crypto Market Overview - Bearish SignsA short video breakdown of the market dynamics across 6 pairs to give content to whats developing in the markets.

TOTAL - A Bigger Fall May Be ComingThe dotted trendline is a trendline that extends to the beginning of this ticker (TOTALMCAP)
Just as it did in the first situation, price fell below this line, and then attempted to retest, causing a large rejection
This is very similar to what is happening now
Comparable moves are around -60% on the TOTALCAP

Crypto Total outlookso this one is really interesting for me, i dont know this kind of volume analyze works on total cap or not, but if so
1- negative outlook :
it can be 1/2 to 1/10 of what it is now, scary head and shoulder is forming (i dont trust in patterns anymore) if so the great depression in crypto market happens, lot a coins will disappear (recently mr buffett said i wont buy all the bitcoins for 25$) but you know no one can predict the future in my opinion so it would be better to work with strong possibilities.
2- positive outlook :
it move from here to 1.88T, then more volume that can push it to higher highs, thats it
also you can check the option orders of coin
www.barchart.com
and search alot about fundamentals if you want to put your money.

TOTAL MARKET CAP IMPORTANT UPDATE MUST READ!!Hi guys, This is CryptoMojo, One of the most active trading view authors and fastest-growing communities.
Do consider following me for the latest updates and Long /Short calls on almost every exchange.
I post short mid and long-term trade setups too.
Let’s get to the chart!
I have tried my best to bring the best possible outcome in this chart, Do not consider it as an
Financial advice.
TOTAL MARKET UPDATE
If you look closely at the liquidity of the market, it seems that they are made of a special mathematical function. The volume of capital input has experienced very good growth since the beginning of 2021.
The price is moving in the form of a long-term uptrend channel and now we are at the bottom of the channel. We expect it to continue to grow like the previous rally.
1. First rally: Starting from 500 billion to 2500 billion ( +2000 billion )
First Correction:Starting from 2500 billion to 1190 billion ( -1310 billion )
2 Second really: Starting from 1190 billion to 3000 billion ( +1810 billion )
Second Correction:Starting from 3000 billion to 1840 billion ( -1160 billion )
3. Third Correction: Starting from 1840 billion to 3700 billion ( -1905 billion )
This chart is likely to help you in making better trade decisions if it did consider upvoting this chart.
Would also love to know your charts and views in the comment section.
Thank you

#TOTAL2 1DAY UPDATE BY CRYPTOSANDERS Welcome to this quick update on the TOTAL2 analysis.
I have tried my best to bring the best possible outcome in this chart.
A very good position for ALTS!!
Total2 still holds support and is testing the previous resistance trendline and the altcoin may pump
If it is broken and closed downside from the support level then the chart will be invalid.
Sorry for my English it is not my native language.
Do hit the like button if you like it and share your charts in the comments section.
Thank you...

TOTAL 2 - Finding support, Trend break on mid-term draw down?Keep an eye on TOTAL2 Chart
strong close sees TOTAL2 attempting to break mid-term down trend
Heavy Bearish sentiment but some positive signs for short to mid-term trades
Resistance and support marked
In the unlikely scenario we break above marked neck line on inv' H&S, obviously things will shift very rapidly
Positive indicators on Daily:
MACD bullish cross
RSI breaking trend
Viewed in context of Macro trend:

Crypto Total MarketcapBehind this picture is a technical analysis, partly wave analysis, partly a lot of different foundations. If we fit any foundation for such a fivefold market growth, it seems that Bitcoin will strengthen its positions along with the growth of the DXY dollar index. This peak at a round figure of $10 trillion, which so far looks unrealistic, but tempting. I wouldn't draw such a growth if not for the turbulence on the world arena. You also have to understand that market capitalization and liquidity, are different concepts. As it inflates on the news, it will deflate later.
Perhaps things will stretch out and go on a dotted trend. It is also advisable to stay within this channel, not to break it down. If the channel will be broken and we will see fixation below, then with high probability such growth is canceled, it will be necessary to reconsider everything.

DEFI TOTAL BullishDEFI TOTAL looks extremely bullish as it sits above this yellow long term trend line and post moving out of a rising wedge that will end up playing in the bullish favor
Triangles like this have been seen before and are in green

TOTAL3: CRYPTO TOTAL MARKET CAP EXCLUDE BTC AND ETHTotal3 is falling to its targets
1: around 401B
2: 160B
NOTICE:
THIS IS NOT A FINANCIAL ADVICE

TOTAL2; CRYPTO TOTAL MARKET CAP EXCLUDE BTCTotal2 is falling to its targets
1: around 475B
2: 230B
NOTICE:
THIS IS NOT A FINANCIAL ADVICE

CRYPTO TOTAL MARKET CAPTotal is falling to its targets
1: around 1.13T
2: 380 B
NOTICE:
THIS IS NOT A FINANCIAL ADVICE

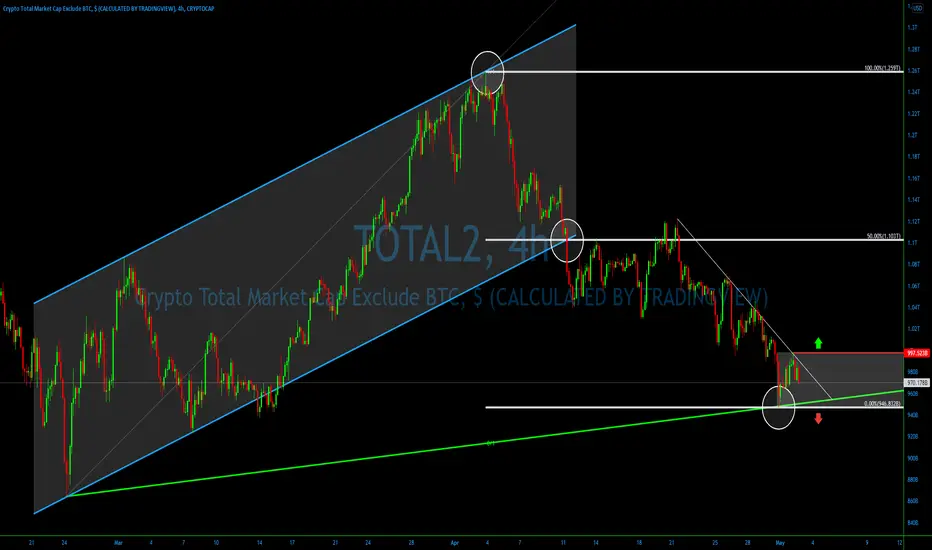
Crypto Market Cap bounced off a double support❗️💎On April 30, TOTAL2 had reached and rejected two technical indicators at 966.832B. The first is an 8/1 Gann Fan trendline and the second is a 0% Fibonacci level. We applied the Fibonacci so that 50% is placed right at the ascending channel breakout point. This way, Fibs show that after the breakout, the price has dropped the same distance as the width of the channel.
💎After the bounce, TOTAL2 retraced up, but failed to break a simple downtrend trendline. For the time being, we are likely to witness a short-term consolidation, between the strong psychological resistance near 1.0T and technical support at 946B.
💎Bears remain in control as long as........
TOTAL 2 What is a Tripple bottom reversal?
There should be an existing downtrend in place before the pattern occurs. The three lows should be roughly equal in price and spaced out from each other. While the price doesn't have to be exactly equal, it should be reasonably close to the same price, such that a trendline is horizontal.
is the market forming a Tripple Bottom Reversal?
if that is So, we may see a sharp 8 to 10% down More in Crypto market to confirm the pattern and a wick would give us more confirmation of a reversal.

ALTS MARKET CAP 12 HOURS UPDATEHi guys, This is CryptoMojo, One of the most active trading view authors and fastest-growing communities.
Do consider following me for the latest updates and Long /Short calls on almost every exchange.
I post short mid and long-term trade setups too.
Let’s get to the chart!
I have tried my best to bring the best possible outcome.
TOTAL 2 UPDATES:
total 2 is making this big EXPENDING channel pattern, currently, it looks like it is going to retest the lower support.
we can bounce from the lower support of this channel so let's see how it goes.
RSI is showing some bearish divergence move.
if it breaks the lower support of this channel then the chart will be invalided
This chart is likely to help you in making better trade decisions if it did consider upvoting this chart.
Would also love to know your charts and views in the comment section.
Thank you

The Crypto Market Dynamics and BreakdownA brief overview of BTC , TOTAL, TOTAL2 , USDT dominance, USDC dominance and DXY (dollar strength index).
So guys, i thought id post an update on the most recent crypto market developments, i plan to push out a video alongside this too to break it down in depth but heres what im seeing developing so far.
Ive correlated 6 charts that i think are worth looking at on a whole to get an idea of market wide developments. BTC , the driver of the market direction. Stablecoin dominance pairs, showing the relationship of money flow in and out of stablecoins back into the market (highly correlated with reversals), TOTAL and TOTAL2 , the total crypto market caps for ALTS and for BTC and ALTS to see overall bullish / bearish intensions, and the DXY (dollar strength index) which has been known to work inversely with BTC market reversals. E.g, when DXY is pumping, crypto is correcting and vice versa.
I think at present theres more downside risk than upside potential having cleared the charts and looking at the in a new perspective. I am still longer term bullish until we break and close below 28K which would confirm a new LL, breaking the range we've been in for the last year and invalidating any bullish momentum. However at current we have put in a new HH on TOTAL and TOTAL 2 and respecting the swing low so things remain to be bullish based on HTF structure for both marketcap pairs. That being said it seems as though we have been generating liquidity on both the buy and sell side on BTC , where due to having an inefficiency to fill to the left, price has nothing to liquidate as there is no structure to target to run stop losses. Therefore, what we have been developing is this upwards bearish flag formation after coming into HTF weekly demand. Buyers have shown presence with higher volume coming in at the lows and respecting an uptrend, but with the intension to mitigate the HTF supply above taking out the sell side liquidity and now targeting the buy side liquidity, sweeping the first low we have put in within the weekly demand range to target the extreme demand range on the weekly and daily timeframes. This would have induced both buyers and sellers into the market to liquidate them all enabling a capitulation event to take place to fuel the move higher. This same scenario looks likely to occur on both the TOTAL and TOTAL2 pairs too.
Stablecoin pairs did start to show some bearish signs with bearish divergence on the RSI and putting in new lower lows on the daily TF and weekly TF with bearish momentum coming in as shown by the engulfing candles and also respecting HTF supply. However, we have continued to the upside with less momentum and approaching key supply zones now. If price manages to push through these then it would be a continuation to the upside for stablecoins and bearish for the rest of the market. Right now its just a case of being patient and watching for signs of bearish structure change on the daily TF as we come into the zones. I think theres a possibility for them to push higher and fake out the highs, creating that capitulation event before reversing and becoming bearish with the market becoming bullish after such an event.
DXY is bullish on the weekly, but remains bearish on the monthly timeframe , coming into HTF supply range on the monthly TF in the premium of the leg. Im expecting the DXY to take out the highs, liquidating the highs, come into that HTF supply and reverse before starting to take out the lows. It looks oversold on the RSI on weekly and monthly and usually results in a reversal at these points. It works inversely to BTC so if the DXY becomes bearish it would be a good sign for the crypto market.
The dynamics are correlating to show short term bearish momentum for a possible long term bullish outlook. The on chain analysis also supports this with supply still getting taken and large volumes on outflow activity occurring. That being said, the economy on a whole look bleak right now, stocks look terrible and BTC has held up pretty well so far in comparison. Talks of one of the biggest recessions is also looming with a macro economic POV that looks pretty trash right now so its all a little uncertain at present, not just for crypto but with the larger economic outlook.

Total Market Cap: At A Crossroads As we head into next week, markets have been heavily bracing for the FEDs Rate Hike on May 3rd or 4th . War is escalating in Ukraine, World Food Supplies are in disarray, Inflation is still at historical levels, Energy is soaring, and Supply Chains continue to struggle.
There are so many Macro challenges building up that simply put, they can't be ignored; No matter how irrational the market wants to be.
I truly feel greed has taken over and most investing has become gambling (Warren Buffet recently said this). Especially in the Crypto space.
Who buys because they believe in the Utility of the coin and who buys simply to flip it for profit?
Its become a side hustle ever since the First Top in May 2021. Euphoria hit all markets from the 2020 BOOM and everything exploded. When ALL things go UP, this is rather unusual.
Usually, especially historically, these characteristics would align with this mystical "Blow off the top" but you know it's never enough.
We even have seen a second round of a bullish wave in July 2021, shortly after the original drop in May.
But again, it simply was not enough.
With every pump and dump, everyone wants more and more.
Profits, profits, profits. Leverage, leverage, leverage.
Even in the face of the absolute worst Economic/World conditions we have seen in MOST of our lifetime!
Investing has turned into legitimate degenerate gambling between Stock Options and ALT Coins , and the market will correct as far as it needs to in order to cleanse this mentality.
Back in 2020 when the MEME stocks first took off and retail flooded the market like never before in history, that was the first signal of a Cyclical Top coming in. If everyone is already flooded in, where does this extra money come from? These Cycles take a very long time to play out and to this day no one wants to even consider it.
There are two paths forward for this next week:
Scenario #1: Markets absorb this 0.50% or 0.75% Rate Hike and bounces
Scenario #2: Markets can't sustain the hike and loses all major supports.
Both Stocks and Crypto are laying on critical support; I am leaning 60 / 40 odds in favor of Scenario #2.
Let me know what you guys think!

#TOTAL MCAP, Did you observe the breakout on this indicator?The total market cap is on support and holding for the last one week.
This is a decisive moment. You gotta be careful here.
As long as the support holds am bullish on it.
Also, do you see those breakouts on the RSI? Also holding the lower BB support.
The indicator is far pointing towards an upcoming bullish move in the entire market.
INVALIDATION:- Break and close below this channel.
Do hit the like button if you like my ideas and share your views in the comment section.
Thank you
#PEACE

$Crypto Total Market Cap April 30, 2022 the price action of Our total market cap acting out accordingly as explained and expected in the chart
Where the price action after forming out the 2nd Bottom of the Double bottom On daily time frame it went out to the resistance level of the monthly time frame and got rejected from the Resistance level which is marked at the 2.15T Level
Whereas the current price action is bouncing back from the Monthly Support level
i expect a further drop in price means money will leave the market again... I'll keep you updated.

This isn't looking good...Hey Traders,
As we can see on the weekly candle closes of the total market cap of cryptocurrency. The market cap price action has formed an eerie Head and Shoulders. Additionally connecting the two peaks, shows the RSI hasn't made a higher high indicating the bulls are weak. This is worrying...
Safe Trading,
-Pulkanator

BITCOIN - Overview of the situationBitcoin is trying to cross the $ 41,860 resistance level on a four-hour TF. It also has a support range of $ 40,000 to $ 40,500 below. To ascend to higher areas, it must have a price stabilization above the resistance of $ 41,860. Also, know that $ 44,300 is the next resistance. The main resistance after that is in the range of $ 44,300.
There is a rapid and violent increase in BTC addresses holding between 1 and 10 BTC (Between $40,000 and $400,000 worth). This generally means a heavy accumulation from prominent players and could hold the key to our next move.

BITCOIN - Technical Analysis❌ Bitcoin has risen slightly today after yesterday's crashes. Bitcoin traded at $ 38,300 yesterday. It is currently priced at $ 39,200.
Today, Bitcoin's dominance in the digital currency market is about 42.5% of the total volume of the cryptocurrency market. The volume of this market (Market Cap) has reached about 1.75 billion dollars today. THORChain and Secret currencies, with 13% and 9% profit, have been the most profitable currencies in the digital currency market today.
Fear and Greed index of digital currencies has reached 22 today. Yesterday, this index was in the same range, which indicates the Extreme Fear of these days of investors in this market.
✅ Bitcoin is currently at the bottom of an uptrend channel in the 4-hour timeframe. So far, its reaction to the blow to the channel's floor has been positive, but it remains to be seen what will happen in the future candlesticks.
The acceleration of the falls has slowed down so far. If the price grows faster, we can expect the next destination of Bitcoin to be $ 42,000, which is the middle of the current uptrend channel.
But if low time frame sellers decide to sell heavily, it is also possible that the current channel will be lost. In this case, the first support for Bitcoin will be in the range of $ 37,000.
