TOTAL 2 has left its channelThe total index exits the channel in the long-term weekly and, on a weekly basis, forms the Rising wedge pattern
Totalmarketcap

TOTAL MARKET CAP 12 HOURS UPDATE Hi guys, This is CryptoMojo, One of the most active trading view authors and fastest-growing communities.
Do consider following me for the latest updates and Long /Short calls on almost every exchange.
I post short mid and long-term trade setups too.
Let’s get to the chart!
I have tried my best to bring the best possible outcome.
TOTAL 2 UPDATES:
total 2 is making this big ascending channel pattern, currently, it is making this falling wedge pattern inside the channel.
we bounced from the lower support of this channel but we need to break out this falling wedge pattern let's see how it goes.
RSI is showing some bullish divergence move.
if it breaks the lower support of this channel then the chart will be invalided
This chart is likely to help you in making better trade decisions if it did consider upvoting this chart.
Would also love to know your charts and views in the comment section.
Thank you

[UPDATE BTC] Bitcoin. Don't overcomplicate things Bulls (part 2)Few understand...
Bullish .
However, not sure about the exact month:
- some of my models predict the BTC top to occur in July - Sep 2022
- some other models make me believe in a Dec 2022 - March 2023 BTC top
- the M1 model instead is telling me another story: another bear trap local top in 2022, a gradual blow-off top increase that ends in 2024, and then a 7 years bear market.
Anyway, bullish .

Total Crypto MC can drop to 1.5T againSince the beginning of November, the Crypto market is in a downtrend and although there were attempts of reversal in January and February, around 2T sellers entered the market.
At the beginning of April, a new leg down has started and this drop could lead to a drop at 1.5T

total market cap just a quick idea about what going on on crypto market and my prediction next few weeks for market cap

TOTAL MARKET CAP 1DAY UPDATE BY CRYPTOSANDERSHello, welcome to this TOTAL MARKET CAP 1 DAY chart update by CRYPTOSANDERS.
I have tried my best to bring the best possible outcome to this chart.
Show some support do hit the like button, follow and comment in the comment section. this motivates me to bring this kind of chart analysis on regular basis.
CHART ANALYSIS :
As we can see from the above-mentioned chart that TOTAL MARKET CAP broke the triangle pattern and retested the upper trend line.
After a successful retest, it moved upside which is the indication of a bull rally in the market in the upcoming weeks.
If it broke the green zone this chart will be invalidated but if it moves upside or is able to sustain this green SUPPORT line then the bull rally will continue.
Sorry for my English it is not my native language.
Do hit the like button if you like it and share your charts in the comments section.
Thank you...

Crypto Total Market CAP Bearish FlagHello Traders
Crypto Total Market CAP is moving in a Bearish Flag.
I believe market will stay bullish until MCAP makes a Lower High or completes E Wave.
2T and 2.24T MCAP are important zones to watch.
Like, Follow, Share & Comment.
Thanks For Reading.
-RC

TOTAL MARKET CAP 1DAY UPDATE BY CRYPTOSANDERSHello, welcome to this TOTAL MARKET CAP 1 DAY chart update by CRYPTOSANDERS.
I have tried my best to bring the best possible outcome to this chart.
Show some support do hit the like button, follow and comment in the comment section. this motivates me to bring this kind of chart analysis on regular basis.
CHART ANALYSIS :
As we can see at the above-mentioned chart that TOTAL MARKET CAP broke the triangle pattern and retested the upper trend line.
After a successful retest, it moved upside which is the indication of a bull rally in the market in the upcoming weeks.
If it broke the blue MA this chart will be invalidated but if it moves upside or is able to sustain this MA SUPPORT line then the bull rally will continue.
Sorry for my English it is not my native language.
Do hit the like button if you like it and share your charts in the comments section.
Thank you...

Total market cap - cryptoBased on Volume profile, there is an obvious move down to test the strong horizontal volumes level, where I assume a strong rebound to the upside.
Will see, trade safe. Just FYI, IMO ))

TOTAL.3-4HAs you can see, there is a double bottom pattern is forming, 730B neckline must be broken and price must hang above it by closing 4H candles.
But I'm still not convinced that this is the rally that will take us to 50k, BTC is so weak and fragile. Still, I will trade it if neckline breaks.
NFA, DYOR.

Crypto Total Market Cap AnalysisThe price of Bitcoin has broken the $39,000 our key mid-term breakdown level, on higher time frames, will likely take us much lower towards $36,700 (Bullish Order Book) before another potential mid-term bounce.
The Crypto Total Market Cap is going to retest 1.7T for more liquidity grab thereafter, a reversal.

Total market capTOTAL
(Total market cap)
On the bottom of the ascending channel
Expect : medium-term growth
In case of losing the bullish channel, the market will fall

TOTAL 1D Chart Analysis PennantTOTAL is currently forming this pennant structure on the 4H time frame at support. This is a big deal for the whole of crypto and is a key decision point.

TOTAL M.CAP ANALYSIS! BULLISH RALLY AHEAD!!Hello everyone, if you like the idea, do not forget to support with a like and follow.
Welcome to this TOTAL market cap update. TOTAL M.CAP looks promising here.
Here are some reasons why I'm bullish:
1) Total M.cap is trading inside a rising channel in a 3-days time frame where it is forming HH and HL. After making a recent HL now it is ready to make a new HH.
2) It's breaking out from the falling wedge and looks like a retest is also done. After making a retest it gives the confirmation by making a green candle.
3) Holding above the purple line very accurately so far.
4) Holding the pink MA which is quite bullish.
Invalidation level:- If any candle closes below pink MA. Previously when it loses this MA market dumps 40-50%
What do you think about this?
Do you think we might see a bullish rally in upcoming months or do you think that a big dump is coming soon?
Share your views and ideas in the comment section.
If you like this idea then do support it with like and follow.
Thank You!

TOTAL CRYPTO MARKET CAPITALIZATIONCRYPTOCAP:TOTAL
We can see that the TOTAL MARKET CAP is about to botom out at 1.7-1.6T$ range where BITCOIN is going to be 38-39.000$ range. We can see some kind of retracement and consolidation in this range and after that we expect a good pump to 2.3-2.5T$ range which is going to serve as a great resistamce level on which BITCOIN gonna be 50-53.000$. After that we expect great dump in the market to 1.2-1.3T$ level with 25-28.000$ BITCOIN

TOTAL MARKET CAP 1DAY UPDATE BY CRYPTOSANDERSHello Folks, Wellcome to our TOTAL MARKET CAP update,
I have tried my best to bring the best possible outcome in this chart.
as we said in our last update the market is making Cup and handle patterns, In the current scenario market is making the double bottom pattern so TOTAL MARKET CAP can bounce from the hare 1.505T - 1.627T is working as support and 1.811T - 2.079T is working as resistance.
If TOTAL MARKET CAP bounces by touching the red zone then we can say that TOTAL MARKET CAP will be bullish towards 2.403t.
Sorry for my English it is not my native language.
Do hit the like button if you like it and share your charts in the comments section.
Thank you...

#TOTAL closed above this EMA! Bullish Rally ahead? Total mcap broke out on March 22nd, 2022, and is currently retesting the resistance turned support trendline.
As per this chart TOTAL, MCAP is likely to rally from here.
As per fractals, 200D EMA has been an important indicator for short bull rallies throughout the market.
The index closed right above the EMA.
There's a lot of FUD in the market which logically shows signs of opportunities in the market.
$1.8 Trillion happens to be a very important support level for the index to hold on 2D and weekly charts.
Conclusion:- Total mcap has retested after the breakout and bouncing from the 200D EMA. Increases the possibility of a bullish rally for the next few weeks.
Invalidation:- Only if it breaks and closes below the Channel.
If you find this chart interesting, do hit the like button and share your views in the comment section.
Thank you
#PEACE

TOTAL (Crypto Market Cap) - Bullish Double Bottom at Support 4HRTOTAL (Crypto Market Cap) has double-bottomed above 1.8T trendline support
If support prices hold strong, an industry-wide bullish crypto rally could occur.
-Bullish Targets to the upside are 1.92T, 1.96T, 2.0T.
-Chart setup would be cancelled if the index price falls and holds below 1.79T.
Utilize stop loss, position sizing, risk management.
Note: Crypto has short-term correlations with the USA stock market & tech stocks. Support prices need to hold strong, and bullish continuation is needed to sustain a bull rally.
All content is Not financial advice. Trade at your own risk.

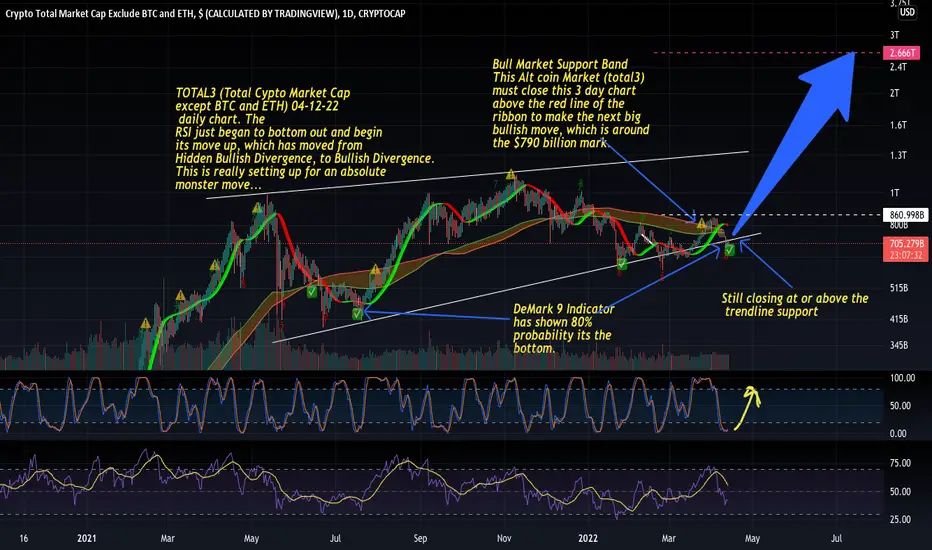
TOTAL3 daily remains at the bottom of the trendline but?TOTAL3 (Total Cypto Market Cap
except BTC and ETH) 04-12-22
daily chart. The
RSI just began to bottom out and begin
its move up, which has moved from
Hidden Bullish Divergence, to Bullish Divergence.
This is really setting up for an absolute
monster move...
TOTAL MARKET CAP 3 DAYS UPDATE Hi guys, This is CryptoMojo, One of the most active trading view authors and fastest-growing communities.
Do consider following me for the latest updates and Long /Short calls on almost every exchange.
I post short mid and long-term trade setups too.
Let’s get to the chart!
I have tried my best to bring the best possible outcome in this chart, Do not consider it as FINANCIAL ADVICE.
TOTAL UPDATE
TOTAL MCAP has reached its important support range.
We might see a few % down from here but eventually, a bounce is inevitable.
Also, most of my alt positions have been stopped with decent losses and a few with major losses.
I'll take those as a lesson.
Not rushing to get into any positions.
So basically we need to look into three assets and indexes here, BTC USDT.D and TOTAL
Better to wait for that green candle.
Let's see how the daily candle closes.
This chart is likely to help you in making better trade decisions if it did consider upvoting this chart.
Would also love to know your charts and views in the comment section.
Thank you

Cryptocurrency Market Total AnalyzeDear Friends
as last week great movement crypto index is near Very Strong Area to Jump
as Picture in Dark Gray Area And Even Better in Orange Box We Will Have A Great Trade Position
SL: below Black Box (if Broken All Crypto Market Will face Very Danger Condition)

#TOTALMCAP Retest is almost completed. Important MA Support hereTOTAL MCAP has reached its important support range.
We might see a few % down from here but eventually, a bounce is inevitable.
Also, most of my alt positions have been stopped with decent losses and a few with major losses.
I'll take those as a lesson.
Not rushing to get into any positions.
So basically we need to look into three assets and indexes here, BTC USDT.D and TOTAL
Better to wait for that green candle.
DYOR
Do hit the like button if you like these quick updates and share your views in the comment section.
Thank you
#PEACE

#TOTAL #Crypto #MarketCrypto Market Cap is ready to make another push toward wave 5
See seen good support (green box)
Expecting market to bounce and retest resistance (red box) $2.4T
This bounce will send BTC at $60,000 and Eth at $4000
