TOTAL2 finding new range 🕋Greetings,
What is total2? TOTAL2 shows total market capitalization of the top-125 cryptocurrencies, excluding Bitcoin.
Both total & total2 are extremely important tickers on TradingView to use as analysis tools and general understanding supply and demand within the markets.
Another chart I like to use it when assessing TOTAL & TOTAL2 is the 1YR HODL chart. You can see with the picture below that the HODL Wave typically declines as BTC price increases; and rises when BTC price decreases. This could be used as as an indicator to time market entry/exit.
1YR HODL WAVE
Remember, nothing is guaranteed, control the controllables.
Mogues
Totalmarketcap

Total Marketcap Excl. BitcoinIt's decision time.
Are we gonna get altseason all over again or will we fail and go back to the support line... (higher low formation possibly).

IMPORTANT TO WATCH FOR THE WHOLE CRYTPO MARKET!!!THIS IS REALLY IMPORTANT. I would like to show you this analysis of the entire crypto market. As you see on the chart, I have drawn an important zone: The Golden Harmonic Zone. This zone is based on the AB=CD patterns, as you can see there.
What is very important is that if that zone that is there, fully gets respected, then that area could be the high for the next few weeks if you expect an even longer bear market (possible crash).
If you would see this as a short setup, you would have to wait until she respects that golden zone and then go below the 1.965T mark with a daily candle and we close below it. THEN YOU REALLY HAVE TO BE CAREFUL BECAUSE GOD WHO KNOWS WHERE WE ARE BEACHING DOWN. If that happens, it is better to take short positions. Remember: buy low, sell high.
These things are the financial markets: everything could happen and can be possible!
KEEP IN MIND: THIS IS A BEARISH PERSPECTIVE/SCENARIO OF THE MARKET. NO LONG SCENARIOS HAVE BEEN COVERED IN THIS ANALYSIS!!!
𝘼 𝙡𝙞𝙠𝙚 𝙖𝙣𝙙 𝙨𝙪𝙗𝙨𝙘𝙧𝙞𝙗𝙚 𝙬𝙤𝙪𝙡𝙙 𝙗𝙚 𝙖𝙥𝙥𝙧𝙚𝙘𝙞𝙖𝙩𝙚𝙙!
Thank you and have a good one

TOTAL2 MARKETCAP - ALTCOINPARTY The Total Altcoin marketcap - Bitcoin has broken out and made a retest.
I don't need to tell you that we are going to have a gigia altcoinparty my friends WAGMI

TOTAL cryptocurrency market UPDATEHello everyone, if you like my idea, follow me with likes and comments, I will also try to share the best ideas with you, Always do your own research before opening positions and always put stop limit.

Crypto looks goodTotal2 broke a semi-daily downtrend.
Target is the pink rectangle. After that, wait if next downtrend is broken

TOTAL MARKET CAP SENARYOBasitleştirilmiş hali ile takip edeceğimiz senaryo. İlgili önceki analize linkten ulaşılabilir.

A clear Roadmap for crypto TOTAL market capHello my friends...
today i'm going to show you future roadmap for TOTAL chart.
as you see in chart, it broke downtrend and has been supported by our curve trend. now it has to hold triangle until breaks daily bear base and get full bullish. now it is fighting with Ichimoku leading span B and Ema200.

TOTAL Massive bullish wedge breakoutTOTAL has broken out of a contracting bullish wedge maintaining bullish market structure on the weekly HTF.
Price action has put in a new HH on the 3d chart with bullish divergences on the RSI having taken support on the MA and breaking out of downtrend on RSI and MACD showing signs of bullish momentum coming back into the market. MACD converging and showing an upcoming crossover.
Price has corrected into a weekly demand zone where its rejected the zone with buyer intension before creating bullish market structure and reversing.
Inline with USDT.D and USDC.D, the charts are looking great for a reversal here for the full market.

TOTAL2 Massive contracting wedge breakoutTOTAL2 has broken out of a contracting bullish wedge maintaining bullish market structure on the weekly HTF.
Price action has put in a new HH on the 3d chart with bullish divergences on the RSI and MACD showing signs of bullish momentum coming back into the market. MACD converging and showing an upcoming crossover.
Price has corrected into a weekly demand zone where its rejected the zone with buyer intension before creating bullish market structure and reversing.
Inline with USDT.D and USDC.D, the charts are looking great for a reversal here for the full market.

Crypto total marketcaplike you can see we have abroken downtrend line and now the market has the potential for raising up.

TOTAL MARKET CAP DAILY UPDATEHi guys, This is CryptoMojo, One of the most active trading view authors and fastest-growing communities.
Do consider following me for the latest updates and Long /Short calls on almost every exchange.
I post short mid and long-term trade setups too.
Let’s get to the chart!
I have tried my best to bring the best possible outcome in this chart, Do not consider it is financial advice.
TOTAL MARKET CAP breakout this symmetrical triangle and it just ounce from 50ma support we are expecting a bounce from here up to 2.473T.
Let's how the daily candle closes.
This chart is likely to help you in making better trade decisions, if it did do consider upvoting this chart.
Would also love to know your charts and views in the comment section.
Thank you

Total market capHello traders!
This is the total market cap.
Based on price action is this chart in consolidation. The price (total money in crypto) break bearish trendline and is growing.
Many investors stoped sellig.
In bullish scenario should the total cap go up to 2,08T and maybe more to 2,43.
Is important to monitoring these levels, bcs from this levels could come a rejection and market will go back to bearmarket.

#TOTAL MARKETCAP Brokeout.. Market about to explode?Welcome to this quick update, everyone.
The total market cap broke out of the falling wedge channel.
Every altcoin I bought when the total was on support is 20% to 30% up already.
The chart shows the possibility of a 100% rally in the market pushing the total market cap to almost $3.5 trillion.
We can also expect a big rally around the altcoin space and BTC as well.
This chart is giving us hints that BTC can break the $46k and eventually $53k resistance in the next few weeks opening the door to the possibility of a new ATH.
Will that happen? I don't know. Time will tell.
The index is trading above both the red and the blue MA as of now which shows the signs of reversal.
It was almost 50 days of accumulation at lower levels.
What we can see now is a beautiful retest.
A green weekly close confirms this scenario.
INVALIDATION:- Losing the lower trendline support and both the MAs daily will invalidate this chart.
What do you think of this chart? Let me know in the comments section
DO hit the like button if you like my work.
Thank you
#PEACE


Crypto TotalMarket Cap 1DThe total capitalization of cryptocurrencies is $1,830T.
There is a squeeze in the triangle going on.
While I don't pay much attention to the indicators, in combination with other factors it looks beautiful.

Total Crypto Market Cap in depth analysis before $1 TRILLIONLast year Crypto reached $3.00 Trillion milestone. Today 20 March total valuation is close to $1.83 Trillions and it bouncing around $1.67 - $1.93 during last months since beginning of the year.
If you like my graphics, please use Like button 💙💛
Check out the pics below to see why I consider market crash for this year:
1. 2018 - 2019 structure just repeating itself today:
Price just lining with rising support (dashed line) before the breakout and creating lower highs and higher lows.
2. SP500 correlation quite similar today, price had break down to support zones in 2018 - 2019 years, price stuck in sideways (dashed-flag) before another breakout:
In 2022 it is a different picture and price sharply going down, creating some kind of wedge look, and now back up to Resistance zone of $4560 where it can reverse again if there is another fears on the market come up during April-May period.
In case of reversal from resistance, I think SP500 can finish correction near support at $3900-ish zone, which mean another -19% crash for US stock market, at this point investors can drag down risky assets easily and Crypto will be highly volatile during this event, so shakedown to $1.00 Trillion or lower is quite possible event in our future.
Thanks for your attention
Stay safe and pray for Ukraine 🇺🇦

TOTAL 3 STILL INTACT AND LOOKING GREATTOTAL3 (Total Cypto Market Cap
except BTC and ETH) 03-19-22
3 day chart. The
RSI just began to bottom out and begin
its move up, which has moved from
Hidden Bullish Divergence, to Bullish Divergence.
This is really setting up for an absolute
monster move...Also the 3 day is continuing to close at or above the trendline support.

Return of bull market ?Since early November market was in deep correction (Almost 130 days of corrections )
According to the chart (total market cap )
we may see the next bullrun soon (end of march and April )
Be sure that you don’t forget risk managements

Total in the endChart of Totall crypto market cap is in the end of trend line and threeangel pattern

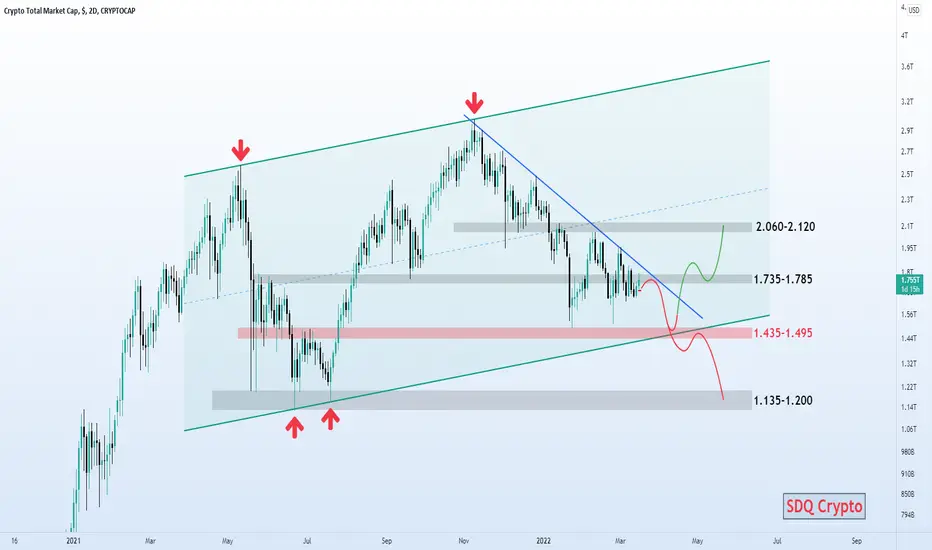
TOTAL market cap TA: 22.3.16There are two scenarios for Total Market Cup.
Before any explanation, I believe that the floor of the ascending channel is very likely to be touched.
In the first scenario, there is a possibility of a downward movement and the bottom of the channel in the range of 1.435-1.495, and if the market supports, it can enter a short-term uptrend, in which Bitcoin can grow up to the range of 52,000. .
In the second scenario, political and economic events may occur in such a way that there is no support at the bottom of the bullish channel and the market enters a downward phase with a slow trend.
⚠️ This Analysis will be updated ...
👤 Sadegh Ahmadi: @SDQ_Crypto
📅 16.Mar.22
⚠️(DYOR)
❤️ If you apperciate my work , Please LIKE and COMMENT , It Keeps me motivated to do better❤️
Bitcoin vs. FOMC: what can we expect?In this video we go over the trend of Bitcoin since we topped out at 69K and what we can expect for the coming weeks. With the Federal Reserve announcing their latest numbers on inflation, the US economy and especially (!) their new interest rate and their pace of tapering - we can expect high volatility hitting the markets this week!
I will go into recent price action, what to look out for and how to manage your risk... If you have any questions or are interested see analysis on a certain coin, let me know in the comments and I will see if I can find the time to answer some of those questions. Good luck and trade safe!

TOTAL M.CAP SOON READY TO BOUNCE! MASSIVE HIDDEN BULLISH DIV. !!Hello everyone, if you like the idea, do not forget to support with a like and follow.
Welcome to this Total market cap update. Total M.cap is moving inside a channel. Looks like soon we reached the bottom and the market will start pumping.
Also, we have seen a hidden bullish divergence in the weekly time frame. That's a really massive bullish signal.
Although, we might see the last drop or some wicks below so do not get trapped. Hold your BTC and also accumulate some good Altcoins on spot.
Invalidation level:- If Total M.cap breaks below the channel then this chart becomes invalid.
If you like this idea then do show your support and hit the like button.
Also, share your views in the comment section.
Thank You!
