TQQQ

NASDAQ - Bearish or Bullish? As you probably are aware, 10 year yields are have been increasing for the past week or so as the fear of raising interest rates increases. In short, yields go up with interest rates as bond prices decrease. When rates are projected to go up - as markets are a forward looking indicator - stock prices will decline as investors are pricing in a higher cost of capital for companies across the board. The companies that are impacted the most are growth stocks such as the ones listed in the Russell 2000 and NASDAQ 100. These companies get hit harder by decreasing interest rates because they are borrowing at a higher rate than value companies such as Walmart or United Parcel Services.
On the 4 hour NASDAQ futures chart, price action has held the 180 day EMA as well as the green uptrend line very strongly since the COVID - 19 crash. There have been two times since December 8th where the NASDAQ futures price action has broken below 180 EMA. In both cases, the NASDAQ failed to turn bearish shortly reversing and turning higher. Obviously, this time it's different for the reason that I mentioned above - interest rates.
On the 4 hour chart, NASDAQ Futures has sold off around 9% over the past week - flirting with corrective territory. Previously, NASDAQ Futures sold off close to 12,671.25 before appearing to have turned bullish prior to getting rejected by the 180 day EMA. After the 180 EMA rejection, NASDAQ Futures touched 12,671.25 and appears to making a break to 13,130.50. I am currently holding TQQQ (ProShares UltraPro QQQ) which is a 3x leveraged ETF on QQQ. At the time of writing this, I am currently down on my position with plans to add to my position if NASDAQ Futures can break above and hold the green uptrend line that I have drawn. As of right now, the key level that I am watching is 13,130.50 with hopes that the NASDAQ Futures can break above the 180 EMA (Blue Line) with volume. In my personal opinion, I would turn more bullish on the NASDAQ and even more bullish on TQQQ if the NASDAQ Futures can hold the 180 EMA (Blue Line) with the 20 EMA (White Line) and 50 EMA (Orange Line) crossing over the 180 EMA with volume.


02/26 QQQ / TQQQ Bounce -RSI don't lieYou can see from the Daily chart going back to last Feb 2020 that all the Highs and Lows have been supported exactly when they touched RSI channel. To me this is buy-time but please do your own research. This is for my own personal trading. Covered my shorts yesteray and switched to long until the chart tells me otherwise. Comments welcome.

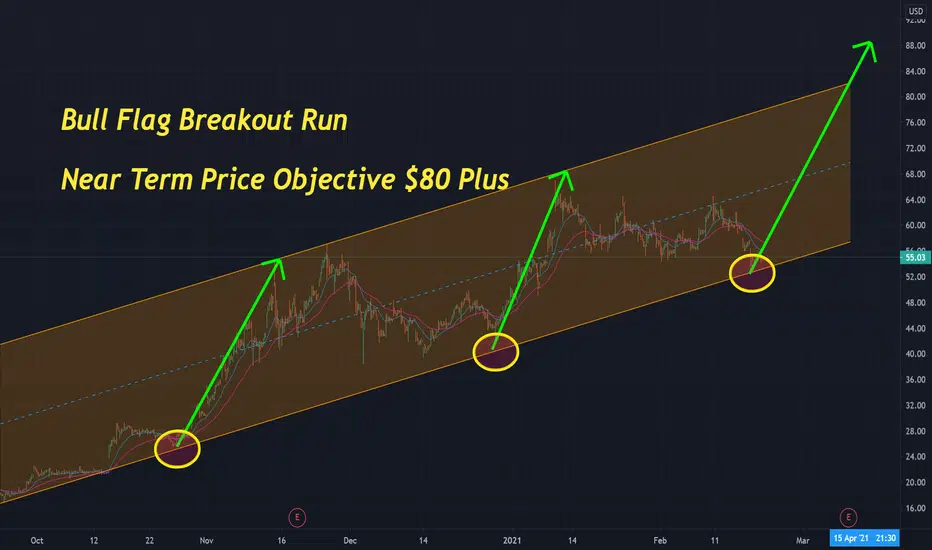
TQQQ - Formed a double bottom!After following successfully the pattern that we shared on FEB 7, TQQQ dropped to the prices that we expected it to be.
-With currently standing at a double bottom, a drop that came with a bull flag formation, we see this as a good price to enter
for mid and long-term investors.
-For short-term investors we suggest to wait for a trend reversal and then hop on the board!

$TQQQ $87 A Healthy CorrectionThe market has been a bloodbath the last 4 trading days. We saw share price across the board easily correcting 5%, 10%, 12%, and even 15% each day.
However, I believe that the correction is not over yet. We will likely re-test the support of the bullish channel at around $84.32 to $87.27. This is a very healthy correction that is long overdue. Use this opportunity to load up on shares of companies that you believe in by buying the dip because fundamentally, there is nothing wrong with a lot of the companies that are experiencing the dip.
My target is $87.27. Please set SL based on your own risk tolerance.
This is not investment advice so please do your own due diligence!
Support this idea with likes and share your thoughts below.

$TQQQ Trade Review +9.75%After smashing through our $87.27 price target, $TQQQ rejected violently back to the $96 level. This could be a sign that the worse of the correction could be over for the time being. However, I still wouldn't be too optimistic about it yet as we could still see a second and third re-test of the bullish channel's support level. As such, keep the movement of $TQQQ under your radar as you look for trade opportunities in the market as it can help you better time your entries.
This is not investment advice so please do your own due diligence!
Support this idea with likes and share your thoughts below.

First time SQQQ above linear regression channel since Nov 10thJust an interesting observation. SQQQ has been in a very tight linear regression channel sine November. Today was the first time that it made a clear close above this channel. Could just be a good opportunity to buy NDX or it could be a more bearish sign for the NDX.

TQQQ next target 121. RSI and price support achieved. Those who have followed my last posts on shorting hopefully have made some $$. We have had 4 great swing days down. Tomorrow let's swing our partner back up after that 4-day dip.
We should bounce tomorrow and start climbing to achieve our next high around 121 to complete wave 5. Divergence on price and rsi with charts lining up perfectly to support our next high. Catalyst will most likely be approval of Government stimulus or decrease of long-term Treasury yields that will give it enough of a push to the next high around 121 before plunging to new lows. This could be a slow up and down climb that could take the majority of the year before we crash!!!
This is NOT investment advice. Please do your own due diligence!! Questions or comments welcome.


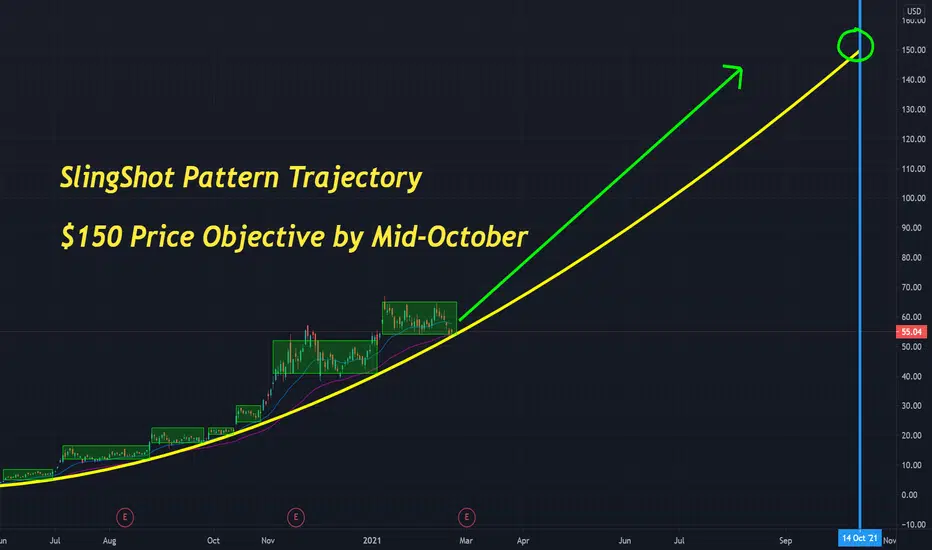
$NIO - $150 Target with SLINGSHOT trajectory Price Objective of $150 by Mid-October with SlingShot Trajectory
$TSLA - $2,100 Target with SLINGSHOT trajectoryLooking at by September, my target is upwards of $2,000

LOADING UP ON TNA TNA which is the Direxion Daily S&P Small Cap 3x leveraged is an ETF that I just came across. I usually trade TQQQ and SPXL while carrying a small position overnight in order to mitigate my risk from daily rebalancing of the leverage ETFs. TNA has run up under 980% since the COVID - 19 sell off and is approximately 40% above its pre - pandemic high. I have heard that small cap stocks will lead the charge up or down before there's a market turn in the S&P 500.
I'm looking at two entry points for this ETF. My first entry point will be at $89.92 and my second position will at $71.32. Due to TNA being a leveraged ETF the goal is to take a small position relative to my account and potential day trade the TZA (the inverse) or TNA with a larger position. I am very bullish on the market and I am loving the pullback that we are experiencing. Based on past analysis, TNA hit a resistance and then pulled back towards a support at $71.32 before breaking through its resistance - and now support - at $89.92 creating a new resistance. The sell off from the resistance at $104.14 looks healthy but I am looking for a bounce off of $89.92 here. TNA is holding its 15 and 50 day EMA strongly after breaking below its 5 day EMA. I will cut my position and turn bearish on TNA if we break below the 50 day EMA. This is the first post that I have made and I am looking to create more whether my analysis is correct or wrong. Thank you in advance for any feedback that readers provide me with as I am looking to do this full time!

TQQQ Next stop 95! Charts don't lie!!Some great 5% shorts the last 2 days. Rinse and repeat. Tomorrow we are looking for it to touch at least 100 maybe 95. The big guys that move the market are slowly bringing this back down to reality. You can see the green down candles, the last two days. Definitely a pullback, but could be more.
I marked two key areas on the chart that will likely be hit tomorrow (price point and RSI).
Charts don't lie, so do not be fooled by the big boys manipulating your thoughts through the media and forums. Be careful what you read. There is most likely a motive. This year is a perfect example. Try learning before paying for a service. To win you have to learn and be disciplined.
Please do your own due diligence as this short is for my current situation. Question or comments are welcome.
Trade to Win!! Protect your profits!! Hard work = Good Luck

TQQQ if you don't short you might be in for an atomic Wedgie!!!Since Sept TQQQ looks like it's formed mini Wedge patterns inside possible Wedge ready to Form. The downside is calling to complete this atomic Wedgie Sandwich!!! Don't be tricked by the long play or the atomic wedgie will hurt!! This is only an incredible idea so please do your own due diligence! Comments welcome!

Listen to the TQQQ Megaphone "SHORT ME"Looking at the TQQQ hourly chart, you will notice that the megaphone is showing reward to the downside around 56. The upside is limited to about 114 area. What is the logical play? Comments?
Also the Yearly RSI is touching 80. What happened last time yearly RSI touched 80? Feb 20, 2020, Sept 2020 Kaboom!
Please do your own due diligence these are just fantastic recommendations!


$TSLA - Very Bullish BUY Point for $1,142 Short Term Target Fib Setting up nicely in consolidation for a upward run.

TQQQ Divided by the M1 Money SupplyIt seems like the government stimulus bill news is messing up my shorting schemes in the short term.
It's amazing how the Nasdaq can continue to approach the Singularity like this. You'd think we'd run out of money to dump into it eventually.
I divided TQQQ by the M1 money supply and it seems like there might be some sort of ceiling.
Or it could just go to infinity, I guess.

Best SPY chart you will seeeSelf explanatory, it has been trending up with almost every dip bought. This is repeat of almost every other dip. Now we are going to anew wave up.
I anticipate it touching that high line bar around 395-400 range. Long here for a nice scalp up. Holding after market.

NASDAQ Elliot Wave Count - Finally time to short?Okay, I have been calling a top for the last week or so. I posted an idea earlier about a double top in the NDX with lots of charts. Here is a more detailed version of my Elliot Wave analysis and why I think this is the end for the NASDAQ. Sure I could be wrong and feel free to poke holes in it. It is the best guess I have right now and tomorrow something could completely alter this idea, because those pesky hedge funds like to screw us over in the after hour sessions.
I use a standard set of fib levels for wave, which is 1.0, 1.618, and 2.0 (waves 1, 3, 5). I make adjustments to wave 5 based on wave 3 ending.
Here is the 1M. Note that Wave 4 typically retraces less than 0.382, which is exactly true for the 2020 March low. If wave 3 ended around 2.0, then wave 5 should be around (2.0/1.618)*2.0=2.47. NDX is above that at 2.854. Also note the almost vertical slope since last year.
Lets move into the 1W. You can see the NDX starting to roll over in the last several candles.
Now the all important 1D. Here I use my handy-dandy cRSI+Wave indicator to help determine the waves. I see nice 3 step up to the June peak. Note how the cRSI shows a "strong" wave followed by an "A", a "B" (in this case the indicator shows a "weak" peak), and followed by a "C" (here we see another "A"). This is typical for very strong rallies. One day I will get around to fixing this in the indicator. When you pick a Wave 1, you should see a nice alignment with a 0.618 fib and another clear peak, which we have on April 17th. Should also find a nice peak around 0.382 or 0.236, which we have. I am 100% confident that June 10th is the end of Wave 1.
On the 1D chart I exclude the wicks and shadows for aligning the fib levels. Now we need to look for a Wave 3 around the 1.618 level. Sure enough the big rally in August gives us a nice candle wick to 1.786, which is normal for a very bullish rally. I also see a really nice peak at the 1.382 fib level. The alignment to fib levels is looking spot on to me. We get a nice correction following this rally, which is another good indicator that a major wave was just finished.
Now comes Wave 5 and is showing a clear impulse pattern to give us an ending diagonal pattern. The rebound in Oct serves as sub-wave 1. Lining up the fib levels like before (note the nice alignment to the 0.618 fib) we see a nice wave 3 ending around Jan 4th. This time we see a perfect ABC pattern in the cRSI+Wave indicator (NDX not quite as bullish as before). You can also see the tell tale signs of a rising wedge pattern that defines the ending diagonal. Since we tagged 1.618 perfectly, we should be looking for wave 5 to end around 2.0, and I see a 2.146 (green fib). Looking back at the fib levels off the March low (black) we see the NDX touching the 2.146 level also. That is two wave counts converging in the exact same location and both at 2.146. In addition, to me it looks like a double-top pattern forming after last weak's sell off.
What's more, the NDX is also just touching a 2.854 fib level based on the dot com as wave 1. You can also see that major orange resistance line I drew off the dot com bubble high. That is an amazing amount of lines all meeting in the same location. Maybe the NDX will see that as a challenge and break it just to screw us all one more time. I think more than likely it will churn around for a few more days trying to break through and eventually make a sizable pull back to gain more support before trying again.
Hope it helps and good luck.


