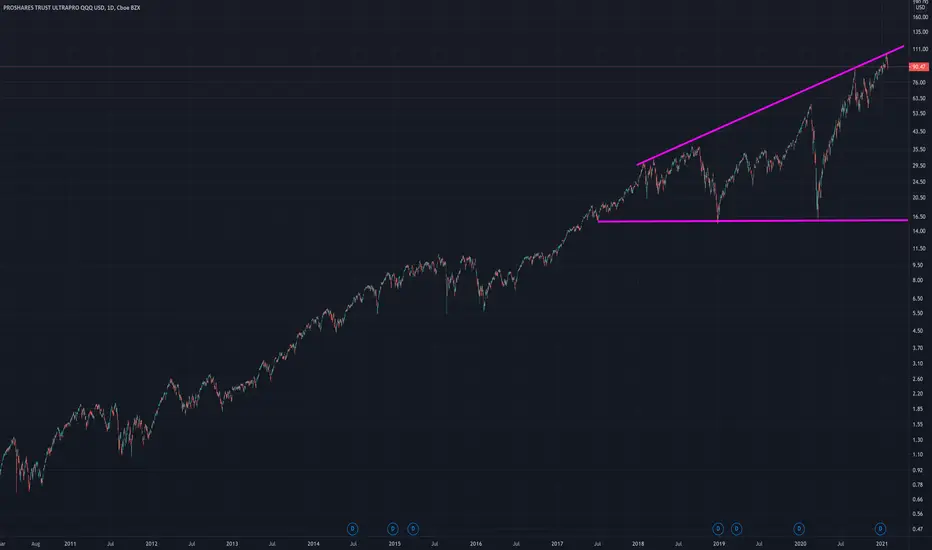
TQQQ

TQQQ - Ascending Broadening Right-Angled formation TQQQ - Ascending Broadening Right-Angled formation .
thepatternsite.com
Breakout is upwards in 55% of times.

Nasdaq 100- Ascendening Broadening Wedge Nasdaq 100- Ascendening Broadening Wedge (ABW)
Will remain in the ABW, until it doesn't.

Big Tech in for a Big Drop?Here's TQQQ divided by the M1 money supply.
Here's QQQ divided by the M1 money supply.
By dividing by M1, we are able to see the supply adjusted value of the share. I chose to use TQQQ instead of QQQ for a short because it looked pretty cool making a triple top when divided by M1. Haha.

TQQQ to 60s-70s - BearishWe all know the market is overdue for a correction. Many market makers estimate an approximately 10% sell off - corresponding to a +/- 30% sell off in TQQQ.
VXN and VIXY are setting up for a potential volatility breakout +/- Feb 02. Potential catalyst could be an underwhelming NFP? Rising corporate bond yields may also put pressure on valuations.


More room to run in TQQQBullish heiken ashi close for entry signal
I got about 2/3 of the position I wanted to and it continued to run after hours.
Sell signal is first red heiken ashi or we will sell 10% of position at 190.52(+4% gain). Additional take profits at +6%, +8%, +10% and +12% if we get there.
Tomorrow, if at any time we go below today's close (183.19) but stay in a bullish daily heiken ashi, I will add more.

NASDAQ Dot Com Bubble 2.0 is almost complete (mid-January)!!!The chart says it all. There is no stopping tech until it reaches the top of that channel some where in mid-January (Jan 19 on current slope). We all know this market is built on fairy tails and unicorn poop. Will the markets stay irrational and take us even higher? Will we finally see the return of common sense and fundamentals? I have been saying this market is a bubble for months and it still went up, so why stop now. I would expect a serious pullback at that trend line either way! If the markets wants to go above it is going to have to make it more attractive, which it will do with a nice correction and consolidation.
RSI on the 1M
Support trend line to the top
Several key trend lines

Sharp 🪒 drop 📉 on NASDAQ: How i will play today sessionHi guys sharing just my thoughs of my today market gameplan.
Today wil be crucial Non Farm Payrolls and Unemployment Rate numbers in conjuction with wednesdays sharp decline in ADP Non-Farm Employment Change.
The long term unemployed rise sharply:
static.seekingalpha.com
Total payroll growth accelerated sharply immediately after the lockdowns were lifted, but has since slowed. This makes tomorrow's jobs report that much more important. A decrease would be very bad as it would confirm the drop in the ADP report from wednesdays, while also indicating an abrupt change in the underlying economy.
static.seekingalpha.com
So this could be some kind of catalyst of move today and next week.

🔑 Levels on NQ1! and QQQ: Nasdaq daily play UPDATE 📉Hi mates! i just updated my last Nasdaq gameplay plan so i sharing with you. Happy trading!
If you like the idea, do not forget to support with a 👍 like and follow.
Leave a comment that is helpful or encouraging. Let's master the markets together.

NASDAQ Wave Count - Just completed Wave 5?See notes on chart? We could have hit wave 5 at the end of 2020. Will we see a run to 2.618 or Wave A???
Some important regression channels

NDX DOES IT PIVOT HERE?I'm observing some interesting trends on this NDX renko chart. Take a look at my lower wavetrend indicator and the simple, yet remarkable, patterns that exist. This chart goes back 10 years but I really want you to focus on the giant ascending broadening wedge (aka megaphone) from 2018 until now. I see this area as a potential pivot but we're just as likely to melt-up, even if we do have another correction. I'd love to see a #6 of this megaphone but I'm not certain of that. If the NDX eventually breaks above this pattern then it will most likely soar similarly to 1999-2002. This seems absurd but it's not unlikely considering the ingredients baked into our current monetary cake. I will consider a long hedge (2023+) calls in QQQ if we can have another nice correction but I don't like the risk/reward of going long here. Let's see if we can get another nice pull back.

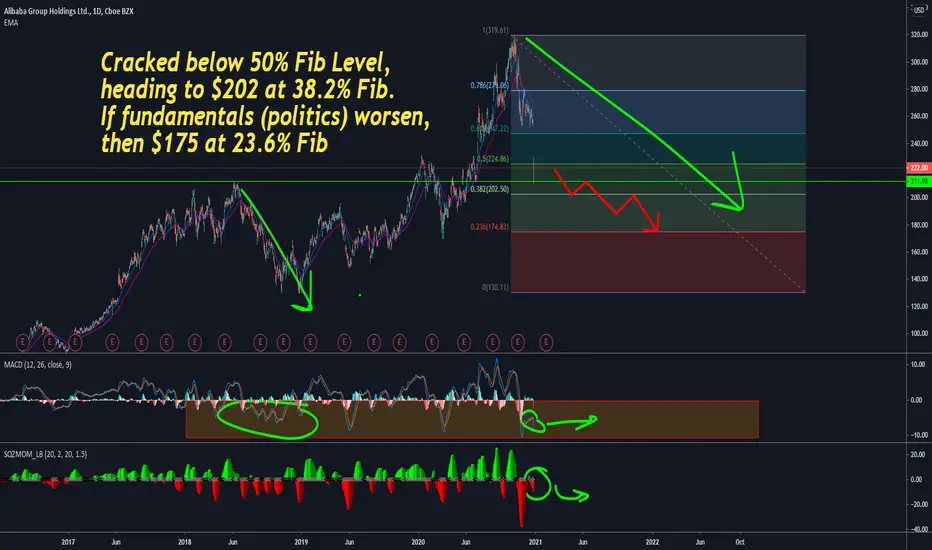
$BABA - Still Bearsih on technicals $202 potential targetBroke key fib levels. Heading lower on tehcnicals.

TQQQ long swing trade entry off- heiken ashi strategyShortly after bouncing off the 21 day moving average, we got a buy signal.
Closing price was 164.74
1st Take Profit (10% of position @ 4%) = $171.33
2nd Take Profit (10% of position @ 8%) = $177.92
Exiting on 1st red heiken ashi or 9th green. No stop loss, chart shows 12.3%, this is max single trade drawdown of this strategy from 2010-2020, in order to show max risk.

NASDAQ still above supportS&P took a big hit overnight, but NASDAQ still above support. Not sure if it will hold support all day or fold.

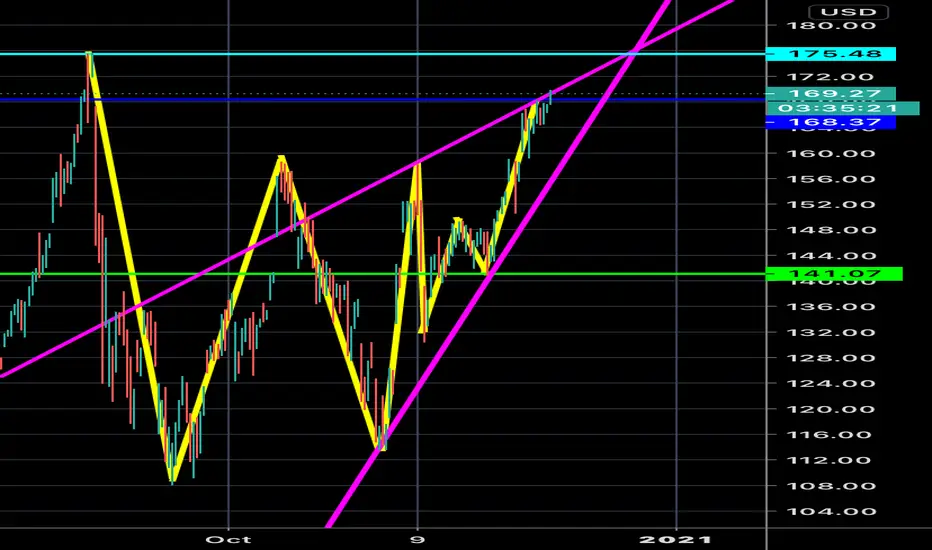
$PLTR - Still Bearish - $16-19 Price Target*Broked the symmetrical triangle. Heading to lower buy zones

End of year Big ShortTQQQ is ending a corrective structure. The High is at hand, get ready for the big short.

Let's try again! Will Tech Join the Reopening Trade? ContinuedI am reposting my trade from November 24th that is still active.
So far we have hit our 12% price target twice, and we are awaiting the ninth bullish heiken ashi candle in a row on Monday, on which we will take 50% of the position off no matter what.

TQQQ Life Has Been a Logarithmic LineIt seems like quite a coincidence that NASDAQ:TQQQ has been so linear on a logarithmic scale. You'd expect more randomness.
Why is it so straight?
Is this a result of some fundamental underlying economic laws?
Or is the Federal Reverse using its powers to maintain a very specific level of long term economic growth?
