TQQQ - Short Put 17 Jul 20 55Opened yesterday for a credit of $3.22 per contract. Cash Secured.
With mostly cash in my portfolio, I think it's a good time to use the wheel strategy:
1. If TQQQ ends up above 55 at time of expiration - collect premium
2. If put in-the-money: start long on TQQQ
2.a. sell covered call on TQQQ
TQQQ

TQQQ Target:[$100.00] Target Date:[07/01/2020] ROI:[38%]NASDAQ-100 INDEX
The NASDAQ-100 Index includes 100 of the largest domestic and international non-financial companies listed on The NASDAQ Stock Market based on market capitalization. The Index reflects companies across major industry groups including computer hardware and software, telecommunications, retail/wholesale trade and biotechnology.
Last week, the Invesco QQQ Trust (QQQ) crossed the $100 billion in assets mark, joining three S&P 500-based ETFs and a total stock market offering from Vanguard.
CFRA rates QQQ as a five-star diversified U.S. equity fund, believing it has a high probability of outperforming in the next nine months due to its low costs and high reward potential, despite slightly elevated risks.
Exposure to the biotech sector which is poised to profit from therapeutics to treat the coronavirus and future pandemics.
Analyst Ratings
Firm Name____________Rating
FactSet ________________A
Ned Davis Research _____BUY
XTF Inc. ___________10 out of 10
Morningstar, Inc.* ___ 5 out of 5
Zacks Research ______Strong Buy
Top Holdings
MSFT
Microsoft Corp
11.92%
AAPL
Apple Inc
11.19%
INTC
Intel Corp
2.97%
CSCO
Cisco Systems Inc
2.11%
NVDA
Nvidia Corp
2.04%
ADBE
Adobe Inc
1.95%
PYPL
Paypal Holdings Inc
1.42%
AVGO
Broadcom Inc
1.19%
TXN
Texas Instruments Inc
1.18%
QCOM
Qualcomm Inc
0.98%


AAPL Looks like a short here. Be CautionsI have purchased a $315 put option.
Goodluck - Trade at your own risk.

Close out TQQQ positionsIt's a good time to take some profits and scale out of TQQQ today.
I'll post when to start buying SQQQ.


Nasdaq100 daily- Reaches 61.8% Fib retracement and Bollinger midNasdaq100 daily- Reaches 61.8% Fib retracement and Bollinger 20 SMA midline support (circled).


OPENING: TQQQ JUNE 19TH 35 SHORT PUT (LATE POST)With rank/implied at 74/124 and the at-the-money short straddle paying a whopping 33% of the value of the stock price in the June expiry (57 days until expiry), sold the 84% probability of profit strike for a 2.06/contract credit late in the session.
Break even of 32.94.

Returning to SupportI believe that Nasdaq will return to the long support, which is the 180 EMA on the monthly chart. Looks like this might have a long way to fall.

NASDAQ is at recession resistence lineSo back in 2018 when a smaller correction happened, the 180 EMA acted as resistance for many legs down. We are at that resistance right now and I'm expecting the next leg down very shortly...
#sqqq #tqqq #qqq #spy

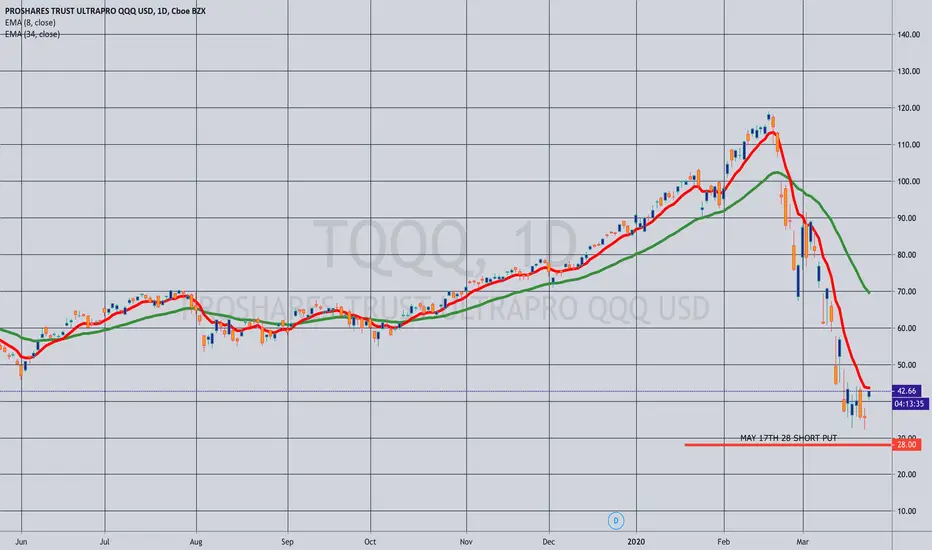
OPENING: TQQQ MAY 17TH 28 SHORT PUT... for 2.65/contract.
Notes: High rank/implied. I'm generally not a big fan of leveraged, so am going small here, 16 delta. Break even at 25.35 if assigned.
THE WEEK AHEAD: CCL, XLU, XLE, SMH, TQQQ, /CLEARNINGS:
CCL (67/284) (What?! 284% 30-day) announces earnings this coming week. Unless you've been under a rock the past several weeks, you'll know how hard it's been hammered with COVID-19 and can easily anticipate further hammering, both with earnings, forward guidance, and the potential reduction of its 2.00 annual dividend (12.86% yield as of Friday close). They have yet to announce a dividend cut, but cruise lines are also not part of the $2 trillion bailout package, so there is probably more pain ahead in the short to medium term, and a potential suspension or reduction the dividend payment will only add fuel to the fire. For those looking to bet on an eventual recovery, however, the May 17th 10 short put is paying 2.30 at the mid price as of Friday close with a resulting cost basis of 7.70 if assigned, a 53% discount over where the stock is currently trading.
EXCHANGE-TRADED FUNDS ORDERED BY RANK
XLU (67/57)
XLE (67/99)
SMH (67/72)
USO (67/161)
EWW (59/86)
EWZ (59/95)
GDXJ (59/1O2)
GLD (58/35)
XOP (49/115)
SLV (48/63)
FXI (44/49)
GDX (41/78)
TLT (34/28)
BROAD MARKET EXCHANGE-TRADED FUNDS ORDERED BY RANK
TQQQ (80/175)
DIA (78/76)
IWM (76/72)
SPY (71/65)
QQQ (71/55)
EEM (73/61)
EFA (53/50)
FUTURES ORDERED BY RANK
/NQ (74/72)
/ES (71/66)
/CL (58/34)
/GC (58/34)
/SI (48/60)
/ZS (45/23)
/ZW (36/36)
/ZC (22/34)
VIX/VIX DERIVATIVES
VIX finished the week at 65.54 with the /VX futures term structure in backwardation.
MUSINGS
On Margin:
Truth be told, I'm not doing a ton here besides either (a) waiting for assignment; or (b) making adjustments where doing so doesn't subject me to "call side whip" such that my put side headaches become call-side ones. And although the high volatility environment is great for premium selling, it does have one minor, pesky side effect that I may have mentioned before -- options liquidity hasn't been all that great, even in what are usually the most liquid underlyings. Additionally, I generally like to be managing the smallest number of crap piles at once as possible, and this closely correlated sell-off has resulted in a few that I'd like to clean up before potentially inheriting more. To a certain extent, one has to be fine with that; it is, after all, the challenging trades that make your life interesting.
The IRA:
As usual, the IRA's a patience game. Having stuck short puts out there in things on my shopping list (HYG, XLU, IYR, and EFA), the only thing to do here is wait until expiry, at which point I'll be assigned shares or the short puts will expire worthless.
On the other end of the stick, I'm looking to dump pieces of my low-yielding TLT at or near all-time-highs and substantially up from my cost basis in those shares at or below 110, which is the last time I acquired shares. Unfortunately, I have been less than religious about keeping tracking of my cost basis of shares in the IRA, since the basic setup was that these were intended to generally be "never exit" or "never get called away" plays. However, I think U.S. treasuries have had a fairly good run, and there are probably better places to stick that capital.
The /CL Chart:
I've thrown up a monthly USOIL chart here to show how current prices in oil could be a multi-month, if not multi-year opportunity here to take a bullish assumption position in either /CL directly, USO, or one of the beaten-down oil exchange-traded fund sector exchange-traded funds (XOP, OIH, or XLE). With /CL implied/rank at 67/165, I've done some of that already with /CL out-of-the-money short puts, (See Posts Below), but this can also be done in USO more incrementally, since it's a much smaller instrument and has the added advantage of having .03 wide markets here. Alternatively, there is also the USO Zebra/Call Ratio Spread, about which I'll post separately ... .

I bearish AF with BTC and the current situationIF the current scenario exists I can see a bearish flag being formed considering the pole, we can predict BTC soon at 2900 ish range yes you heard it right I TOLD 2900ish. You might think I am crazy but unless an insane miracle I see no pump for a while , you can check my previous bear flag call history is repeating itself again. PLEASE DO follow my TWITTER and show some support guys.

𝗧𝗲𝗰𝗵 𝗨𝗽𝗱𝗮𝘁𝗲: $QQQ Daily. Bear Market Bounce Starting?Trying very hard to hold 170 to start a bounce; however, if doesn't hold can play catch up again to $DJT, $IWM, etc.

TQQQ Bear momentumBear momentum going strong.
As everywhere begins to shut down, I'm afraid we have a long way to go...
***Not a trading advise, invest at your own risk. Will not be held accountable for your actions. Consult with your financial advisor.***

TRADE IDEA: TQQQ MARCH 20TH 80 MONIED CCMetrics:
Max Profit: $239
Max Loss: $7761 (assuming underlying goes to $0)
Buying Power Effect (Cash Secured): $7761
Cost Basis In Stock/Break Even: $77.61
Delta/Theta: 15.11/4.43
Notes: High implied volatility underlying (56%). I don't play leveraged products as a general matter, but will dip at the well with a conservative setup like this that has a high probability of profit (the platform says 87%), particularly if I'm not doing a ton of other things and have the buying power to deploy. The ROC isn't great in cash secured (239/7761 = 3.1%), but will take it if I can get it over a 60 day period of time.

A good time to buy shares of TQQQHello Traders and happy new year! Its a good time to buy shares of TQQQ. We are on a uptrend and as you can see on the graph we have an approach to support trend line. So I will buy shares at open price 88.61 (pre market price) and I will risk 5% to take 10% gain.

Testing new heights - TQQQ Going to Drop from this ResistanceBased on very simple technical analysis on the weekly chart, it's looking like TQQQ is about to ricochet off the top and likely end up crashing due to decreased trading volumes in the NASDAQ. Without the volume to artificially prop up the stock prices underlying the TQQQ ETF, I'm predicting a stunning downside movement. History shows us that when this topline resistance is hit, things go down. At the minimum, I'm predicting a 15% downside movement. If this week's economic data continues to point negative, I think it'll lock into a downward cycle.
This is not trading advice, but merely an observation and prediction.

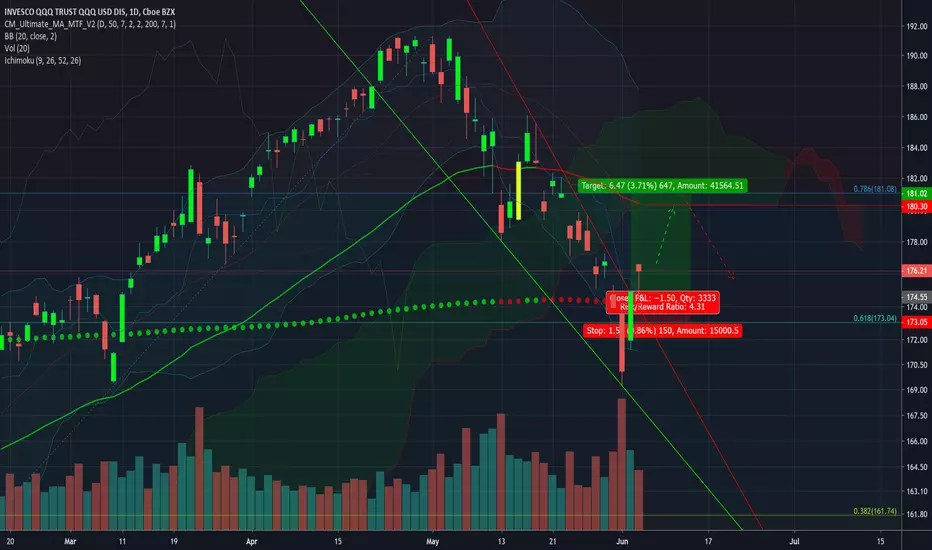
Looking to exit #NASDAQ long around cloud resistance $TQQQ $QQQThe situation with China and now Mexico tariffs will be drawn out, there may be two rate cuts but the Fed will wait for the data to support it, meantime we will see more volatility.
I may look to flip the trade if there is very clear resistance at the cloud and .786 fib.