Opening (IRA): TQQQ June 28th 53 Monied Covered Call... for a 51.52 debit.
Comments: Re-upping in the June 28th expiry with a monied covered call, as there is no July yet. Selling the -75 delta call against a one lot to emulate the delta metrics of a 25 delta short put to have built-in defense via the short call and to take advantage of call side IV skew.
Metrics:
Buying Power Effect/Break Even: 51.52
Max Profit: 1.48
ROC at Max: 2.87%
ROC at 50% Max: 1.44%
Will generally look to take profit on the entire setup at 50% max.
TQQQ

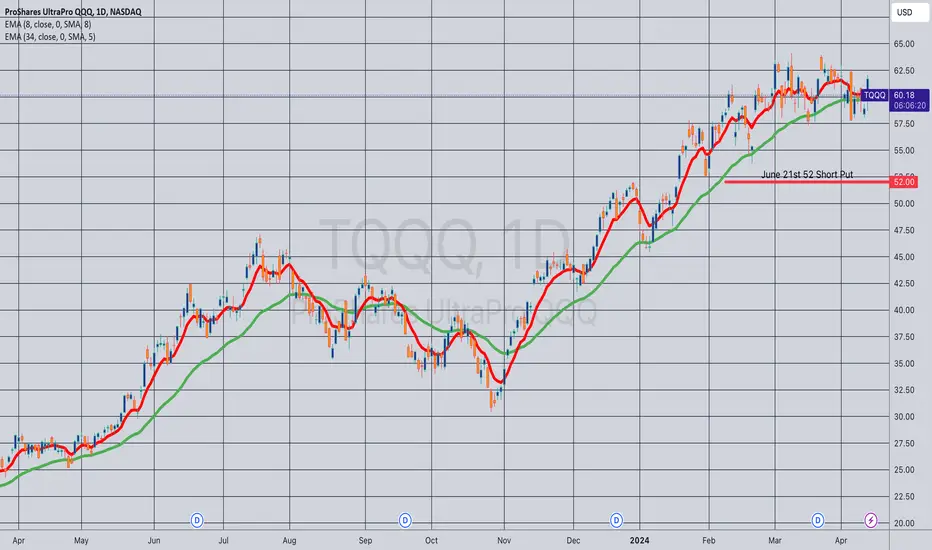
Opening (IRA): TQQQ June 21st 52 Short Put... for a 2.49 credit.
Comments: Adding to my TQQQ position on weakness ... . This is a bit longer-dated than I like to go with shorter duration premium selling, which I like to keep in that 45 DTE wheelhouse, but May has now only 35 days in it, and I like to stick to monthlies in all but the most options liquid underlyings.
Will generally look to take profit at 50% max. I'm fine with being assigned, then proceeding to sell call against if that occurs.
Metrics:
BPE/Break Even: 49.51
Max Profit: 2.49 ($249)
ROC at Max Profit: 5.03%
ROC at 50% Max: 2.51%
Delta/Theta: 24.36/3.37
Opened (IRA): TQQQ May 17th 55 Monied Covered CallBought a one lot of shares and sold an in-the-money -75 delta call to emulate a 25 delta short put to take advantage of call IV skew and to have built-in pro via the short call.
Metrics:
Break Even/Cost Basis in Shares: 52.71
Max Profit: 2.29 ($229)
ROC %-age at Max: 4.34%
ROC %-age at 50% Max: 2.17%
Will generally look to take profit at 50% max, add at intervals at a strike/cost basis better than what I currently have on should weakness present itself.

Nasdaq 100 Peak 2024 ?Will the 2021 peak happen again ?
consolidation occurs like in 2021, will history repeat itself?

$NDX in oversold territory, support levels & major moving avgThe NASDAQ:NDX , Nasdaq 100, is at a support level on the daily chart, left.
The 4Hr chart shows it is almost at the 320Moving avg, left.
Being that there's support & the intraday is at a Major Moving Avg, we'll likely get some sort of bounce around here.
The index is also oversold daily & intraday.
NASDAQ:QQQ NASDAQ:TQQQ NASDAQ:SQQQ

TQQQ Tech 3X levarged ETF LONGOn this 15 minute chart, TQQQ is in an anchored VWAP band and volume profile breakout.
Near to the end of the regular market, the RSI indicator ran from deep oversold. After hours,
NVDA reported a sizable earnings beat. The AI machine learning and backtesting indicator
forecasts and uptrend continuation. I will get call options targeting $58 for Friday's expiration.
This is a risky play, price trend could reverse and there could be no time left to recover from
that reversal. The rewards for the trade going right could easily exceed 100%.

TQQQ - Cup awaiting Handle ?TQQQ on a weekly chart in 2021 ascended into a falling wedge. As part of the falling wedge,
it started the downside initial part of a cup and handle pattern. The reversal occurred 11
months ago with the upside completion of the cup back to 57.5 In the typical cup and handle,
the handle then forms in a 50% retracement of the height of the cup. the cup height measures
44.5 over a period of about 9 months. Notably relative volumes peaked at the bottom of the
pattern. Once the retracement is complete, bullish continuation should occur to the extent of
the height of the cup above the lip. That is to say an uptrend from 57.5 adding 44.5 to get to
102 more or less. But first the retracement and reversal must occur.
Accordingly, if this is an incomplete cup and handle, it forecasts a retracement of 44.5 divided
by 2 or to about 38 as shown by the Fib retracement tool. After that price must reverse
then overcome the resistance of the lip of the cup ( 57.5) and continue to 102.
Overall, this forecasts that a bearish crash is in store for TQQQ ( as well as QQQ from which
it is leveraged). Time will tell if this pattern has given an accurate forecast. In the meanwhile,
I will watch for signs of QQQ topping out on the weekly time frame after the same signs on
lower time frames. The alternative view is that TQQQ is building an even bigger cup
right now with the lip at about 88 when the price had a high pivot down on November 22, 2021.
So, do you see a bigger or smaller cup pattern or none at all?

QQQ Is it topping before a crash or setting up a correction?QQQ is on a weekly chart. Only the pundits, soothsayers and headline readership volume seekers
know for sure. Will not the upcoming elections prop things up? Buy in March April and May
and then go away? Is this spring coming up roses or instead dandelions?

Opening (IRA): TQQQ April 19th 52 Short Put... for a 1.54 credit.
Comments: Adding a short put component to my TQQQ covered call (See Post Below) here on weakness.
Metrics:
Break Even/Buying Power Effect/Resulting Cost Basis In Stock: 50.46
Max Profit: 1.53/$153
ROC at Max: 3.03%
ROC at 50% Max: 1.52%
Will generally look to take profit on the covered call component at 50% max and the short put component at 50% max.

Opening (IRA): TQQQ April 19th 53 Monied Covered Call... for a 50.93 debit.
Comments: Selling the -75 delta strike against a one lot to emulate a 25 delta short put with built-in defense via the short call.
The call IV skew that I was looking to take advantage of before has evaporated somewhat, with the same strike short put paying about the same (1.94) as the max profit potential of this setup. Since I'm doing this in a cash secured environment, I don't get much BP relief over doing the monied versus the short put, so am really doing this setup for its "built-in defense" that I don't have to add in later, as I would should I want to defend a short put.
Will generally look to take profit on the entire setup at 50% max, look to roll out the short call at 50% max, and add at intervals, assuming I can get in at lower risk strikes.
Metrics:
Cost Basis/BPE/Break Even: 50.93
Max Profit: 2.07
ROC at Max: 4.06%
ROC at 50% Max: 2.03%

TQQQ Technical Analysis - Breakout and Key LevelsTechnical Breakout:
On November 13, 2023, NASDAQ:TQQQ experienced a significant structural shift with the breach of the $40 resistance level. The subsequent bull run in the tech sector propelled NASDAQ:TQQQ to a peak of $61.22 on February 12, 2024.
Fibonacci Retracement:
After reaching the peak of $61.22 on February 12, 2024, NASDAQ:TQQQ made an attempt to pull back, targeting the 0.618 Fibonacci level at $53.18. However, the retracement was not sustained, and NASDAQ:TQQQ returned to the previous high of $61.22 on February 23rd.
Current Situation:
As we await the market open on Monday, NASDAQ:TQQQ stands at a crucial juncture following the recent retest of $61.22.
RSI Divergence:
Since January 24th, we've observed RSI divergence, indicating a discrepancy between the price action and the strength of the trend. This could be a crucial signal, suggesting a potential shift in momentum that traders should closely monitor.
Upcoming Events :
This week brings important economic indicators:
Monday: Japan Inflation Rate
Tuesday: GfK Consumer Confidence and USA Durable Goods Orders
Wednesday: USA GDP
Thursday: USA PCE and Personal Spending
Friday: ISM Manufacturing
Market Expectations:
Anticipations are focused on the USA GDP, expected to perform worse than forecasted . This could influence market sentiment and potentially impact NASDAQ:TQQQ 's performance.
Forecast:
Given the current technical setup, RSI divergence and the upcoming economic events, there is a likelihood that NASDAQ:TQQQ could move towards the 0.5 Fibonacci level of $50.69 by Friday, March 1st. Traders should closely monitor developments and be prepared for potential volatility.
Disclaimer: This analysis is for informational purposes only and does not constitute financial advice. Traders should conduct their own research and consider risk factors before making any investment decisions.

Opening (IRA): TQQQ April 19th 50 Monied Covered Call... for a 47.75 debit.
Comments: Dabbling a smidge in the leveraged ETF due to its high IV (56.3% 30-day).
Selling the -75 delta call against a one lot to emulate a 25 delta short put, but with "built-in" defense via the short call, which can be rolled down, out, or down and out to reduce cost basis and setup break even.
As usual with the sort of thing, will look to add at intervals, assuming I can get into setups that have a cost basis lower than this starter position.
Metrics:
BPE/Break Even: 47.75/share
Max Profit: 2.25 ($2.25)
ROC %-age at Max/50% Max: 4.71%/2.36%

SPY falls into mean VWAP support for LONGSPY on the 1H chart was riding the cynamic resistance of the second upper VWAP line
in mid July but then pivoted down out of a head and shoulders at the bottom of the month
and is now bounding up and down retesting the support of the mean VWAP line.
The ADX indicator shows the flat line directional index. The ZL MACD is upgoing after a
cross of the lines at the lows. Price is impending another VWAP crossover on the
retest. I see this as an excellent base from which to take call options long targeting
$453 for both 8/18 and 9/1. Please leave a comment, will SPY turn it around here or
seek the downside?

AAPL to verse to upside trending ? LONGAAPL on the 60 minute chart is compared on the superimposed indicator on its own scale the
RSI for a similar time frame. The chart shows that AAPL has sunk to its price level in the
pre-earnings period two weeks ago. At present, price and RSI are running in parallel and
RSI is a litle higher than price while on its own scale. Price is currently near to the running
SMA 200. When I see either price or relative strenth move higher. I will be a buyer. I am looking
for some green on the relative volume indicator to tip me off. I will be watching on a lower
time frame of 15-30 minutes to get a clean entry pay off the spread and get into profits
ASAP.

i dont like this setupI don't like this setup. The recent increases we've seen are just to reach the edge of a wedge, which is the classic movement before a fall, and the wedge has a descent of 25%.
so, be careful!

Chicken or the Egg?Confirmed Cup & Handle pattern on Nasdqaq (QQQ).
The handle is gaining momentum and validating the upward trajectory. It's fascinating to note the alignment between news (fundamentals) and the established pattern (technicals). Or is it merely a perceived correlation?

IWM - Falling Trend Channel [MID-TERM]💡 Pattern: Falling Wedge
💡 RSI: 56 Neutral
💡 Risk: Low
✅ Resistance: 188
✅ Support: 170
PERFORMANCE
🟢 ST: POSITIVE
🟡 MT: HOLD
🟢 LT: POSITIVE
*ST: Short-term | MT: Mid-term | LT: Long-term
Verify it first and believe later.
WavePoint ❤️

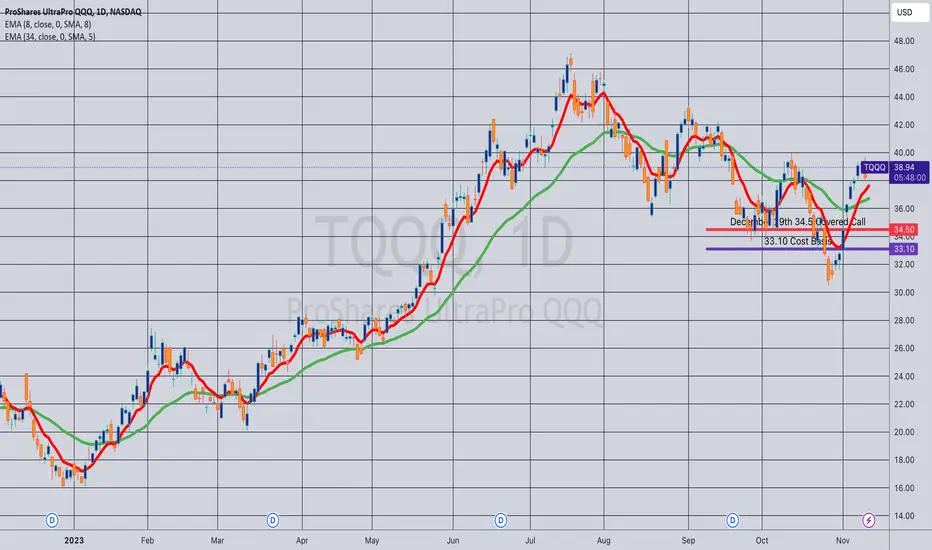
Opening (IRA): TQQQ December 29th 34.5 Covered Call... for a 33.04 debit.
Comments: Selling the monied -75 delta call against a one lot to potentially take advantage of early random call away/*assignment. 33.04 break even with a 1.46 ($146) max profit; 4.42% ROC/32.9% annualized as a function of buying power effect at max.
"Random" call away occurs when someone holding the 34.5 long call choses to exercise it before expiration, but I'll look to close at or near max (e.g., 34.45) to avoid the call away/assignment fee if I get the opportunity to do so.
On the flip side of the coin, I'll look to roll out the short call to reduce cost basis and my break even further if it chooses to crap its pants.
Opened (IRA): TQQQ December 22nd 35 Covered Call... for a 33.55 debit.
Comments: Selling the -75 delta call against ... .
Metrics:
Buying Power Effect/Share Price Break Even: 33.55
Max Profit: 1.45
ROC %-age At Max As a Function of Buying Power Effect: 4.32%
ROC %-age at 50% of Max: 2.16%
Delta/Theta: 26.44/2.98
Here's why I'm doing this instead of selling a put at the delta equivalent strike (the +25): if you look at the 25 delta put in the same expiry at the 35, it's paying around 1.27 at the mid (i.e., $127 max). The delta equivalent covered call setup has a slightly better max payout at 1.45 ($145) probably due to a couple of things: (a) IV skew (it's slightly higher on the call side than on the put); and (c) call skew. Relatedly, the short put break even is 33.73 relative the 33.55 break even of the covered call setup.
I also wanted to see what the frequency of monied covered call random call away of shares was; most literature suggests early, random assignment is somewhat rare (around 7%) but there isn't much information out there in addition to that, such as when the highest likelihood of early exercise is (it's most likely when the extrinsic value in the call is de minimus) or how deeply monied the call is (which is related to how much extrinsic is left in the long call that the other person would be exercising; deeper in-the-money options have less extrinsic in them relative to less monied options of the same duration). This could naturally give the setup a slight edge over a short put, since an early exercise by a counter-party would result in max profit without having to wait until all the extrinsic has leaked out of the monied short call.

QQQ- Rising Trend Channel [MID-TERM]💡 Pattern: Cup & Handle
💡 RSI: 55 Neutral
💡 Risk: Medium
✅ Resistance: 385
✅ Support: 344
PERFORMANCE
🌕 ST: HOLD
🟢 MT: POSITIVE
🔴 LT: NEGATIVE
*ST: Short-term | MT: Mid-term | LT: Long-term
Verify it first and believe later.
WavePoint ❤️

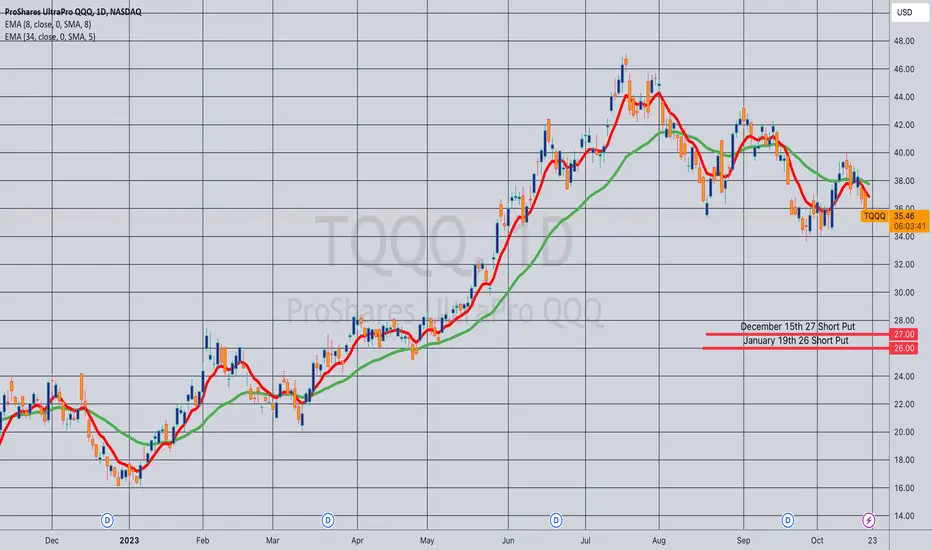
Opening (IRA): TQQQ December 15th 30 Short Put... for a 1.10 credit.
Comments: High IV. An engagement trade targeting the 16 delta (ish). Going small with this starter position, with an eye toward adding at intervals.

Opening (IRA): TQQQ January 19th 27 Short Put... for a 1.37 credit.
Comments: Targeting the 16 delta strike here, adding a rung out in January at a strike better than what I currently have on in December at the 30.

Opening (IRA): TQQQ Dec/Jan 27/26 Short PutsComments: Targeting the 16 delta here to emulate dollar cost averaging into the underlying at strikes slightly better than what I currently have on.
December 15th 27: 1.06 credit
January 19th 26: 1.41 credit