SPY & QQQ 15m Trend Change Back to Bulls, Need 1h trend change - After this mornings hourly bear flag with no follow through from bears bulls try to play defense and we had a megaphone pattern play out in the morning.
- QQQ was holding SPY up for the entire day, then the last 30mins bear sectors in SPY joined Bull sector QQQ.
- need to confirm a hourly uptrend to set the daily higher low for bulls.
- would like to see bulls play offense tomorrow.
TQQQ

$TSLA intraday trade YESTERDAY, NO longer want after $NDX hitAll this documented
Check profile for more data
---
10am Yesterday---
187 is support, going to start nibbling $TSLA here
WITH TIGHT LEASH
------------------------
1026AM updated
Interesting that $VIX isn't moving
Did the $TSLA & will likely just try & scalp some points
$187 is a decent area
Sold short March 17, 190 puts, were $9 bucks!
$TQQQ done for quick trade, looking to close soon
$NDX
------------------------
1048AM
DONE!!!
$TSLA Sold $9 covered @ $7
$TQQQ done as well
Even more cash than yesterday
Will WAIT & see, maybe get few more scalps here & there
Looking @ #Tesla $ZS $TQQQ & others for re-entry but patient
---------------------
TODAY NO LONGER INTERESTED IN $TSLA
$NDX looks weak, middle of trend & $TSLA doesn't look like it wants to hold
Will revisit 167ish

Jerome Powell And 15m 12 EMA Bear Control SPY & QQQ After breaking 12 EMA 15min time frame yesterday bears have been suing it for full control underneath it.
- at this price point SPY retraced over 60% QQQ retraced 50%. Burden is on the bulls to step up here. Bear still comfortable
- if QQQ start dropping more than 50% retracement everything will start favoring the bears
- Jerome Powell spoke today and now market is pricing in 71% chance of a 0.5% bps hike. he is speaking again tomorrow mornings 7am
- Very key area for battle between bulls and bears now.

Reversal in progressSQQQ is experienced a temporary downturn, and based on reoccurring trends, I suspect it will soon be followed by a strong reversal upwards.
Good luck.
Not financial advice. Trade at your own risk

15m 12EMA Perfect Guide For Both Long & Short QQQ & SPYLast week i mentioned the 15m 12 EMA guide for holding onto profits for both SPY and QQQ which we bounced off again this morning. After we broke the 15m 12EMA today i took a day trade on SQQQ and sold it close to the end of the day because we are still in a strong hourly uptrend and I do not want to hold overnight playing countertrend.
Notes:
- still need to change 4h and daily trend to uptrend, currently in neutral trend
- Even thought i shorted today im still leaning bullish on SPX and NASDAQ for longer time frame in 4h / daily and weekly. until price action tells me otherwise so would likely be looking for another TQQQ entry.
- Powell speaking this week
- we shot straight up 5.5% on QQQ into resistance a pull back for consolidation was very likely

$14,600 Profit on TQQQ Swing Trade, What to look for next week. A deep technical analysis as to why I took profit on my 8000 shares of TQQQ and some mistakes I made on my trade that I could of done better.
- Also what to look for on Monday, Monday is likely a buying the dip opportunity day for the next move up on SPY and QQQ, i explained what we should be looking for to be buying in again.
- the weekly higher low is set and i will be playing off of it
- bulls are still in a weekly uptrend and now we have to change 4h and daily trend back to the bulls.

NDX is going lowerWhen viewed on the monthly timeline, you can see the similarities to the tech bubble.
We've had a massive bull run over the past 10+ years. The market is due for a major correction and this is it.
If the bears win over the next two weeks, you can be sure that we are going much, much lower.
NDX 9000 or lower by Q2-Q3 to close out the correct.
Buckle up and good luck.
Not legal advice.

NADSAQ/QQQ Support & Resistance Range AnalysisWe have been trading in range since last Friday, i am looking for volatility to come in very soon either tomorrow or Friday after we have been tightening up for some time.
I am sightly more bullish because i am looking for a weekly higher low, if this isn't the weekly higher low i would get stopped out with a small loss at these levels as now we have a clear double bottom support level to look out for with QQQ/NASDAQ.
Currently holding a TQQQ position $21.57, if we break bear tomorrow will likely stop out with a small loss.

August Cycle RepeatsI am just shocked how identical these cycles repeat.
Market manipulation or human nature?
It is what it is...prepare for liftoff

The fourth (BIG) drop is setting up nicelyNDX is overbought and is ready to drop
The momentum has turned sour
Weekly and Monthly moving averages are providing strong resistance
The pattern repeats for every drop and is repeated now
Based on models from 2001 and 2018, we are primed for the 4th drop
The 4th drop is the most significant and will easily take NDX below 10,000
I predict the final bottom will be July 2023.
Not financial advice - trade at your own risk

TQQQ Simple Chart AnalysisTQQQ - Rst 24 & 39 Supp 16
This code stock will represent long in nas100 chart. It can be traded like a stock to play. This will be the fastest way to gain a 100% ROI as long nas100 continue to shine & rise.

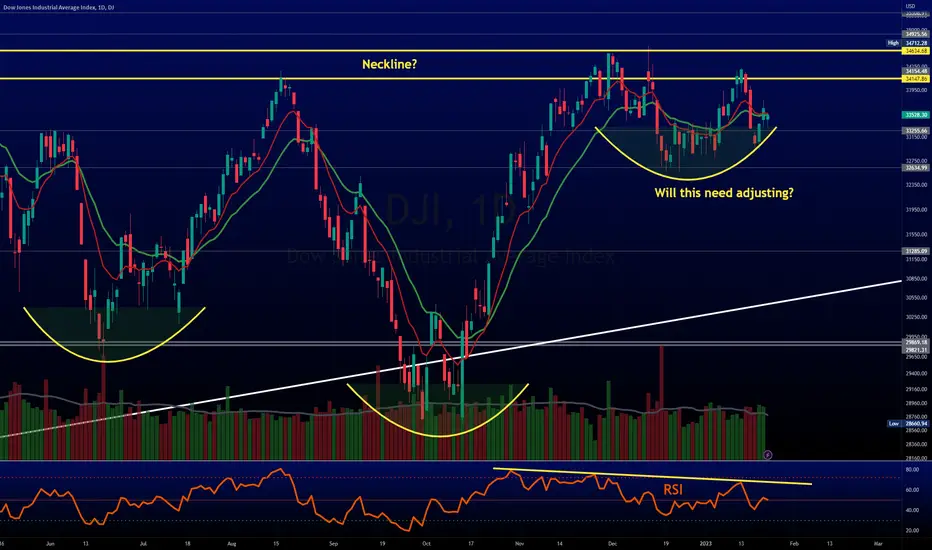
$NDX looks better than $DJI, but it's no slouchPls see profile for more info
We limit data
as it's copy paste
We're cautiously bull $DJI, bit more on $NDX
But there's reasons:
#ECONOMY = TRASH
Tons of good lost jobs
Unemployment low but most BAD jobs & multiple jobs
#DJI RSI negative divergence (slight weakening)
#NDX RSI looks good & many green candles
$DIA $QQQ #QQQ #Stocks
NAS100 Simple Chart Analysis Nas100 - Rst 12180 Supp 10674
During a year period of downtrend, we notice that 10674 is the only area being strongly supported with trip bottom pattern. If this area does not broke, i do believe market wave will continue to move towards a big rounding bottom back to highest rst 16590 area.
The risk to fail this recovery pattern will be the rise of CPI data. That's the only concern.
My 2023 Pick For US Counter as below
META
TQQQ
NETFLIX
AMD
BA

$NDX shows technical strengthening on 4HREncouraging for $NDX
Start top left, left > right, then bottom left
Can u c cup forming? 30Min shows it best
#NDX 4Hr Bullish crossover, strengthens daily
Daily, struggling here, thick yellow line on last chart
$DJI Inverse Head Shoulder still in play
$QQQ $VXN $TQQQ $SQQQ

$NDX has momentumWe're setting up for 2nd leg from yesterday's move
Volume yesterday was good
$NDX #NDX $QQQ $TQQQ $SQQQ $VXN

QQQ MACRO ANALYSIS / SUPPLY & DEMAND / SHORT / PREDICTIONDESCRIPTION: In the chart above I have provided a macro analysis of QQQ.
*IMPORTANT: Aside from SUPPLY & DEMAND POCKETS the main thing to consider is the distinct pattern we seem to have been following for the past 3 falls after rallies. Where PRICE ACTION seems to create this hook like formation before CAPITULATION takes place.
POINTS:
1. QQQ exhibits a DOWNWARD TREND on the 16Hour Timeframe.
2. Deviation of 35 POINTS TOTAL JUSTIFIES SUPPLY & DEMAND POCKET PLACEMENT.
3. Estimation of Days for upcoming drop was taken by using a mean from last three rallies and falls of 76, 79 & 58 DAYS = 71 DAYS.
4. Depth of DROP was also estimated with a mean average that came out to roughly 25%.
5. MACD IS ALSO IN CONGRUENCE WITH CURRENT CHART PATTERNS & MACD LEVELS ARE CORRECTLY POSITIONED FOR MORE DOWNSIDE.
BULLISH SCENARIO #1: We come to see a continuation of current channel & commit to sideways momentum above 260 eventually breaking past 295.
BEARISH SCENARIO #2: If hook pattern is to expire reliable we can surely bet on enough downside that will send us below 260 and onto 225 as a final destination that can serve as a more probable MARKET BOTTOM.
NASDAQ:QQQ
NASDAQ:TQQQ
NASDAQ:SQQQ

TQQQ - Price Targets & Stop Loss📈 What’s up investors! 📉
Welcome back to another one of
💡“Mike’s Ideas”.💡
I post as I find signals… these signals are based on the personal rules I have built and follow in order to make up what I call the “SST Strategy”. Follow for more ideas in the future!!
I have 4 levels marked and colour coded on the Chart.
These levels are:
⚪ White = Entry Point
🔴 Red = Stop Loss
🟢 Green = 1.2:1 Risk Reward Ratio
🟡 Yellow = 1.5:1 Risk Reward Ratio
🔵 Blue = 2:1 Risk Reward Ratio
👀 So what are we looking at today…!!!
🚨( TQQQ ) ProShares UltraPro QQQ🚨
The fund invests in financial instruments that ProShare Advisors believes, in combination, should produce daily returns consistent with the fund's investment objective. The index includes 100 of the largest domestic and international non-financial companies listed on The Nasdaq Stock Market based on market capitalization. The fund is non-diversified.

TQQQ Short Back To $17I think we are over bought! Prices have halted with a spinning top doji having formed and a candle after to confirm a possible pullback. We have room to drop back to the high volume node at $17 where smart money will make the next decision on direction. Not financial advice , DYOR

New Year Rally Opportunity 5% scalp or more!The market shall remain irrational and thus I will take the opportunity to go long at least for a scalp up to $18.70, if we see continuation there are some upper targets to note. The hull suite is giving a buy signal, rsi moving up and we are far from over sold. Not financial advice, DYOR. Stay Blessed.

Update on QQQ/SPY Relative PerformanceThis is a daily chart of the relative performance between the Nasdaq 100 ETF (QQQ) and the S&P 500 ETF (SPY). Analyzing this trend in relative performance can help us determine the strength of technology stocks relative to the broader market.
Today, for the first time since 2021, the QQQ/SPY daily candle closed above the Ichimoku Cloud. The Ichimoku Cloud is one of the best indicators for detecting trend reversals. When a candle closes above the cloud, it is often considered a bullish trend reversal on the timeframe analyzed, and similarly, when a candle closes below the cloud, it is often considered a bearish trend reversal on the timeframe analyzed. The shaded area that constitutes the cloud acts as support when price enters from above and resistance when price enters from below.
Finishing above or below the cloud is considered "piercing" the cloud, and the most valid piercings occur on strong volume and with strong oscillator momentum. The piercing event that you see on this chart is actually quite unusual because many piercings occur when the cloud narrows. Here we see QQQ/SPY piercing the cloud while it is wide. This may be reflective of a trend reversal on a higher timeframe.
The QQQ/SPY relative performance is looking fairly bullish on the lower timeframes, here's how it looks on the higher timeframes:
Weekly Chart -
The weekly chart is still showing strong upward momentum (meaning strength in tech relative to the broader market), but it is beginning to interact with the MA Exp Ribbon (the yellow and orange lines) which will act as resistance. Volume is decreasing. Therefore, the weekly is neutral since it has both fairly bullish and bearish signals.
Meanwhile, the QQQ short derivative, SQQQ, is experiencing a breakdown in the weekly trend, which may precipitate a short squeeze. As many of you know, a short squeeze occurs when market participants who believe the market will go down and who are therefore shorting the market get forced out of the market because their stop losses trigger. This occurs because the price of the asset being shorted is rising rapidly, and in turn, this causes price to accelerate even higher. A short squeeze is a positive feedback loop that can lead to extreme price movements.
Monthly Chart -
On the monthly chart, we see two bullish signs. First, price was supported by the monthly MA Exp Ribbon, which suggests that the long-term trend of tech outperforming the broader market remains intact. See below chart.
Second, the monthly chart shows that a double top occurred, and the measured move down was completed. See below chart.
Yearly Chart -
The yearly chart is the most bearish chart of all for tech's dominance. However, very rarely is the yearly chart appropriate for taking a trade in a certain direction. See below for a simple chart analysis of why we might see QQQ's dominance wane over the coming years.
When you adjust for dividends, the chart is even more bearish. It's possible that the era of inflation and the end of "easy money" (or "Quantitative Easing") has brought about a new supercycle where tech stocks underperform relative to the broader market (S&P 500). (A supercycle refers to a trend that exists for years or decades, and is often used in the context of Elliot Wave Theory). See below.
Not all is bearish for QQQ even during a supercycle downtrend. First, the chart is merely a relative performance chart. So QQQ will still largely be going up over time, this chart just means that it may not go up by as much as the broader market (S&P 500). Most investors and traders will not even realize that this relative downtrend is occurring. To prove this point, how many of you knew that Apple has been resisted downward relative to SPY for almost two years? (More about Apple below)
Second, there will be periods of strong bounces in relative performance, like the one occurring right now, when the yearly chart hits a Fibonacci level. These will be great intermediate-term long opportunities for tech. (See chart below).
Finally, even as QQQ as a whole may underperform, some components within it might over-performance. Speaking of components, no analysis of QQQ would be complete without also analyzing Apple, the ETF's largest component, and indeed, the largest company in the world by market capitalization. Since Apple is the largest component of many ETFs and mutual funds (e.g. your retirement fund), whichever way Apple moves, the entire market will move. I recently posted this article below about Apple trying to break through resistance relative to SPY:
My conclusion in that article is that unfortunately for those who are long-term bullish on Apple, it is at best, "faking out" on its relative performance to the S&P 500. A fake-out simple means that an asset appears to break above resistance, but in fact, it is just forming an upper wick on a higher timeframe and price will fall back below. The best way to detect a fake-out is a break out in the RSI after bearish divergence has occurred, and while the RSI is in overbought territory. Although I love Apple as a company and know that it will pave the way for future revolutions in technology and help build the metaverse, it is showing definite bearish signs on the long-term charts. I guess the silver lining is that, by the time the metaverse framework is built out in a decade or so, Apple will probably be finished an underperformance supercycle, and be ready to rip during the metaverse era.
Finally, I will leave you with this note: Regardless of all of any chart analysis, the time-tested and proven winning strategy is to invest broadly in diversified asset classes over the long term (including tech which may or may not be undergoing an underperformance supercycle). This means continuing to contribute as much as possible to your retirement accounts. You should not even be trading if you're not using your money to max out your retirement contributions first. If the stock market crashes, do not stop or lower your contributions or try to pull money out because you think the world will end. Rather, continue to contribute as much as you can afford no matter what. Contributions during market downturns will buy you more shares of your retirement mutual fund relative to the number of shares your contributions bought prior to the market crash. When price rebounds (and it will) you would have been glad to stick to this time-tested investment strategy.

TQQQ bullish scenario This is the bullish scenario for TQQQ i think we will hit the support at A but a reversal www.tradingview.com could take place at that point

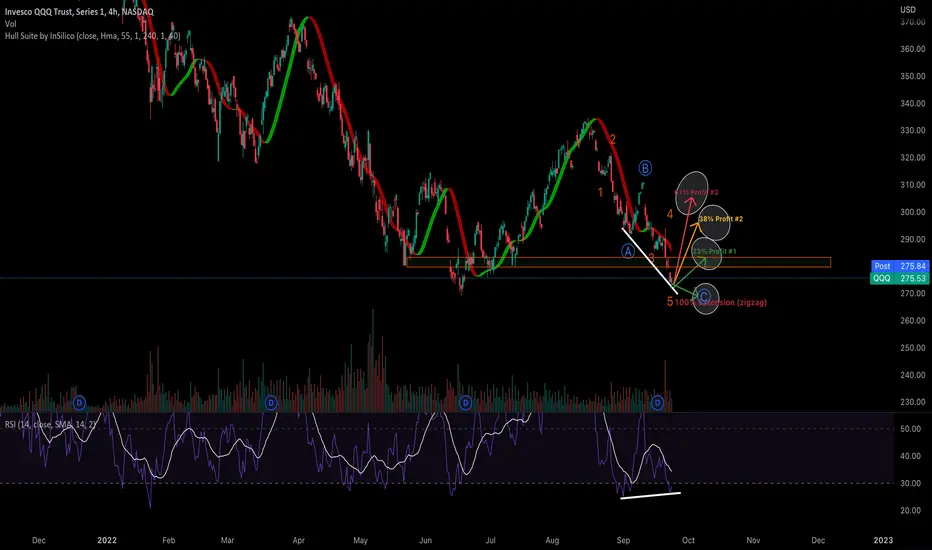
QQQ reversal soon?www.tradingview.com [/urlOk so with the divergence on the 4 hr it is very possible wave 5 is complete, But we have a zigzag formation that has not been completed yet, C will mark the spot at 100% extension, if we were to reverse here these are some levels to watch. I know most people are bearish and so am i BUT the market has never tanked when people expected it too, that's the only thing keeping me a little bullish, also a lot of people are shorting the market so it would be a perfect time to make a big squeeze,
QQQ looking to long very soon So far my TA has been spot on, lets see if I can keep the hot streak, major imbalance in orders with the large gap, looking for a long to fill the gap then close PLEASE CHECK MY POST ON AUGUST 28TH www.tradingview.com This TA could easily turn bullish
