WARNING! WARNING WARNING QQQ BULL TRAP!So just a friendly reminder that we are still in a bear market so be extremely careful trading against the trend! I closed my long position a little early to manage risk.
This is what i'm seeing, the last few large candle sticks have lacked volume behind it, which means we lack BIG money.
TSV and MFI are both showing signs of weakness and bearish divergence
Also the MFI is oversold and if u look back in history on qqq it's been a sign of hard decline afterward.
This also happens to be a strong resistance area
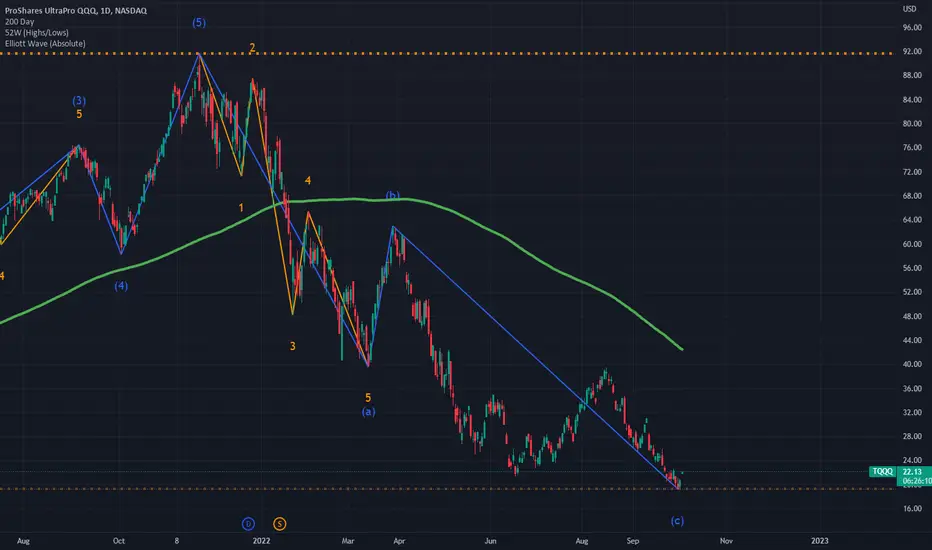
Just my opinion here- I think we will have one more hard leg down before a good november and december months, if we dont get a lower low at the very least drop down to our previous support which is $269 area, elliot wave is not perfect you have to adapt and find where you are on the trend, currently i think we are in wave 4 because we retraced back to to the 38% fib level which is a key level, but that could change.
Please feel free to ask questions or if u have a different opinion i would love to hearb it www.tradingview.com .
thank you god bless
TQQQ

Warning possible bull trap WAVE 4 complete, please check my other post, the gap was filled, TSV. is showing signs of weakening, price going up but volume is not there. I exited my TQQQ long, i jumped into SQQQ which in my opinion was a little to early. I should have waited for confirmation.

TQQQ market swingMarket reversals like this tend to signal market bottoms. Only has happened 9 other times since 1983.

TQQQ weekly bearish hammer continuation wave 5 downtrendOrder SELL TQQQ NASDAQ.NMS Stop 18.29 LMT 18.29 will be automatically canceled at 20230401 01:00:00 EST
TQQQ weekly bearish hammer continuation wave 5 downtrend

Critical level for #TQQQWe are approaching a critical level for #TQQQ I think it might give us some temporary bounce 18.4 is level to watch next week

TQQQ at the end of an Elliott waveWe are at the end of an Elliott wave. This will be a turning point keep on the lookout for wave 1 of the next cycle. Things are telling me, recession is canceled until next year so wave 1 might be upward.
UP, UP AND AWAY FOR TQQQLets go baby, we are at the bottom, making new lows! Only way to go from here is 62.90 by July!
-SPECIAL NOTES-
1. I trade this stock with a very small percentage of my money, I am not dumb.
2. There is a ton of controversy on this stock, in my opinion it should only be day traded, not long term due to volatility decay.
3. Since there is so much misinformation on leveraged stocks, I decided to test $50 every 2 weeks from my paycheck and buy like a robot. NO EMOTIONS INVOLVED. This is a Dollar Cost Averaging (DCA) strategy I am choosing to do.
4. Please be careful with your money and don't go all in because I said the stock is going to go up, it is still just guessing and learning.
Thank you!

Small dip and then jump up againElection coming. Fib 50% looking a safe bet here. Expect SPY 349 and then bounce back up to 400+ by year end.


TQQQ PITCHFORK SETUPWe have a nice pitchfork setup going on. Should see a momentum swing up from here.

Time to go longSee the reversal Hammer. i wish to see green day on Monday and Tuesday then we can see good spike up in QQQ again

TQQQ after inflation drop 7 days laterTQQQ still hasn't recovered. News coming out tomorrow is the FOMC, causing the flat run. Hopefully Feds do not cause this market to drop further, I believe they will not want to do that. Nevertheless market is calm before the storm.

TQQQ drop due to 8.3% inflation expected 8.1%Wanted to document this drop for my personal record keeping. This is a pre market drop, will post another with aftermarket trend for analysis. 09/13/22 CPI data effects.

TQQQ, 4 HrsNASDAQ:TQQQ
Disclaimer : I am not a financial advisor nor a registered investment professional. This content is for entertainment purposes only and is not investment, tax, or financial advice. Always do your own diligence and research. You are solely responsible for all investment, tax, and financial decisions that you make.

Updated Analysis on Tech (QQQ)This is the daily chart of SQQQ.
SQQQ is the ETF that tracks the Nasdaq 100 ETF ( QQQ ) inversely. When tech stocks fall, SQQQ rises. Traders, therefore, use SQQQ to short tech stocks, or to hedge against a collapse in tech prices.
There are several bearish signals appearing in the daily chart of SQQQ, which hint that we may soon see bullish movement for QQQ and the Nasdaq.
First, there is decreasing volume in the daily chart of SQQQ, which shows that fewer and fewer market participants are opening new short positions against the Nasdaq. This is occurring even while the price of SQQQ continues to move up. This divergence is bearish and is usually the earliest sign that a reversal is coming.
Second, there are major gaps up appearing on the daily chart. Gaps to the upside on SQQQ have historically never failed to close back to the downside. Therefore these gaps should be viewed skeptically, as they fail to validate upward price action.
Third, the upper limit of the Fibonacci Bollinger Band continues to act as strong resistance, continuing the more than a decade-long trend whereby price cannot sustain itself above this line on any sustained basis. This line has mathematical importance, it reflects a level of price deviation where, after being reached, price begins to show a mean-reverting tendency back to the downside. In this case, SQQQ's mean reversion would be bullish for QQQ and the Nasdaq.
There are many other indications that are showing that SQQQ is too overextending, including the extremely over-heated Stochastic Heat Map.
The NDTH is also indicating that a very significant bottom is forming for tech and the Nasdaq. In fact, the Nasdaq is so oversold that the current levels have not been seen this the market crash of 2008-2009. Therefore, SQQQ has effectively priced in a significant recession. While a significant recession might indeed be on the horizon, if a significant recession does not ensue, then we can be fairly certain that a major short squeeze for SQQQ will occur:
However, the strongest bullish argument for SQQQ (bearish argument for the Nasdaq) is that weekly price broke through the Ichimoku Cloud for the first time ever. The only plus here is that the weekly candle is a spinning top and most oscillators are trending back down.
Regardless, with SQQQ being this historically overextended, it can represent a rare opportunity to buy QQQ and tech stocks before a massive short squeeze occurs. While anything can happen, and one should always use stop losses, this chart does not convince me that SQQQ is about to breakout much higher to the upside. Therefore, I remain a holder of tech and growth stocks for the intermediate-term.
Not financial advice. Anything can happen and trends can end.

channel upwidening channel up towards old mid highs. qqq's sealed up a bottom and now trying to tighten the bolts as it goes higher.

Long term prediction for TQQQ Long Term prediction for TQQQ , risky making a prediction this far out but with total world fundamentals being negative i don't see us returning into a bull market BUT there is a bullish scenario in this TA but im waiting on a few things to unfold before posting, PLEASE if your a expert at elliots wave theory and u have pointers please let me know. Thanks! www.tradingview.com

Here's Why You Should Think Twice Before Selling TechThis is a 2-month chart of the Nasdaq US Composite Index (IXIC).
At the bottom is the Stochastic RSI which oscillates up and down depending on how overbought or oversold the market is.
There have only been a few times since its inception a half-century ago, that the Nasdaq Composite Index had a 2-month chart this overextended to the downside. The K value of the Stochastic RSI has actually reached zero.
If the 2-month chart closes at that level, it will mark a super rare occurrence that has only occurred twice in the history of the Nasdaq (the last time being at the bottom of the Great Recession).
I calculated the one-year returns for the Nasdaq one year (from low to high) after the K value of the Stoch RSI on the 2-month time frame dropped below the oversold line (to or nearly to 10). For the case of the Dotcom bust and the Great Recession, I selected the point when the Stoch RSI's K value first reached 0, which is its current reading and which is thus fairly comparable. Even during these significant economic downturns, buying at this oversold level produced decent returns one year out.
Obviously, past price action does not guarantee future price action, but history does tend to repeat itself. Odds are that ten years from now you'll probably be wishing you had bought into this oversold level.
Here are the one-year returns from the market bottom during the 2M period (when the Stoch RSI K value met the criteria listed above) to the market top of the 2M period one year later:
+95.78%
+36.47%
+31.24%
+78.89%
+20.17%
+69.50%
+27.14%
+52.36%
Mean: +51.44%
Not financial advice. As always anything can happen.

Tech is at a Significant BottomI'm surprised that no one on Trading View posted this chart today.
The NDTH is a chart of the percentage of Nasdaq 100 stocks that are above their 200-day moving average. It dropped to 6.86 today. This means about 94% of Nasdaq 100 stocks were below their 200-day moving average. The last time this level was reached was in March 2020 right at the bottom of the COVID market crash. The NDTH has never dropped below 15 except during significant bottoms on the Nasdaq.
While anything is possible, it's highly likely that we are seeing peak fear, peak inflation, and market capitulation currently. This extreme level makes for a very good risk-to-reward setup for going long. My strategy is to place a 2x daily ATR stop loss on QQQ or TQQQ. It's likely if we drop below this level then we're in for a deep recession. Whereas if this low holds, then this is a major bottom for tech.


lost TRAMA and reaching lower toward VWAPemini nasdaq futures ndx nq1! is trending toward sss supply zone and VWAP after losing TRAMA. lowerhorizontalsifwe stay beneath pivot, and upper if we bounce above.

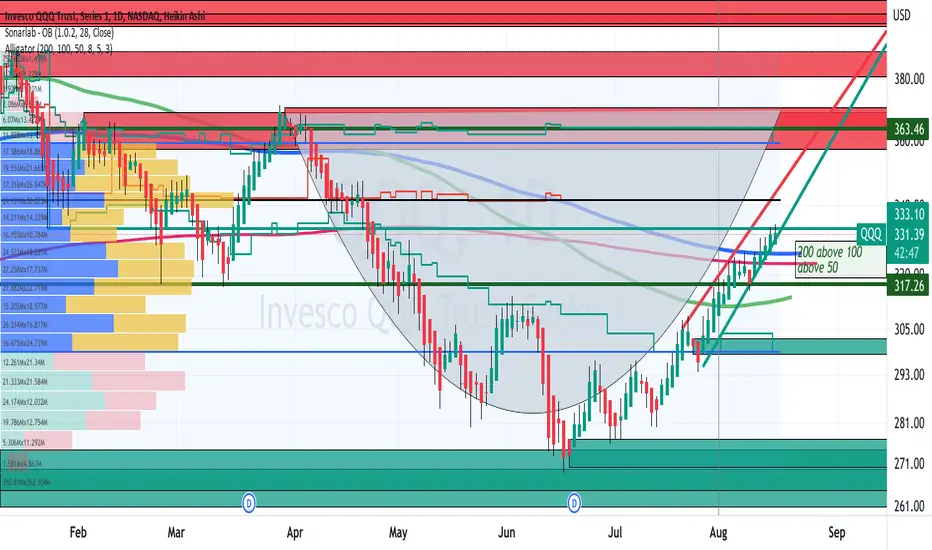
QQQ Uptrend BULL biasFrom the Daily Chart, QQQ is now in an uptrend above
the support of the daily SMA 50, 100, and 200 in somewhat of an ascending wedge pattern.
Distant support is the buy order zone while distant resistance is the
sell order zone above. Immediate ( and breakable ) resistance is
the POC of the volume profile.
I conclude that QQQ is in a sustained up-trend that could be entered
using a stop loss set just below the SMA 200 on the chart in blue.
What is your opinion? NASDAQ:QQQ Please comment.
QQQ Monthly Chart Since COVID LowNASDAQ:QQQ
appears to show the pullback is complete QQQ
is now sitting above the long-term volume profile POC
now with relative strength increasing from mid-range
after a rounded bottom in mid-June
Red Candle Covid Low than all green candles on
uptrend until Dec 21 now a new green candle
There may be good days ahead as a resurgent bull run
gathers momentum ?
