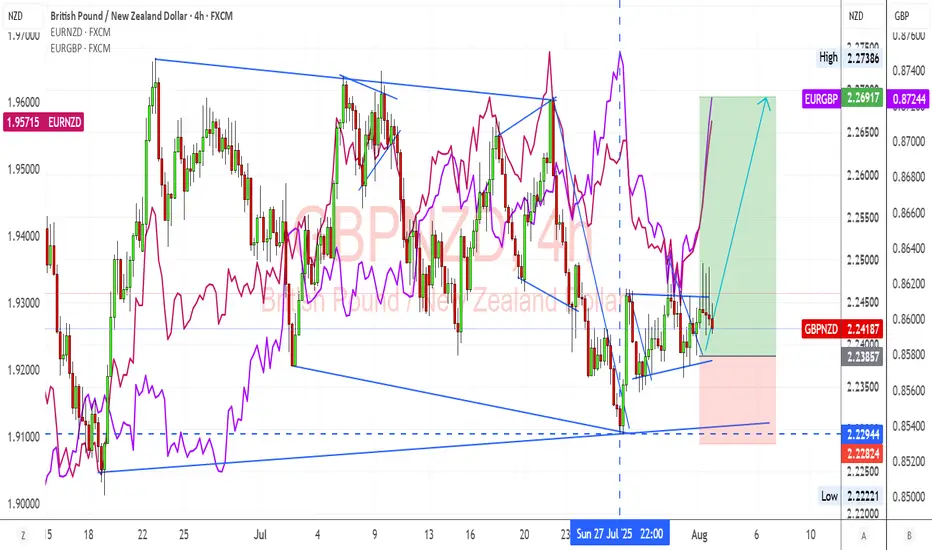
GBPNZD Breakout from Consolidation Bullish Momentum BuildingGBPNZD has broken out of its recent consolidation pattern and is showing signs of bullish continuation. Strong GBP fundamentals combined with NZD weakness from global risk-off sentiment and tariffs support this technical move.
Technical Analysis (4H Chart)
Pattern: Breakout from a descending channel with bullish follow-through.
Current Level: 2.2418, trading above the breakout level, confirming momentum shift.
Key Support Levels:
2.2294 – recent breakout support and invalidation point for bulls.
2.2222 – secondary support if a deeper pullback occurs.
Resistance Levels:
2.2500 – near-term resistance and potential target for the breakout.
2.2690 – extended bullish target if momentum continues.
Projection: Likely to continue higher toward 2.2500, with room for 2.2690 if GBP strength persists.
Fundamental Analysis
Bias: Bullish.
Key Fundamentals:
GBP: Supported by BOE’s cautious stance on inflation and the relative resilience of the UK economy.
NZD: Pressured by global tariffs, weaker risk sentiment, and limited domestic growth catalysts.
USD Factor: Fed rate cut expectations indirectly support GBP crosses against risk currencies like NZD.
Risks:
Hawkish surprise from RBNZ could strengthen NZD.
BOE dovish signals could stall GBP upside.
Key Events:
BOE meeting and UK CPI.
RBNZ policy decision.
Risk sentiment trends globally.
Leader/Lagger Dynamics
GBP/NZD is a leader among GBP crosses, with GBP strength and NZD weakness driving momentum. It also aligns with EUR/NZD upside moves, reinforcing the bearish NZD outlook.
Summary: Bias and Watchpoints
GBP/NZD is bullish, having broken consolidation with upside targets at 2.2500 and 2.2690. The main drivers are GBP’s policy support, NZD’s risk-off weakness, and global tariff concerns. Watch for BOE and RBNZ updates as potential volatility triggers.
Trade-ideas
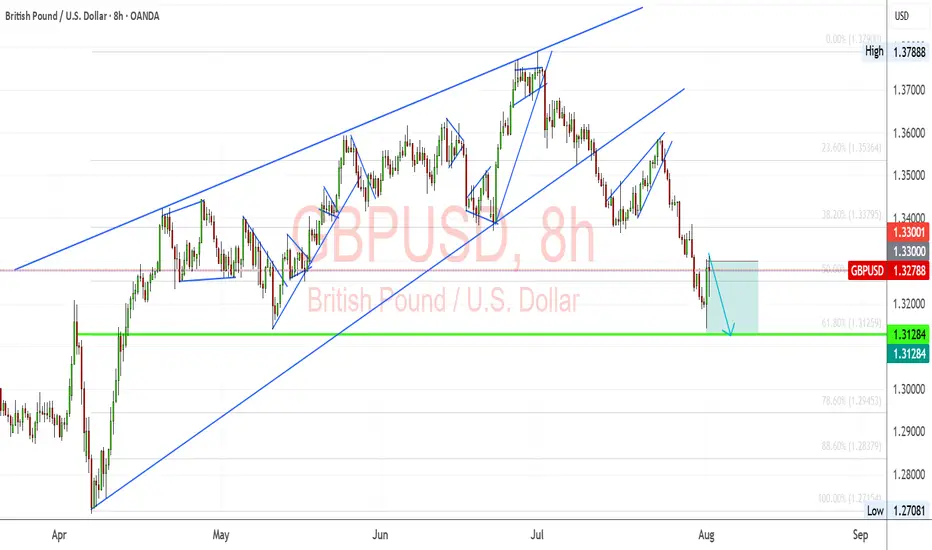
GBPUSD: Bearish Momentum vs. Fundamental Repricing – Key LevelsGBPUSD is at a critical juncture, balancing a clear technical breakdown with a fundamental backdrop favoring near-term volatility. The pair has slipped from its rising wedge structure and is now testing key retracement zones while markets reprice expectations for Fed rate cuts after weak US jobs data. Traders are closely watching whether this bearish momentum will extend toward the 1.3128 support or if a rebound from oversold conditions could trigger a corrective bounce.
Technical Analysis (8H Chart)
Pattern: Clear breakdown from a rising wedge, confirming bearish bias.
Current Level: Price sits near 1.3278, struggling to reclaim the 1.3300 resistance zone.
Key Support Zones:
1.3128 (61.8% Fibonacci retracement) – main bearish target.
1.2945 (78.6% retracement) – extended downside target if selling pressure deepens.
Resistance Levels:
1.3300 (immediate resistance, prior support now flipped).
1.3380 (secondary resistance if a retracement rally occurs).
Projection: Likely bearish continuation toward 1.3128, with a potential retest of 1.3300 before continuation.
Fundamental Analysis
Bias: Bearish in the short term, but Fed policy and risk sentiment remain key drivers.
Key Fundamentals:
USD: Weak NFP (73K), higher unemployment (4.2%), and downward revisions boost Fed cut bets (~75% for September), typically a USD-negative factor.
GBP: BOE maintains a cautious stance due to sticky inflation but lacks clear hawkish conviction as growth slows.
Tariffs: US tariffs add a mild negative weight on GBP trade sentiment.
Risks:
Hot US CPI could slow Fed cut bets, supporting USD.
Hawkish BOE comments could limit GBP downside.
Global risk sentiment shifts could either favor USD (risk-off) or weaken it further (risk-on).
Key Events:
US CPI and PPI for USD direction.
BOE policy updates and UK CPI.
US jobless claims and Fed commentary.
Leader/Lagger Dynamics
GBP/USD is a lagger, mainly reacting to USD shifts. However, its moves directly influence GBP crosses such as GBP/JPY and GBP/CHF.
Summary: Bias and Watchpoints
GBP/USD remains in a bearish phase, targeting 1.3128 with a potential corrective bounce toward 1.3300 first. The primary driver is the technical breakdown, while fundamentals add volatility around US CPI and BOE policy. If CPI surprises lower, the bearish outlook could reverse into a short-term rebound; if CPI is hot, downside momentum could extend. You should monitor USD-driven events closely as GBP/USD sets the tone for broader GBP movements.
NZDCHF – Bullish Breakout Sets Stage for ReversalNZDCHF has broken decisively out of a long-term descending channel, signaling a potential trend reversal. Price action confirmed multiple bullish flags within the falling structure, followed by a clean breakout and higher low retest, supporting a bullish continuation bias.
Currently, the pair is stabilizing just above prior resistance turned support around 0.4760–0.4780, forming a potential launchpad for the next leg higher.
Upside Targets:
TP1: 0.48336
TP2: 0.48844
TP3: 0.49319
Invalidation Zone:
A drop below 0.4720 would invalidate the breakout structure and expose the downside.
Fundamental Drivers:
🇳🇿 NZD Strength: RBNZ remains relatively hawkish compared to other central banks, and the Kiwi may gain from improving risk sentiment and easing global recession fears.
🇨🇭 CHF Weakness: Swiss Franc is under mild pressure as safe-haven flows weaken amid improving tone on US-China-EU trade headlines and fading ECB rate cut bets.
🗓️ Macro Flow: Upcoming risk events (Fed comments, trade updates, and NZ economic prints) could inject momentum into the pair, especially if risk appetite improves.
Bias: ✅ Bullish (Buy)
Confidence: ★★★★☆
Watch for: Clean hold above 0.4770 zone + bullish momentum continuation.

EUR/USD Robbery Blueprint Bear Strike Activated!💣🎯Operation Fiber Down: EUR/USD Robbery Blueprint (Day Trade Edition) 💰🔫
🚨 Thieves, Hustlers & Chart Bandits Assemble! 🚨
🌍 Hi! Hola! Ola! Bonjour! Hallo! Marhaba! 🌍
Welcome back to another Thief Trading Operation, where the money never sleeps—and neither do we. Let’s break into the vault of EUR/USD “The Fiber” with surgical precision. 🧠💼🕶️
🧨 THE MASTER ROBBERY PLAN: EUR/USD SHORT STRIKE 🔍💸
💀 Market Bias: Bearish – Trend Reversal + Supply Trap Setup
🎯 Target: 1.15800
🛑 Stop-Loss: Near Swing High (around 1.17400 – 3H chart view)
🕓 Timeframe Focus: 15m / 30m / 3H
🧭 ENTRY ZONE:
👣 Plan your entry from recent high retests—that’s where the big money bulls get trapped.
🎯 Use Sell Limit Orders (DCA style / Layered Limit Orders) like a true thief setting up tripwires.
💼 RISK STRATEGY:
💡 SL should match your lot size and order count—not one-size-fits-all!
📌 Place above key structure or swing level (e.g. 1.17400) based on timeframe.
🔍 BEHIND THE SCENES – THE WHY:
The EUR/USD "Fiber" pair is showing all the classic signs of a trend shift and bear raid setup, including:
📰 Fundamentals weakening the Euro
💣 COT Report reveals institutional exits
🍂 Seasonal Bias points to downward trend
📉 Intermarket Pressure from bond yields & USD strength
📊 Sentiment turning overly bullish = trap zone
⛽ Storage & Inventory imbalances adding fuel
📌 Reminder: Before any robbery, study the layout—Macro, Fundamentals, Sentiment, and Intermarket are your blueprint.
🚨 HEIST ALERT – PROTECT THE LOOT:
🕰️ High-Impact News Events? Tighten up!
💼 Don’t take fresh entries during releases.
🔐 Use Trailing SLs to lock in profits.
🎯 Exit with grace before the sirens start.
⚡🔥JOIN THE CREW, BOOST THE LOOT🔥⚡
💥 Smash the Boost Button 💥 if you're vibing with the Thief Trading Movement.
We ain’t just trading—we’re executing strategic robberies on the market’s weaknesses.
🧠💪 Every like = more power to the crew. Every comment = a new map to a vault.
We rob, retreat, and repeat. Let’s make money with skill, not luck. 🕶️💰🚁
⚠️ LEGAL COVER (For the Lawyers 😏):
This plan is not investment advice, just an organized heist blueprint by chart robbers.
Always manage your own risk and update your plan as the market evolves.
🕶️ Stay ready for the next master plan... Until then, keep your charts clean and your stops tight. 🕶️💣📉
– Thief Trader Out 🐱👤🚀

USD/CAD Institutional Buy Zone – Thief Trading Alert!🔥 USD/CAD "LOONIE BANK HEIST" 🔥 – THIEF TRADING STYLE (BULLISH SNIPER PLAN)
💸 ATTENTION: Market Robbers & Profit Pirates!
"Steal Like a Pro – Escape Before the Cops Arrive!"
🎯 MASTER TRADE PLAN (Based on Thief Trading Tactics):
Entry Zone (Pullback Heist):
📌 Pullback-1: Market Maker Trap Zone (1.35400+) – Wait for retest!
📌 Pullback-2: Institutional Buy Zone (1.33500+) – Confirm bullish momentum!
"Patience = Perfect Heist Timing. Don’t rush—ambush the trend!"
🎯 Profit Target: 1.38100 (or escape earlier if momentum fades).
🛑 Stop Loss (Escape Route): Nearest 4H Swing Low (wick/close) – Adjust based on risk & lot size!
🚨 SCALPERS’ WARNING:
"Only snipe LONG! Big pockets? Strike now. Small stack? Join swing robbers & trail your SL!"
📉 WHY THIS HEIST? (Bullish Triggers):
Technical + Fundamental alignment (COT, Macro, Sentiment).
Overbought but institutional demand holding strong.
"Bears are trapped—time to rob their stops!"
⚠️ CRITICAL ALERT:
News = Volatility = Police Ambush!
Avoid new trades during high-impact news.
Trailing SL = Your Getaway Car! Lock profits before reversals.
💥 BOOST THIS HEIST!
"Hit 👍, 🔔 Follow, and 🚀 Boost to fuel our next robbery! Let’s drain the banks together!"
🔮 NEXT HEIST COMING SOON… Stay tuned, partner! 🎭💰

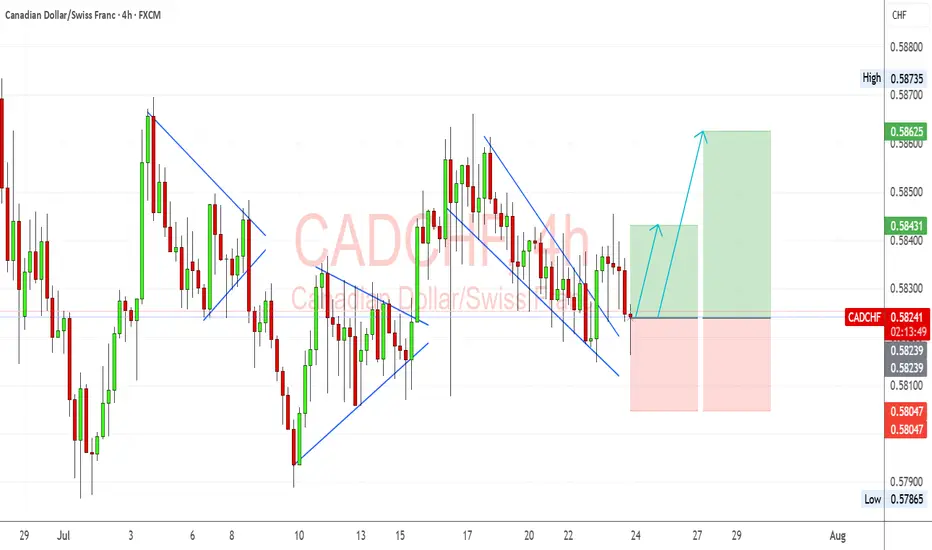
CADCHF Bullish Reversal in Motion Channel Break & Momentum ShiftCADCHF setup is developing into a potential bullish recovery after a breakout from a falling wedge. I’m looking for signs of buyer control as price attempts to build higher structure off the recent breakout.
📊 Technical View (My Setup Insight):
Falling Wedge Breakout: Price has cleanly broken out of the descending channel/wedge formation. That’s often a reversal signal, especially near support zones.
Support Holding: The pair found buyers around 0.5810–0.5820, an area tested multiple times in July. This zone has acted as a soft base.
Bullish Flag Recovery: Prior corrective patterns (flags/pennants) were followed by strong impulsive moves, and we may be repeating this pattern now.
Next Targets:
TP1: 0.5843 – aligns with previous structure and minor resistance.
TP2: 0.5862 – near the most recent high and top of consolidation.
Stop-Loss: Below 0.5800 to invalidate the reversal structure.
🧮 Fundamental Drivers (My Outlook):
CAD Support from Oil Stability: Oil prices have firmed around $78–$80, which helps the CAD via improved trade and energy revenue prospects.
SNB Stance Neutral-Dovish: Swiss inflation remains soft, and SNB has signaled comfort with its current policy rate, reducing CHF bullish pressure.
BoC Hawkish Bias: Despite softening Canadian CPI, the BoC remains cautious and hasn’t ruled out future hikes. CAD remains supported relative to CHF.
Global Risk Mood: CHF is sensitive to risk-off flows. With equities and commodities rebounding modestly, safe haven flows into CHF may slow.
⚠️ Risks to the Setup:
A sudden drop in oil prices could hurt CAD.
Risk-off sentiment due to geopolitical tensions or US equity selloffs could fuel CHF strength.
Any surprise SNB jawboning about FX could cause CHF to spike.
📆 Upcoming Events to Monitor:
Canadian GDP / Retail Sales – if strong, reinforces CAD recovery.
Swiss KOF Economic Barometer – gives insight into CHF macro tone.
Oil Inventories – strong builds or drawdowns influence CAD indirectly.
🔁 Leader/Lagger Context:
CADCHF is often a lagger, especially when risk sentiment or oil makes bigger moves. It can follow USDCHF or USDCAD behavior due to shared components.
If oil or global risk sentiment shifts, CADCHF tends to react with a small lag, making it great for secondary confirmation trades.
🧩 Summary – Bias & Watchpoints:
I currently hold a bullish bias on CADCHF following the falling wedge breakout and support defense. Fundamentals are moderately in favor of CAD due to oil stability and BoC’s cautious stance versus the more passive SNB. Key risks include any renewed CHF demand from risk-off shifts or soft Canadian economic surprises. The most critical levels now lie at 0.5843 and 0.5862 for upside targets, while 0.5800 remains key invalidation support.
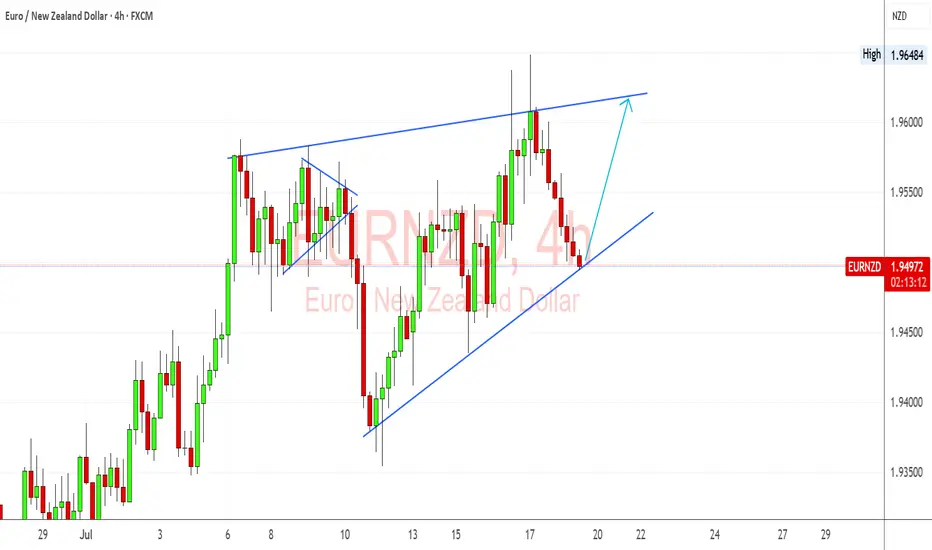
EURNZD Trendline & Hawkish ECB Bias Support Bullish ContinuationEURNZD is holding beautifully above the ascending trendline on the 4H, and I’m watching this level closely for a bounce continuation setup. Fundamentally, the euro remains supported by sticky inflation and hawkish ECB commentary, while the kiwi is showing softness after dovish signals from the RBNZ and mixed jobs data. If this trendline holds, I’ll be targeting a retest of the upper wedge resistance near 1.9640.
🔍 Technical Setup (4H):
Structure: Ascending triangle forming – price is pressing into dynamic support.
Support Zone: Around 1.9480 trendline area – price rejected this level several times in July.
Resistance Target: 1.9640 highs – double top and triangle resistance.
Bullish Confirmation: Rebound with bullish engulfing or strong 4H close above 1.9525 could trigger long setup.
Invalidation: Clean break below trendline and 1.9440 invalidates bullish scenario short-term.
💡 Fundamental Insight:
EUR Drivers:
ECB members remain cautious about declaring victory on inflation.
German and Eurozone CPI data remain above target, supporting higher-for-longer ECB stance.
Speculation that ECB won't cut aggressively compared to RBNZ.
NZD Weakness:
RBNZ minutes show concern over downside inflation risks.
Labor market cooling, and migration pressures remain high.
Commodity and China-linked sentiment weakening NZD.
⚠️ Key Risks:
If Eurozone inflation or PMI data surprises to the downside, EUR may weaken.
RBNZ hawkish pivot or surprise tightening would flip sentiment toward NZD.
Global risk-on could favor NZD as a high-beta currency.
🧭 Summary:
I’m bullish on EURNZD as long as price holds above the trendline near 1.9480. The technical structure shows a clean ascending pattern, and the fundamentals currently favor EUR strength over NZD. My eyes are on a potential move toward 1.9640, especially if upcoming ECB rhetoric stays hawkish. EURNZD tends to lead NZD-crosses like NZDJPY or NZDCHF in risk-off regimes and could signal euro strength if it breaks out. Watching closely for price action confirmation.
GBP/NZD: The Great Liquidity Grab? (Long Trade Plan)"🏦💰 GBP/NZD BANK VAULT RAID: Bullish Heist in Progress! (Long Setup) 💰🏦
🚨 Overbought Trap? Or Trend Continuation? Here’s How to Loot Pips Safely! 🚨
🦸♂️ GREETINGS, MARKET MARAUDERS!
To all the Profit Pirates & Risk-Takers! 🌍💸
Using our 🔥Thief Trading Tactics🔥 (a ruthless combo of price action + liquidity grabs + macro triggers), we’re executing a bullish heist on GBP/NZD ("Sterling vs Kiwi")—this is not advice, just a strategic raid blueprint for those who trade like outlaws.
📈 THE HEIST PLAN (LONG ENTRY FOCUS)
🎯 Profit Zone: 2.28700 (or escape earlier if momentum stalls)
💥 High-Stakes Play: Overbought but squeezing higher—trap for bears.
🕵️♂️ Trap Spot: Where sellers get liquidated.
🔑 ENTRY RULES:
"The Vault’s Open!" – Swipe bullish loot on pullbacks (15-30min TF).
Buy Limit Orders near swing lows for better risk/reward.
Aggressive? Enter at market—but tighter stops.
📌 SET ALERTS! Don’t miss the breakout retest.
🛑 STOP LOSS (Escape Route):
Thief SL at recent swing low (2H timeframe).
⚠️ Warning: "Ignore this SL? Enjoy donating to the market."
🎯 TARGETS:
Main Take-Profit: 2.28700 (or trail partials).
Scalpers: Ride long waves only. Trailing SL = VIP exit pass.
📡 FUNDAMENTAL BACKUP (Why This Heist Works)
Before raiding, check:
✅ COT Data (Are funds long GBP/short NZD?)
✅ Rate Spreads (GBP vs NZD yield shifts)
✅ Commodity Correlations (Dairy prices? Risk mood?)
✅ Sentiment Extreme (Retail over-shorting?)
🚨 NEWS RISK ALERT
Avoid new trades during RBNZ/BOE speeches (unless you like volatility casinos).
Trailing stops = your bulletproof vest.
💣 BOOST THIS HEIST!
👍 Smash Like to fuel our next raid!
🔁 Share to recruit more trading bandits!
🤑 See you at the target, rebels!
⚖️ DISCLAIMER: Hypothetical scenario. Trade at your own risk.
#Forex #GBPNZD #TradingView #LiquidityGrab #TrendContinuation #ThiefTrading
💬 COMMENT: "Long already—or waiting for a deeper pullback?" 👇🔥

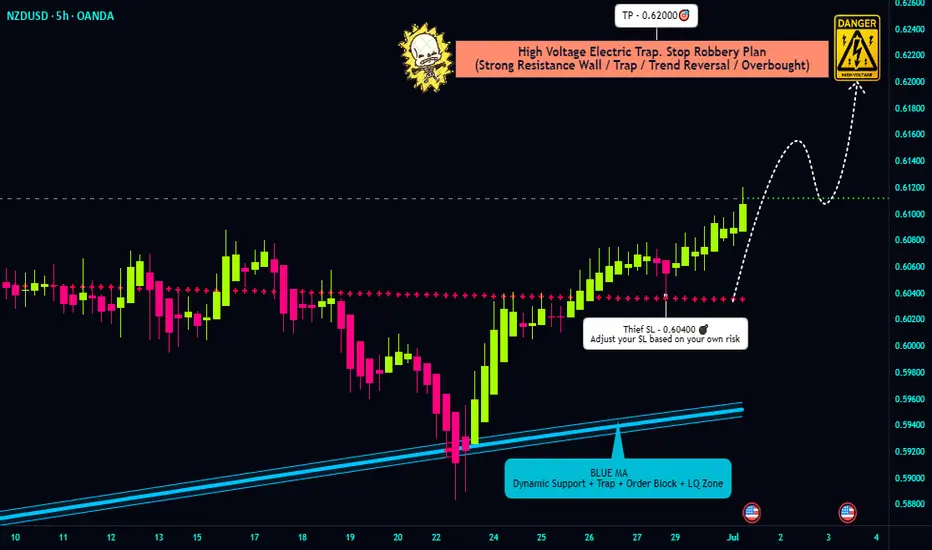
"NZD/USD Bullish Heist! Steal Pips Before the Reversal Trap! 🏴☠️ NZD/USD Kiwi Heist Masterplan – Steal the Bull Run! 💰
🌟 Hola, Money Makers & Market Marauders! 🌟
Welcome to the Thief Trading Style raid on the NZD/USD "The Kiwi" Forex vault. Follow the blueprint sketched in the chart for a bold long takeover — escape the high‑risk Yellow MA Zone before guards tighten!
🎯 Heist Blueprint
1. Entry 🚀
"The vault swings wide—yank that Bull loot at any price!"
Drop your buy-limit orders within the next 15–30 min (or at the latest swing low/high). Don’t sleep—set chart alerts for the perfect breach.
2. Stop‑Loss 🛑
Thief-style SL lurks at the nearest 5h swing‑low wick (≈ 0.60400) for intra‑day.
Adjust your SL based on your risk appetite, position size, and combo of orders.
3. Target 🎯
Aim to escape by 0.62000, or bail early for safety.
4. Scalpers’ Edge 🔍
Only rob on the long side. Big bankroll? Go all‑in. Prefer safety? Slide into the swing crew with a trailing SL to lock in your spoils.
🔍 Market Intel
Why the Kiwi Loot is Ripe:
Bullish momentum marches on, fueled by macroeconomic clues, COT data, sentiment shifts, inter-market moves — all pointing upward.
📚 For Full Recon:
Dive into the fundamental, macro, COT, quant, sentiment & intermarket intel — plus trend targets and scorecards. Check the data here 👉🔗🔗
⚠️ Caution Zone
News Watch & Position Safety:
Major news = guarded vault. Don't open new trades during release windows.
If you're in already, use trailing stops to shield your haul and lock in gains.
💪 Support the Crew
Smash that “Boost” to fuel our team and keep the raid running smooth. With Thief Trading Style, every day’s a payday.
🗓️ Stay tuned for the next Kiwi Heist – we’re just getting started. Happy robbing, legends! 🐱👤💥
AUDJPY Bullish Channel Still Intact, Eyeing Breakout Above 95.00AUDJPY continues to respect its ascending channel, with the current bounce occurring right at the 61.8% Fibonacci retracement and lower trendline support. The structure supports further upside as long as price holds above the 94.00–93.80 zone, with targets set toward 94.77 and 95.36, potentially extending to 95.63 highs.
🧠 Fundamentals:
AUD Strength Drivers:
RBA remains relatively hawkish vs other G10 banks.
Australia's data this week (retail sales, NAB confidence) were mixed, but no rate cut pricing in the near term supports AUD.
Iron ore demand showing resilience despite Chinese slowdown concerns.
JPY Weakness Drivers:
BoJ remains ultra-dovish. No action expected in July.
Japan’s inflation remains tame; the yield gap with other majors keeps widening.
Risk-on sentiment reduces demand for safe-havens like JPY.
🔍 Technical Structure:
Strong upward channel since early June remains valid.
Current pullback held the 61.8% Fib retracement of the June-July leg.
Bullish engulfing near support confirms entry.
Immediate resistance at 94.77 → 95.36 → potential breakout to 95.63.
Invalid if price closes below 93.80 (channel break).
⚠️ Risk Factors:
Risk-off shift (e.g., geopolitical escalation or U.S. CPI surprise) may boost JPY.
China growth fears can weigh on AUD.
A sudden dovish shift from the RBA would invalidate bullish fundamentals.
🔁 Leader/Lagger Dynamics:
AUDJPY typically leads other yen crosses (e.g., NZDJPY, CADJPY) during risk-on moves. It’s also a barometer for broader risk sentiment, often following moves in equity indices like US500 or commodity-linked assets.
✅ Trade Bias: Bullish
TP1: 94.77
TP2: 95.36
TP3 (aggressive): 95.63
SL: Below 93.80
Event to Watch: China data this week + U.S. CPI (Jul 11)
📌 Watch for a strong bullish daily candle above 94.77 for continuation confirmation. Stay nimble around key global risk events.

Swiss Vault Job: GBP/CHF Entry Blueprint Unlocked🕵️♂️💼 GBP/CHF: The Swiss Vault Infiltration Protocol 💼🕵️♂️
(Swing/Day Plan — Executed in Silence, Paid in Profits)
🌟Hi! Hola! Ola! Bonjour! Hallo! Marhaba!🌟
Dear Money Makers & Silent Operators, 🤑💰💸✈️
Welcome to the Thief Trading Syndicate's Strategic Playbook – today’s mission targets the GBP/CHF vault. We’ve cooked up a master plan powered by our signature blend of technical finesse and stealthy macro-insight. This setup is based on institutional footprints and high-stakes zones where liquidity flows like digital gold.
📊 Current Bias:
🟥 Bearish weight remains, but we smell bullish smoke beneath — reversal setups in play.
📈 Entry Strategy:
Long (Bullish) — Scout entry above 1.06500+ in higher timeframes (4H+). Retest confirmation required.
Short (Bearish) — “The vault’s unguarded! Slip in short anywhere up top—clean sweep mode.”
🛑 Stop Loss Placement:
Place SL near recent swing highs/lows on the 5H chart (swing basis). Customize per lot size and multiple entries. Your risk defines your escape rope.
🎯 Profit Extraction Target:
Long TP: Aim for the 1.11500 vault door (or vanish before it slams).
Short TP: Dive to 1.06500, or pull the plug earlier if guards wake up.
📰 Strategic Conditions:
This pair’s behavior is currently driven by mixed macro triggers — smart money positioning (COT), sentiment clusters, and market structure traps.
→ For full details: Fundamental macros, COT leaks, sentiment drift, and institutional zones — check your sources.
🚨 News & Risk Protocols:
No new entries during red-folder events.
Use trailing stops to lock loot and run.
💥 Boost Our Bandits!
Smash that ❤️ to strengthen our robbing force. Each tap fuels future missions. No indicators. Just raw street-smart trading edge.
👀 More heists incoming. Stay low. Stay sharp. Stay profitable. 🐱👤🎯📈

Exclusive: GBP/USD Swing Heist – Limited-Time Opportunity!🏴☠️ GBP/USD HEIST ALERT: Bullish Loot Grab Before the Cops Arrive! 🚨💰
🌟 Attention, Market Pirates & Profit Raiders! 🌟
"The vault is unlocked—time to swipe those pips!"
🔥 THIEF TRADING STRATEGY (Swing/Day) 🔥
Based on high-risk, high-reward technical & fundamental analysis, here’s the master plan to plunder GBP/USD ("The Cable")!
📈 ENTRY (Bullish Heist Zone)
"The vault is OPEN!" – Long at any price, but for precision:
Buy Limit orders preferred (15m-30m timeframe).
Pullback entries from recent swing lows/highs = sneakiest loot grab!
🛑 STOP LOSS (Escape Route)
Thief SL: Nearest swing low (4H chart).
Adjust based on: Risk tolerance, lot size, & number of orders.
"A good thief always has an exit plan!"
🎯 TARGETS
1.37500 (or escape early if the cops 🚓 (bearish traps) show up!).
Scalpers: Only long-side raids! Use trailing SL to lock profits.
💥 WHY THIS HEIST? (Bullish Momentum)
Technicals + Fundamentals align for a potential breakout.
Overbought? Risky? Yes—but the best loot is guarded!
📢 TRADING ALERT (News & Risk Mgmt)
Avoid new trades during high-impact news (volatility = police sirens!).
Trailing stops = Your getaway car. Protect profits!
🚀 BOOST THE HEIST!
💖 Hit "Like" & "Boost" to fuel our next raid!
💬 Comment your loot tally below!
"Stay sharp, thieves—see you at the next heist! 🤑🔥"

"USD/CHF Breakout - Real Deal or Trap?"🏦 SWISS BANK HEIST: USD/CHF BULLISH LOOT GRAB 🚨
(Professional Money Snatching Strategy)
🦹♂️ Attention All Market Bandits!
(Hola! Oi! Salut! Hallo! Ahlan!) 🎭💰
🔥 Thief Trading Intel Confirmed!
The USD/CHF "Swissy" vault is ready for cracking! Our bullish robbery plan targets 0.84500 - but we must escape before the bears (police) set their trap!
🔓 ENTRY: CRACKING THE SAFE
"0.82800 MA is the vault door!"
✔ Option 1: Buy Stop above MA (breakout play)
✔ Option 2: Buy Limit at swing low (15m/30m pullback)
🔔 Pro Tip: Set alerts - real thieves never miss their heist!
🚨 STOP LOSS: POLICE EVASION PLAN
📍 Thief SL: 0.81900 (below 3H swing low)
⚠️ Warning: No SL before breakout! You'll trigger the alarms!
💎 TARGET: ESCAPE WITH THE LOOT
🎯 Primary Take: 0.84500
💰 Scalpers: Long-only! Trail SL like a getaway car!
📊 MARKET CONDITIONS
⚖️ Neutral Trend (but bullish potential brewing!)
🔍 Key Intel Needed: COT reports, macro data, CHF safe-haven flows
🌐 Full Briefing: Bi0 linkss 👉🔗 (don't go in blind!)
🚦 RISK MANAGEMENT PROTOCOLS
• ❌ Avoid trading during news events
• 🔒 Always use trailing stops
• 💣 Position size = your explosive potential
🦾 SUPPORT THE SYNDICATE
💥 SMASH THAT BOOST BUTTON!
💬 Comment your heist results below!
🔔 Next robbery coming soon - stay tuned!
🤑 Remember thieves: Book profits before the Swiss police arrive!

"CHF/JPY Bullish Trap? We’re Stealing Profits Anyway!"🔥 Swiss-Yen Bank Heist: Bullish Loot Grab! (CHF/JPY Master Plan) 🔥
🌟 Hi! Hola! Ola! Bonjour! Hallo! Marhaba! 🌟
Attention Money Makers & Market Robbers! 🤑💰💸✈️
Based on the 🔥Thief Trading Style🔥 (technical + fundamental analysis), we’re plotting a bullish heist on the CHF/JPY "Swiss-Yen" Forex Bank. Follow the strategy on the chart—long entry is our golden ticket! Target? The high-risk Red Zone—where police traps, overbought signals, and bearish robbers lurk. But we’re sneaky thieves… and we always get the loot! 🏆💸
📈 Entry: "The vault is wide open!" Swipe bullish gains at any price—the heist is LIVE!
Pro Tip: Place buy limit orders within 15-30 min (swing lows/highs).
🛑 Stop Loss:
Thief-style SL at recent 4H swing low (174.100) (Day/scalping trade)
Adjust based on your risk, lot size, and multiple orders.
🎯 Target: 177.200 (Time to cash out!)
🧲 Scalpers: Eyes here! 👀
Only scalp LONG.
Big money? Charge in! Small budget? Join swing traders and execute the robbery.
Trailing SL = Your money’s bodyguard. 💰
Why CHF/JPY?
Bullish momentum fueled by:
Fundamentals (COT reports, macro trends)
Sentiment + Intermarket analysis (Check our bioo for deep dives! 🔗👉👉👉)
⚠️ Trading Alert: News = Chaos! 📰🗞️🚫
Avoid new trades during major news.
Trailing stops = Profit protector.
💖 Support the Heist!
Smash the Boost Button! 💥
Strengthen our robbery squad. Steal profits daily with the Thief Trading Style! 🏆💪🚀
Stay tuned—another heist drops soon! 🤑🐱👤🤩

EUR/CAD Raid Alert: Last Chance to Loot This Bullish Breakout!🏴☠️ EUR/CAD LOOT ALERT: Can We Steal 100 Pips Before the Trap Springs? (Thief Trading Blueprint)
🌟 Hola! Bonjour! Ciao! Hallo! Marhaba! 🌟
Attention Forex Bandits & Loonie Raiders! 💶🦫💰
🔥 Thief Trading Intel: We're targeting EUR/CAD for a MA breakout heist! Long entry only - eyeing that 1.57200 breakout level. High-risk MA Zone ahead: overbought, consolidating, perfect for our ambush.
"Take your pips and vanish - this steal's on the house!" 💨💵
🚪 ENTRY: The Trap is Set!
📈 "Wait for MA breakout at 1.57200 - then STRIKE!"
Option 1: Buy Stop above MA (breakout confirmation)
Option 2: Buy Limit at swing levels (15-30 min TF)
📌 Pro Thief Move: SET THOSE ALERTS!
🛑 STOP LOSS: Escape Plan
🔊 "Listen up, rookies!" 🗣️
Breakout trades? NO SL until after confirmation!
Rebels: Place wherever... but sleep with one eye open! 👁️
📍 Smart Crew SL: Nearest swing low (1H TF)
🎯 TARGET: Loot & Scoot!
🎯 1.58200 (100 pips of pure profit!)
⚡ SCALPERS' QUICK HIT
👀 Long only!
Deep pockets? Raid now
Light wallet? Join swing heist
Trailing SL = Your Getaway Car! 🚗💨
📢 WHY THIS HEIST?
"Euro vs Loonie" showing strength! Watch for:
COT data & Macro trends
Intermarket analysis
Sentiment shifts
🔗 Full dossier? Bio0 links below! 👉🏻☝🏻👉🏻☝🏻
⚠️ WARNING: News = Police Raid! 📰🚨
CAD news moves fast! Protect your stash:
❌ No new trades during news
🔒 Trailing stops = Handcuff-proof profits
💖 SUPPORT THE CREW!
💥 SMASH THAT BOOST BUTTON! 💥
More boosts = bigger future scores!
Stronger crew = more pips for all!
Next currency heist coming soon... 💶🔫

GBP/USD HEIST ALERT: Bullish Breakout or Bearish Trap?🌟 Hey! Hola! Ola! Bonjour! Hallo! Marhaba! 🌟
Calling all Market Robbers & Profit Pirates!💸💰
🔥 Thief Trading Intel: Our crew’s latest heist targets GBP/USD "The Cable"—bullish breakout incoming! Long entry only. High-risk Red Zone ahead: overbought, consolidating, and ripe for a reversal. Don’t get caught in the bear trap! 🏴☠️
"Take your loot and run, trader—you’ve earned this steal!" 💪🎯
🚪 ENTRY: The Heist Begins!
📈 "Wait for MA breakout (1.36000) then STRIKE—bullish profits await!"
Option 1: Buy Stop above Pink Resistance (breakout confirmation).
Option 2: Buy Limit at swing low/high (15-30 min TF).
📌 Pro Tip: SET AN ALERT! Don’t miss the breakout.
🛑 STOP LOSS: Escape Route
🔊 "Yo, listen up! 🗣️
Buy Stop orders? NO SL until after breakout! 🚀
Rebels: Place SL wherever—but you’ve been warned! ⚠️🔥
📍 Thief SL (Smart Crew): Recent/swing low (1.35000, 4H TF).
📍 Adjust based on your risk, lot size, and orders.
🎯 TARGET: Loot & Exit!
🎯 1.37500 (or escape early if the market turns!)
⚡ SCALPERS’ QUICK GRAB
👀 Long scalps ONLY!
Big wallets? Raid now.
Small stacks? Join swing traders.
Trailing SL = Your Money Shield! 🛡️💰
📢 WHY THIS HEIST? (GBP/USD Bullish Momentum)
"The Cable" is heating up! Key drivers:
Fundamentals (COT, Macro Data)
Sentiment & Intermarket Trends
Future Targets & Score Outlook
🔗 Full intel? Bio links below! 👉👉
⚠️ TRADING ALERT: News = Danger Zone! 📰🚨
News = Volatility Spikes! Protect your loot:
❌ Avoid new trades during news.
🔒 Trailing SL = Profit Lock.
💖 SUPPORT THE HEIST CREW!
💥 SMASH THAT BOOST BUTTON! 💥
More boosts = easier money grabs!
Stronger crew = bigger heists!
Profit daily with Thief Trading Style! 🏆🚀
Next heist coming soon—stay tuned! 🤑🐱👤🤩

NZD/CHF Heist Blueprint: Snag the Kiwi vs. Franc Profits!Ultimate NZD/CHF Heist Plan: Snag the Kiwi vs. Franc Loot! 🚀💰
🌍 Greetings, Wealth Raiders! Hola! Ciao! Bonjour! 🌟
Fellow money chasers and market bandits, 🤑💸 let’s dive into the NZD/CHF "Kiwi vs. Franc" Forex heist with our 🔥Thief Trading Style🔥, blending sharp technicals and solid fundamentals. Follow the charted strategy for a long entry, aiming to cash out near the high-risk ATR zone. Watch out for overbought signals, consolidation, or a trend reversal trap where bearish robbers lurk. 🏴☠️💪 Seize your profits and treat yourself—you’ve earned it! 🎉
Entry 📈
The vault’s open wide! 🏦 Grab the bullish loot at the current price—the heist is live! For precision, set Buy Limit orders on a 15 or 30-minute timeframe, targeting a retest of the nearest high or low.
Stop Loss 🛑
📍 Place your Thief SL at the recent swing low on a 4H timeframe for day trades.
📍 Adjust SL based on your risk tolerance, lot size, and number of orders.
Target 🎯
Aim for 0.50400 or slip out early to secure your loot! 💰
Scalpers, Listen Up! 👀
Stick to long-side scalps. Got big capital? Jump in now! Smaller stacks? Join swing traders for the robbery. Use a trailing SL to lock in your gains. 🧲💵
NZD/CHF Market Intel 📊
The Kiwi vs. Franc is riding a bullish wave, fueled by key drivers. Dig into the fundamentals, macro trends, COT reports, sentiment, intermarket analysis, and future targets for the full scoop. 🔗👇
⚠️ Trading Alert: News & Position Safety 📰
News drops can shake the market! To protect your loot:
Skip new trades during news releases.
Use trailing stops to secure profits and limit losses. 🚫
Join the Heist! 💥
Support our robbery plan—hit the Boost Button! 🚀 Let’s stack cash with ease using the Thief Trading Style. 💪🤝 Stay sharp for the next heist plan, bandits! 🤑🐱👤🎉

NZDJPY “Kiwi Poised to Fly as Japan Muddles ThroughNZDJPY shows a bullish breakout from a descending trendline, with bullish structure holding near 87.20–87.25.
Key resistance targets:
87.97 (Previous high)
88.64 (Next resistance / projected fib target)
Two upside scenarios are shown:
Conservative target: ~87.97
Aggressive swing: ~88.64
If 87.00–87.20 zone holds as support, expect bullish continuation.
🧩 Current Bias: Bullish
📌 Key Fundamentals Driving NZDJPY
NZD Side (Strengthening):
RBNZ hawkish hold: RBNZ recently kept rates at 5.50% and warned that inflation remains persistent, requiring prolonged tight policy.
Resilient NZ GDP: Stronger-than-expected GDP print signals economic resilience.
Terms of trade improvement: Commodity exports holding firm, China consumption rebound showing hints of demand recovery (see recent 618 festival sales data).
AUD correlation: AUD and NZD are moving together; if AUD strengthens, NZD often follows.
JPY Side (Weakening):
BoJ remains ultra-dovish: Despite inflation trends, BoJ is hesitant to tighten further, preferring gradual tapering.
Yen under pressure from yield differentials: Global central banks (like RBNZ, Fed) remain hawkish while BoJ is not.
Geopolitical funding flows: JPY used as a funding currency amid global volatility (carry trade boost for NZDJPY).
⚠️ Risks That May Reverse the Trend
BoJ surprise tightening rhetoric (e.g. bond purchase taper announcement).
China data deterioration, hurting Kiwi sentiment.
Sharp equity sell-off and geopolitical escalation (Yen safe-haven reversal).
📅 Important News to Watch
🇳🇿 NZ Trade Balance (upcoming)
🇯🇵 Tokyo Core CPI (Jun 28) – Critical for BoJ policy speculation.
RBNZ or BoJ member speeches (hawkish or dovish shifts)
Fed tone shift or US dollar strength spillover
🏁 Who Leads the Move?
NZDJPY could lead among yen crosses due to the RBNZ’s clear inflation fight versus BoJ’s passive stance. NZDJPY is also more responsive to commodity and global risk-on flows than EURJPY or USDJPY.

Traders, it's time to pay close attention! 🚨 USDJPY 4H Setup Alert – High-Probability Play Unfolding! 🚨
Traders, it's time to pay close attention! 🧠📊
The USDJPY pair has just perfectly tapped into a key bullish Fair Value Gap (FVG) on the 4-hour chart — a classic move in the smart money playbook. What’s more? We've just seen a clean sweep of internal range liquidity (IRL) — a textbook liquidity grab that signals potential accumulation by larger players. 💥💼
This is not just noise — it's a significant signal. The market structure is hinting at a possible shift in momentum, and bullish pressure is building. The trap has been set, the weak hands have been shaken out, and smart money may be preparing for a strong upward push. 📈🐂
🔮 What’s the next move?
All eyes are now on the external range liquidity (ERL) — a prime liquidity pool sitting above current price levels. If price accelerates toward it, this zone could act as the magnet and the catalyst for the next explosive move upward. 🚀
🔥 Key Points to Watch:
Bullish FVG reaction ✅
IRL liquidity swept ✅
Bullish market structure forming 🏗️
ERL liquidity resting overhead — potential target 🎯
Volume profile & order flow confirming accumulation? 👀
⚠️ Stay alert and don’t chase — let the setup come to you.
Smart money might already be stepping in, and if this momentum follows through, we could be witnessing the beginning of a strong leg up.
Mark your charts and monitor closely — opportunity is knocking. 📍🕵️♂️

EURUSD Long Setup – Bullish Rejection from Demand ZoneEURUSD remains supported by strong eurozone fundamentals and broad USD softness. The pair has retraced into a key demand zone around 1.1490 and is showing signs of bullish rejection. With the Fed likely to pause further rate hikes and the ECB maintaining a steady tone, the bias favors further upside toward recent highs.
⚠️ Geopolitical tensions in the Middle East (Israel-Iran conflict) have introduced mild safe haven demand, but so far the USD has underperformed versus the euro, suggesting EUR remains relatively insulated.
Watch for confirmation and entries within the blue demand box.
🔍 Technical Analysis:
Structure: Clear uptrend with higher highs and higher lows. Price retraced to a well-defined 1H demand zone between 1.1490–1.1500.
Setup: Anticipating a bounce from the demand zone targeting the recent high near 1.1620–1.1630.
Entry Zone: 1.1490–1.1500 (bullish reaction area)
Target: 1.1620–1.1630 (previous supply zone)
Stop Loss: Below 1.1439 (recent swing low)
Risk-Reward Ratio: Approximately 1:2.5
🧠 Fundamental Context (as of June 16):
EUR Bias: Bullish – ECB has paused cuts; euro is resilient despite geopolitical headwinds.
USD Bias: Bearish – Fed is on pause; soft inflation data and geopolitical risks weigh on dollar strength.
Key Drivers:
Fed dovish tone (FOMC pause, lower CPI)
Strong EU resilience despite global tensions
CHF and JPY attracting safe haven flows over USD
📅 Key Events to Watch:
US Core PCE (next major inflation readout)
FOMC commentary and Fed speakers
Eurozone CPI and sentiment data

Opportunity to buy EURUSDI see an opportunity to buy the EUR/USD pair from the support shown in the image and the target will be 1.16316

CAD/JPY "Loonie-Yen" Forex Bank Bullish Heist Plan🌟Hi! Hola! Ola! Bonjour! Hallo! Marhaba!🌟
Dear Money Makers & Robbers, 🤑 💰💸✈️
Based on 🔥Thief Trading style technical and fundamental analysis🔥, here is our master plan to heist the CAD/JPY "Loonie-Yen" Forex Bank. Please adhere to the strategy I've outlined in the chart, which emphasizes long entry. Our aim is the high-risk Red Zone. Risky level, overbought market, consolidation, trend reversal, trap at the level where traders and bearish robbers are stronger. 🏆💸Book Profits Be wealthy and safe trade.💪🏆🎉
Entry 📈 : "The vault is wide open! Swipe the Bullish loot at any price - the heist is on!
however I advise to Place buy limit orders within a 15 or 30 minute timeframe most recent or swing, low or high level for pullback entries
Stop Loss 🛑:
Thief SL placed at the recent / nearest low level Using the 30Min timeframe (104.800) swing trade basis.
SL is based on your risk of the trade, lot size and how many multiple orders you have to take.
🏴☠️Target 🎯: 106.000 (or) Escape Before the Target
🧲Scalpers, take note 👀 : only scalp on the Long side. If you have a lot of money, you can go straight away; if not, you can join swing traders and carry out the robbery plan. Use trailing SL to safeguard your money 💰.
CAD/JPY "Loonie-Yen" Forex Market Heist Plan (Scalping / Day Trade) is currently experiencing a bullishness,., driven by several key factors.☝🏻👆🏻☝🏻👆🏻
📰🗞️Get & Read the Fundamental, Macro, COT Report, Quantitative Analysis, Sentimental Outlook, Intermarket Analysis, Future trend targets..., go ahead to check 👉👉👉🔗
📌Keep in mind that these factors can change rapidly, and it's essential to stay up-to-date with market developments and adjust your analysis accordingly.
⚠️Trading Alert : News Releases and Position Management 📰 🗞️ 🚫🚏
As a reminder, news releases can have a significant impact on market prices and volatility. To minimize potential losses and protect your running positions,
we recommend the following:
Avoid taking new trades during news releases
Use trailing stop-loss orders to protect your running positions and lock in profits
💖Supporting our robbery plan 💥Hit the Boost Button💥 will enable us to effortlessly make and steal money 💰💵. Boost the strength of our robbery team. Every day in this market make money with ease by using the Thief Trading Style.🏆💪🤝❤️🎉🚀
I'll see you soon with another heist plan, so stay tuned 🤑🐱👤🤗🤩

"GBP/NZD: The Perfect Long Trade (Risk-Managed Heist Plan)"🏦💰 GBP/NZD BANK HEIST: The Ultimate Sterling vs. Kiwi Money Grab! 💰🏦
🌟 Hi! Hola! Ola! Bonjour! Hallo! Marhaba! 🌟
Attention all Money Makers & Market Robbers! 🤑💸✈️
Based on the 🔥Thief Trading Style🔥 (technical + fundamental analysis), here’s our master plan to loot the GBP/NZD "Sterling vs Kiwi" Forex Bank Heist!
📜 THE HEIST BLUEPRINT:
✅ Entry Strategy (Long Only!) 📈
"The heist is ON! Wait for the breakout above the previous high (2.25500) – then strike! Bullish profits await!"
Option 1: Place Buy Stop orders above the Moving Average.
Option 2: Use Buy Limit orders near recent swing lows (15-30 min timeframe) for pullback entries.
📌 Pro Tip: Set an ALERT for the breakout entry—don’t miss the robbery window!
🛑 Stop Loss (Listen Up!)
"Yo, thieves! 🗣️ If you’re entering on a Buy Stop, DO NOT set your SL until after the breakout! 🚀 Place it where I say (or wherever you dare 😈), but remember—your risk, your rules! ⚠️🔥"
📍 Thief SL Placement: Nearest swing low (1H timeframe) – 2.23700 (adjust based on risk & lot size).
🎯 Profit Target: 2.28700 (Time to escape with the loot!)
⚡ Scalpers’ Note: Only scalp LONG! Big wallets? Go all in. Small wallets? Ride the swing. Use trailing SL to protect your stolen cash! 💰
📰 WHY THIS HEIST? (Fundamental Edge)
GBP/NZD is showing bullish momentum due to:
Macroeconomic factors
COT Report insights
Sentiment shifts & intermarket trends
🔗 Full analysis? Check our bio0 for the deep dive!
⚠️ Trading Alert: News = Danger Zone! 📰🚫
Avoid new trades during high-impact news.
Use trailing stops to lock in profits & dodge volatility traps.
💥 BOOST THE HEIST!
💖 Support the robbery crew—SMASH THAT LIKE BUTTON! 💖
🚀 More heists coming soon—stay tuned, thieves! 🏆🤝🎉
