19.05.25 Morning ForecastPairs on Watch -
FX:GBPJPY
FX:CADJPY
FOREXCOM:COFFEE
A short overview of the instruments I am looking at for today, multi-timeframe analysis down to what I will be looking at for an entry. Enjoy!
Trade

GBPUSD - Double Top Formation in Focus?The GBP/USD pair is currently trading at 1.3278, showing signs of consolidation within a well-established range after recovering from the early April lows near 1.2700. Price action over the past month has created a series of higher lows while repeatedly testing resistance in the 1.3400-1.3450 zone highlighted by the light blue rectangle. The higher probability scenario suggests that cable is likely to make another push toward this critical resistance area, potentially forming a double top with the early May peak around 1.3450. This technical formation would be significant for traders, as a successful breakout above this double top structure could trigger a substantial bullish move, while rejection might lead to a deeper correction. However, the current market structure and momentum favor an eventual upside resolution, with the green arrow indicating a potential target above 1.3450 if buyers can muster sufficient strength to overcome this formidable resistance level.
Disclosure: I am part of Trade Nation's Influencer program and receive a monthly fee for using their TradingView charts in my analysis.

BTCUSD - Poised for New HeightsBitcoin is currently trading at $104,079.50, consolidating near all-time highs after an impressive rally from the April lows around $75,000. The price action has formed what appears to be a bullish flag pattern over the past week, suggesting a period of healthy consolidation before the next leg higher. While a short-term pullback toward the support zone highlighted in blue around $93,000-$94,000 remains possible, the higher probability scenario strongly favors a trend continuation to the upside, potentially targeting the $107,000-$108,000 range as indicated by the green arrow. The overall market structure remains decisively bullish, with Bitcoin maintaining positions above key psychological levels and showing resilience during minor corrections. Traders should view any potential dips as buying opportunities within this established uptrend, given Bitcoin's sustained momentum and the strong support zone that has formed from prior resistance levels.
Disclosure: I am part of Trade Nation's Influencer program and receive a monthly fee for using their TradingView charts in my analysis.

XAUUSD - Critical Reaction Zone to Determine Next Major MoveGold is currently trading at $3,202.25, showing recovery momentum after forming a recent bottom near $3,120. The price action suggests a continued upward movement toward the highlighted "important reaction area" around $3,240-3,260, which previously served as both support and resistance in mid-May. There is a high probability that price will reach this critical zone given the current bullish momentum and the established pattern of higher lows. Once gold reaches this reaction area, traders should exercise patience and closely observe how price behaves – a decisive break above could trigger an extended rally toward $3,360 as indicated by the upper green arrow, while rejection might initiate a significant correction toward $3,140 as marked by the red arrow. The market's response at this important reaction area will likely determine gold's directional bias for the next trading period, making it essential to watch for specific candlestick patterns, volume spikes, or momentum shifts before establishing new positions.
Disclosure: I am part of Trade Nation's Influencer program and receive a monthly fee for using their TradingView charts in my analysis.

GBPJPY - Poised for Rebound at Major Trendline Support?The GBP/JPY pair is currently trading around the 193.41 level, showing consolidation after a notable correction from its recent peak of approximately 196.30. The clearly defined ascending trendline, which has supported price action since mid-April, remains the critical technical feature to monitor. As the price approaches this trendline support, traders should watch for potential bullish reactions that could propel the currency pair back toward the upper resistance zone marked by the pink rectangle near 196.50. The green arrow suggests a potential path forward with an expected bounce from the trendline followed by renewed upward momentum. However, any decisive break below this trendline would invalidate the bullish structure and possibly trigger a deeper correction toward the lower support zone around 190.50, highlighted by the light blue rectangle.
Disclosure: I am part of Trade Nation's Influencer program and receive a monthly fee for using their TradingView charts in my analysis.

USDJPY - Trendline Support to Determine Next Big MoveThe USD/JPY pair has been trading within a well-defined upward trajectory, currently testing key levels around 145.68. The diagonal trendline visible on the chart serves as a critical support level that has consistently propelled the pair higher since mid-April. Should the price respect this trendline in the coming sessions, we could see a temporary pullback before potentially rallying toward the resistance zone around 148.50, highlighted by the upper purple rectangle. However, traders should closely monitor any breaks below this trendline as it would signal a significant shift in momentum and possibly indicate a deeper correction. The pair appears to be consolidating after the recent pullback from May highs, with the trendline interaction likely determining the next directional move.
Disclosure: I am part of Trade Nation's Influencer program and receive a monthly fee for using their TradingView charts in my analysis.

Gold Price Analysis May 16Yesterday's D1 candle pulled back within the uptrend with a liquidity sweep to 3121. Today there is unlikely to be a sell-off and the price will continue to return in the uptrend.
Today, it is better to mainly look for retest points for BUY signals.
In the immediate future, 3198 is the first BUY zone that the Asia-Europe session can consider. When breaking this zone, buy entries may not carry long TP expectations. The Breakout zone of 3153 and the bottom zone of 3125 are two important supports to prevent the gold price from a downward slide.
In the opposite direction, the Asian session resistance zone around 3254 also acts as an immediate barrier for the gold price increase. Break 3254 should not BUY until the 3288 zone before SELL Scalping can be done. The upper barrier of the Daily Frame is at 3320.

US30 SHORT1. This is the deciding factor as it is at the high created last week and should have a lot of resistance
2. M15, M30 and H1 are overbought and there is a double top with divergence
3. This is a type 2 pattern on H4 however there is a smaller pattern on M15 below
4. Stop loss of 200 pips

Global gold rises over 1% as the US dollar and US economic data Global gold OANDA:XAUUSD rises over 1% as the US dollar and US economic data weaken
Gold prices rose more than 1% on Thursday (May 15), supported by a weaker US dollar and weak US economic data, while Russian President Vladimir Putin’s absence from peace talks prompted some safe-haven buying.
At the close of trading on May 15, spot gold $TVC:XAU-AMEX:USD contracts gained 1.2% to $3,226.6 per ounce, after touching a more than one-month low earlier in the session. Gold FX:XAUUSD futures advanced nearly 1% to $3,218.70 per ounce.
The US dollar index fell 0.1%, making gold, which is priced in the greenback, less expensive for holders of other currencies.
Data showed that the US Producer Price Index (PPI) unexpectedly declined in April, while retail sales growth slowed. Earlier this week, a report showed that the Consumer Price Index (CPI) rose less than forecast in April.
The market is pricing in the expectation that the US Federal Reserve (Fed) will cut interest rates in September. Lower interest rates boost gold’s appeal as it is a non-yielding asset.
Thursday’s data added to the chances of a Fed rate cut, with more dovish expectations forming in the market.

Gold is under pressure as the US dollar strengthensGold $TVC:XAU-AMEX:USD is under pressure as the US dollar strengthens and trade optimism spreads across the market. Prices slipped slightly early Wednesday as investors took profits after a rise from last week’s lows. Although US inflation came in lower than expected, the Fed’s lack of plans to cut interest rates anytime soon keeps gold OANDA:XAUUSD from gaining momentum. At the same time, optimism about new trade agreements between the US, China, the UK, and other countries, along with hopes for peace talks between Russia and Ukraine, are reducing demand for gold as a safe-haven asset.
Technically, the overall trend looks bearish. There’s no significant rebound from the support zone, indicating that selling pressure still dominates. Currently, prices are consolidating sideways before potentially testing the 3200 level.
Key resistance levels are at 3243, 3257, and 3269, while support is concentrated around 3222 and 3200.
If prices continue to fluctuate within the current range and test the 3222-3200 support zone, the downtrend is likely to persist in the short to medium term. However, it’s important to note that the market may create short-term “short squeezes” around resistance zones to challenge traders before prices fall further.
Wishing everyone successful and effective trading!

EUR IS DANGER!!!!We are in the final phase of a major correction that has been ongoing for over 10 years. Prepare for significant instability in this region!!!!!! And take care of yourselves.
The only way this scenario would be invalidated is if the 1.26 mark is crossed — which is highly unlikely.


EUR/GBP Caper: Bearish Breakout Blueprint!🌍 Greetings, global money heisters! 🌟 Welcome to the EUR/GBP "Chunnel" Forex Market caper! 🤑💸
Dear traders and fortune chasers, get ready to execute our cunning plan based on the 🔥 Thief Trading Style 🔥, blending sharp technicals with savvy fundamentals. Our mission? A slick short entry targeting the high-risk Support Zone. The market’s oversold, consolidation’s brewing, and a trend reversal’s lurking—perfect for our ambush! 🏆🎯 Here’s the blueprint to steal those pips! 🚀
Entry 📈: The heist kicks off at the Major Support breakout. Lock in your sell at 0.84000 for bearish gains! 💰 For precision, set sell stop orders above the Moving Average or sell limit orders post-breakout within a 15/30-minute window near the swing low/high for pullback entries. 📌 Pro tip: Set a chart alert 🚨 to catch the breakout moment!
Stop Loss 🛑: Stay sharp, crew! For sell stop orders, hold off on placing your stop loss until the breakout confirms. 📍 Place it at the nearest swing high/low on the 4H timeframe (0.84400) for swing/day trades. Adjust based on your risk, lot size, and multiple orders. Play smart—your capital, your rules! ⚠️🔥
Target 🎯: Aim for 0.83500 or slip out early if the market whispers an escape. 🏃♂️💨
💵 Why’s the Chunnel ripe for the taking? The EUR/GBP’s in a bearish groove, driven by key market signals. Curious? Dive into the fundamentals, COT reports, sentiment, and intermarket analysis for the full scoop! 🌎🔗 Check linkk macro trends and future targets & overall score. 📊
⚠️ Trading Alert: News can shake the market like a getaway car! 📰🚗 Avoid new trades during high-impact releases and use trailing stops to lock in profits and shield your positions. Safety first, heisters! 🚫🔐
💖 Boost our heist! Hit that Boost Button 🚀 to fuel our Thief Trading crew. With daily market raids, we’re stacking pips and living the trader’s dream! 🤑🤝 Stay tuned for the next caper—more profits await! 🐱👤🎉
Happy heisting, and let’s make those charts bleed green! 💪🌟

Hello...old friend $MBLY = 55%+ Upside!Hello...old friend NASDAQ:MBLY
Breaking out of Bearish weekly downtrend dating back to December 2023!
Coming back to retest...if we bounce of this retest I will be entering Mobileye in the trading portfolio.
Rising Wr$ and Buy signal on H5_L indicator. Finally volume shelf with GAP above!
Targets: $20/ $24/ $28 🎯

A wave of bargain hunting is giving short-term support to gold April’s U.S. CPI came in below expectations, cooling down hopes for Fed rate cuts. The U.S. Dollar index has also eased off its one-month high, while ongoing geopolitical concerns continue to back gold’s rise. On Wednesday morning (May 14), spot gold traded in a narrow range around $3,245 per ounce.
Inflation Data
April’s U.S. CPI rose only 0.2%, less than the expected 0.3%. This boosted gold as it doesn’t reduce the chances of Fed rate cuts, with markets still expecting cuts to continue in September. However, inflation could pick up again in the coming months due to tariff effects, so many investors still see gold as a solid hedge against inflation.
On Tuesday, both Do Nam Trung and Trump called on the Fed to cut rates.
Geopolitical Situation
Geopolitical tensions remain a strong support for gold. Talks between Ukraine and Russia are still uncertain, and although the India-Pakistan conflict has paused with a ceasefire, tensions haven’t eased much. These risks keep gold’s upside potential alive if markets face sudden shocks.
Gold Outlook
Gold faces three main challenges:
Progress in U.S.-China trade talks — even with a 90-day truce, tariffs remain in place.
Fed monetary policy — mild inflation data could pave the way for rate cuts.
Global geopolitical risks — especially the Russia-Ukraine peace talks and India-Pakistan tensions.
There’s little major economic data today. U.S. Secretary of State Rubio will attend a NATO meeting to discuss security priorities and the Russia-Ukraine war, while several Fed officials will speak, so investors should stay alert.
Technical Analysis (XAU/USD)
On the daily chart, gold is trading within a narrow range with short-term bearish pressure from the 21-day EMA. The 0.50 Fibonacci retracement near $3,228 is key support limiting further drops. If this level breaks, gold could fall toward $3,163.
For a new uptrend, gold needs to climb above the EMA21 and break through the $3,300 level.
Key levels to watch:
Support: 3,228 – 3,200 – 3,163 USD
Resistance: 3,245 – 3,292 – 3,300 USD
Wishing you a productive and successful trading day!

XAUUAD UPDATE 15-5-2025This chart is a technical analysis of CFDs on Gold (US$/OZ) with a 1-hour timeframe. Here's a breakdown of the key elements:
Chart Patterns:
1. Falling Wedge Pattern:
A clear falling wedge is outlined with blue trendlines converging downward, typically a bullish reversal pattern.
The price has tested the lower boundary multiple times, suggesting a strong support zone.
2. Projected Breakout:
An upward arrow indicates a possible breakout from the wedge.
The breakout zone appears to aim for the 3,473.994 level, marked with a red line.
A potential rally target is highlighted in a yellow zone, between approximately 3,400 and 3,500.
3. Support & Resistance:
Support: Around 3,122.690 (green line at the bottom).
Resistance: Approximately 3,261.270, with further resistance near 3,473.994.
4. Volume:
There’s steady volume activity, which could indicate accumulation before a breakout.
5. Fib Level:
A Fibonacci retracement level around 0.793, often used to confirm reversal zones.
6. US Economic Events:
Two U.S. flag icons suggest important economic data releases, which might trigger volatility and influence the breakout.
Conclusion:
This chart suggests a bullish outlook for gold, expecting a breakout from the falling wedge and targeting the 3,400–3,500 zone. However, the movement could be influenced by upcoming economic data, so it’s essential to watch for confirmation before acting.
Would you like an interpretation in a different format (e.g., simplified summary or trading plan)?

USD/JPY Multi-Timeframe Trading Plan – Week AheadUSD/JPY is trending higher short-term but remains below key resistance on the daily chart. The daily timeframe shows an inverted head-and-shoulders forming, with a neckline at 152. Until that breaks, rallies into 148–150 are likely to fade. The 1-hour chart shows a rising wedge from 142 to 148.5 with support around 145.0. Momentum is slowing, warning of potential exhaustion near 148.
On the 15-minute chart, recent price action shows a bull flag and a double bottom, offering buy zones at 146.10–146.30. The plan for early week is to long dips to this zone, targeting 146.80–147.20 with stops below 145.90. Watch for fades around 147.50–148.00 mid-week. A break above 148.00 opens room to 150.00; below 145.00, momentum shifts bearish.
Strategy: Buy pullbacks early in the week; fade rallies near 148 mid-week. Flip long above 148.00 or short below 145.00. Use tight stops and manage risk per trade.

MNQ losses and trading mistakes shown liveSome of my trading entries that led to losses shared here live. Leave a comment down below on your bias for MNQ today.

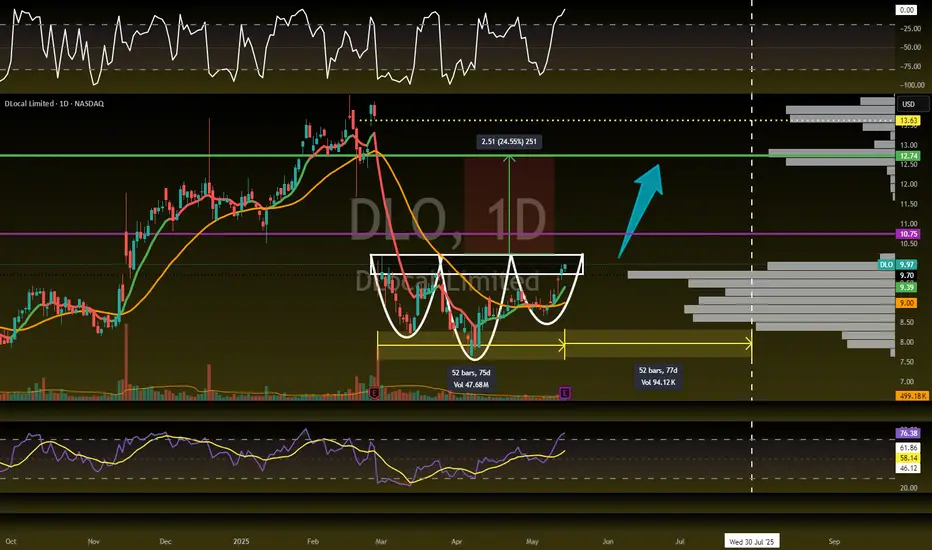
$DLO could be setting up for a MASSIVE Earnings POP!🚀 NASDAQ:DLO Chart Looking Strong into earnings!
The daily setup is looking phenomenal—while we haven’t fully broken out of the inverse H&S just yet, if we do, there’s a massive volume shelf and gap ready to launch this to $12.74—a potential 25% move!
Earning AH's!
HK50 Short 1. This trade is against the H4 trend however, there is a pattern on M15 and M30
2. All timeframes are overbought, and there is a triple top with divergence
3. This is the week's high, and it will have a lot of resistance at this level.
4. Stop loss of 200 pips
5. 1st target is at 23150

XAUUSD TRADE LINE, SELLING OPPORTUNITYHere I Created This XAUUSD Chart Analysis
Pair : XAUUSD (Gold)
Timeframe: 30 - Minutes
Pattern: Trade Line Resistance
Momentum: Bearish/ SELL
Entry Level : SELL 3238
Resistance zone : 3238
Target Will Be : 3208
Disclaimer : This signal is based on personal analysis for learning purposes. Trade at your own risk and always use proper risk management.

Technical Analysis of Bitcoin (BTC/USD) ON BINANCE + TRADE PLANTechnical Analysis of Bitcoin (BTC/USD)
Market Trend and Chart Structure:
The price of Bitcoin is in a consolidation phase as shown in the descending channel pattern formed by the resistance and support lines.
The market is moving within this range, but there is a strong possibility of a breakout to the upside based on the bullish divergence forming on the indicators and the overall market sentiment.
The chart also shows Bollinger Bands (BB), which are in a squeeze, signaling a potential breakout. Typically, this indicates that volatility is low, and the price could move sharply in either direction once the bands break.
Key Indicators and Signals:
MACD: The MACD indicator is showing a bullish crossover, which indicates the possibility of a trend reversal to the upside.
RSI (Relative Strength Index): Currently at 45.78, indicating that the market is neither overbought nor oversold. This suggests that Bitcoin is in a neutral zone, but with bullish signals from other indicators, an upward move seems likely if momentum continues to build.
ArtY Money Flow Index: The Money Flow Index is showing green bars, suggesting that capital is flowing into Bitcoin, which supports the bullish outlook.
Stochastic RSI: The stochastic is in the oversold region (currently at 14.99), which usually signals a potential reversal to the upside.
Resistance and Support Levels:
Resistance: The primary resistance level is located at $105,705. A break above this level would indicate a strong upward move.
Support: The primary support level is around $101,600. If the price reaches this level and holds, it could act as a potential bounce point for a reversal.
Trading Strategy and Plan:
Entry Strategy:
Buy Entry: Enter a long position if the price breaks above the $104,700-$105,705 range, indicating a breakout above resistance. A confirmation from the MACD and RSI would add strength to this signal.
Stop Loss: Set a stop-loss order at $101,000, below the key support, to manage risk if the market reverses unexpectedly.
Target/Exit Strategy:
Take Profit Target: A good target is at the $110,000 level, where Bitcoin could face another resistance. A more aggressive target could be at $115,000, but this would require a continuation of the bullish momentum.
Trailing Stop: Use a trailing stop as Bitcoin continues to move upward to secure profits if the price continues to climb without retracing.
Risk Management:
Maintain a risk-to-reward ratio of at least 1:3, meaning you should aim for profits that are at least three times the amount of risk you take. This will ensure better risk management in case the market reverses unexpectedly.
Monitor the market sentiment closely. Bitcoin's price movements can be highly volatile, so being ready to adjust stop-loss and take-profit levels is essential for successful trading.
Bitcoin is showing positive signs of breaking to the upside, with support from key technical indicators such as bullish MACD crossovers, oversold stochastic levels, and a neutral RSI. It’s essential to monitor the breakout above the $104,700-$105,705 level, which could signal a strong upward move. However, traders should use proper risk management techniques, such as setting stop-loss orders and managing position sizes carefully.
Always stay updated with market news and adjust your strategy based on any significant news or changes in the overall market sentiment.

CAD/CHF Short
🔻 CAD/CHF Swing Short Setup
Sell Limit Entry: 0.6040
Stop Loss: 0.6115 (above recent daily highs)
Take Profit 1: 0.5800
Take Profit 2: 0.5700
Risk-to-Reward: ~2.6:1 to TP1, ~4.5:1 to TP2
Fundamentals:
CAD is weakening from falling oil, soft economic data, and global trade risk.
CHF is gaining on risk-off sentiment and its safe-haven status.
Technical Confluence:
Monthly chart just broke below long-term support at 0.6000 for the first time ever.
Weekly chart shows price retesting 0.6000–0.6050, a perfect break-and-retest setup.
Daily shows price stalling beneath resistance without strength — no bullish breakout attempt yet.
Target Logic:
TP1 at 0.5800 is just above the panic wick zone — realistic and conservative.
TP2 at 0.5700 aligns with the extreme 2015 SNB spike low — stretch target only if momentum continues.
