Will the Fear Gauge Flash Red?The Cboe Volatility Index (VIX), Wall Street's closely watched "fear gauge," is poised for a potential surge due to US President Donald Trump's assertive policy agenda. This article examines the confluence of factors, primarily Trump's planned tariffs and escalating geopolitical tensions, that are likely to inject significant uncertainty into the financial markets. Historically, the VIX has proven to be a reliable indicator of investor anxiety, spiking during economic and political instability periods. The current climate, marked by a potential trade war and heightened international risks, suggests a strong likelihood of increased market volatility and a corresponding rise in the VIX.
President Trump's impending "Liberation Day" tariffs, set to target all countries with reciprocal duties, have already sparked considerable concern among economists and financial institutions. Experts at Goldman Sachs and J.P. Morgan predict that these tariffs will lead to higher inflation, slower economic growth, and an elevated risk of recession in the US. The sheer scale and breadth of these tariffs, affecting major trading partners and critical industries, create an environment of unpredictability that unsettles investors and compels them to seek protection against potential market downturns, a dynamic that typically drives the VIX upward.
Adding to the market's unease are the growing geopolitical fault lines involving the US and both China and Iran. Trade disputes and strategic rivalry with China, coupled with President Trump's confrontational stance and threats of military action against Iran over its nuclear program, contribute significantly to global instability. These high-stakes international situations, fraught with the potential for escalation, naturally trigger investor anxiety and a flight to safety, further fueling expectations of increased market volatility as measured by the VIX.
In conclusion, the combination of President Trump's aggressive trade policies and the mounting geopolitical risks presents a compelling case for a significant rise in the VIX. Market analysts have already observed this trend, and historical patterns during similar periods of uncertainty reinforce the expectation of heightened volatility. As investors grapple with the potential economic fallout from tariffs and the dangers of international conflicts, the VIX will likely serve as a crucial barometer, reflecting the increasing fear and uncertainty permeating the financial landscape.
Trade

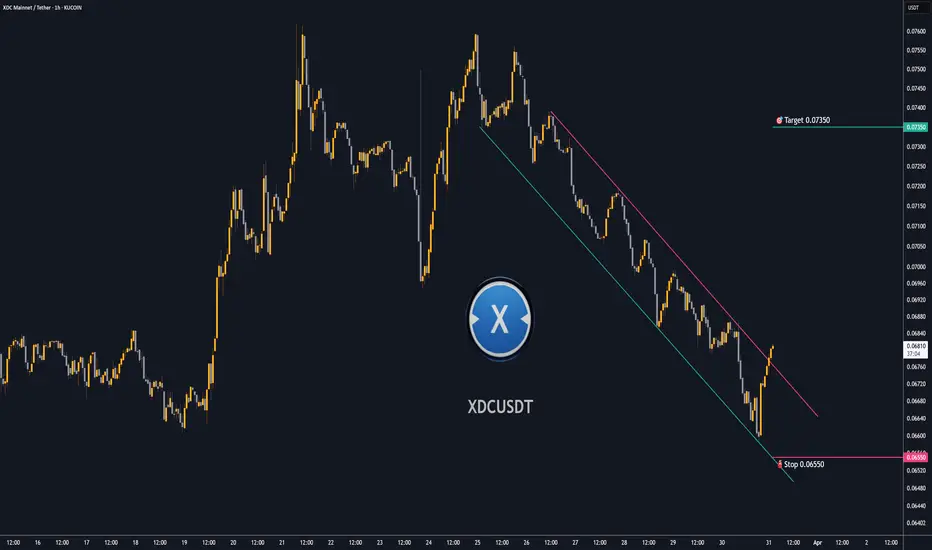
Trading opportunity for XDCUSDTBased on technical factors there is a Buy position in :
📊 XDCUSDT
🔵 Buy Now
🪫Stop loss 0.06550
🔋Target 0.07350
📏 R/R 2
💸RISK : 1%
We hope it is profitable for you ❤️
Please support our activity with your likes👍 and comments📝
EURUSD Buy Position 31 March 2025I am looking for buying opportunities on FOREXCOM:EURUSD chart. EUR is going well. On the other websites, they think about that EURUSD is going to hit 1.08550 level. I am also agree with them.
Time is a weapon. Be careful.
dzhvush

USDJPY - Critical area for the pair!The USD/JPY pair currently sits at a critical technical juncture, trading around the 149.84 level, where market participants are closely watching for directional cues. The price action has been respecting an ascending trendline since early March, suggesting underlying bullish momentum, while simultaneously testing the lower boundary of a significant resistance zone highlighted in blue on the chart. This confluence creates a decisive moment for traders – a break below the trendline could trigger another downward leg toward support near 149.00, while sustained strength above the current level might signal continuation of the uptrend toward the upper resistance band at 151.00. The chart's annotated projection suggests the possibility of one more pullback before resuming higher, making this a pivotal area for determining whether bears will gain temporary control or if bulls will maintain dominance without further consolidation.
Disclosure: I am part of Trade Nation's Influencer program and receive a monthly fee for using their TradingView charts in my analysis.

XAUUSD - Uptrend is strong, pullback for buysThe gold market is displaying remarkable strength, with the XAU/USD pair recently breaking above the $3,085 level to establish new historical highs. The upward trajectory has been supported by a robust ascending trendline dating back to late February, indicating persistent bullish momentum. While the immediate trend remains decidedly positive, technical indicators suggest a potential short-term correction may be forthcoming, which would likely present advantageous buying opportunities for traders. The highlighted support zone around $3,030-$3,040 could serve as an ideal entry point for those looking to establish long positions, with the expectation that after this healthy pullback, gold will resume its upward march toward the projected target of $3,100 and potentially beyond.
Disclosure: I am part of Trade Nation's Influencer program and receive a monthly fee for using their TradingView charts in my analysis.

Trading opportunity for GRASSUSDTBased on technical factors there is a Sell position in :
📊 GRASSUSDT
🔴 Sell Now
🪫Stop loss 1.9000
🔋Target 1.3200
📏 R/R 1,5
💸RISK : 1%
We hope it is profitable for you ❤️
Please support our activity with your likes👍 and comments📝

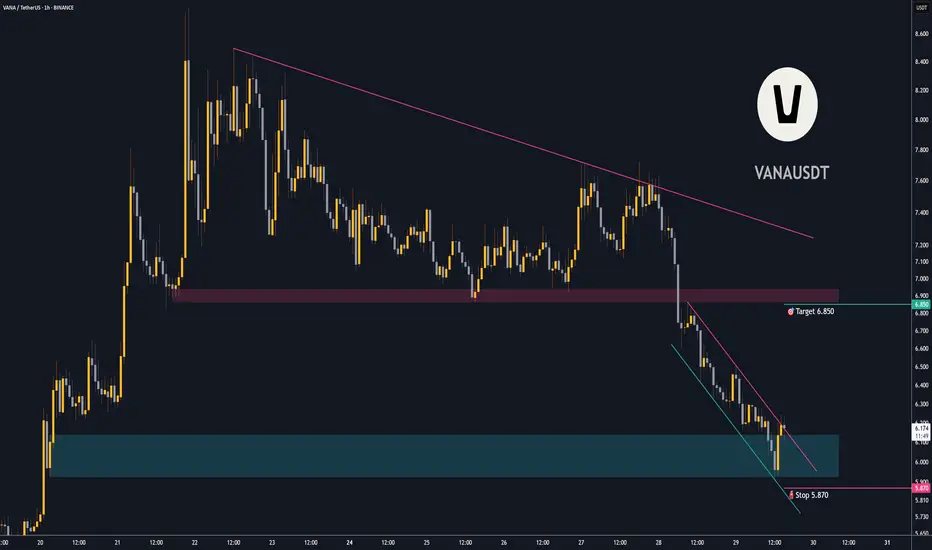
Trading opportunity for VANAUSDTBased on technical factors there is a Buy position in :
📊 VANAUSDT
🔵 Buy Now
🪫Stop loss 5.870
🔋Target 6.850
📏 R/R 2
💸RISK : 1%
We hope it is profitable for you ❤️
Please support our activity with your likes👍 and comments📝
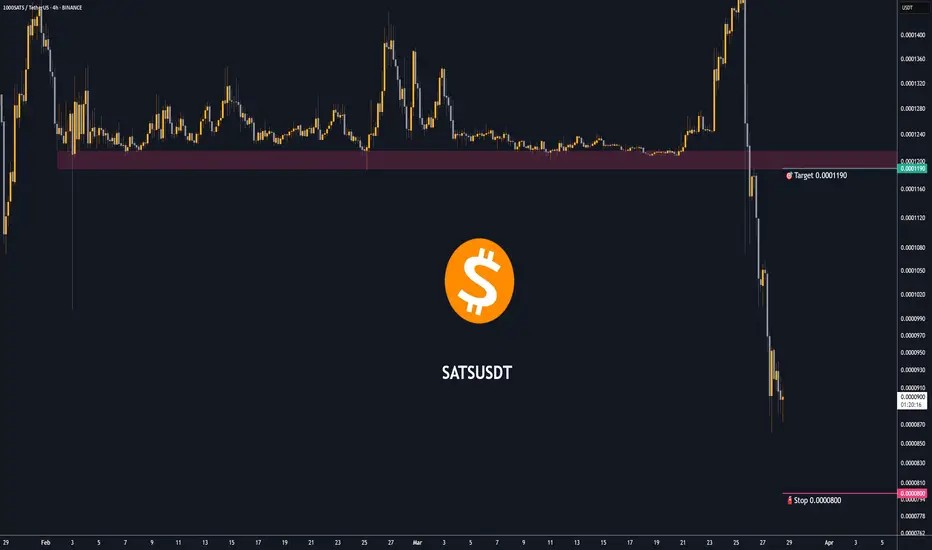
Trading opportunity for 1000SATSUSDTBased on technical factors there is a Buy position in :
📊 1000SATSUSDT
🔵 Buy Now
🪫Stop loss 0.0000800
🔋Target 0.0001190
📏 R/R 3
💸RISK : 1%
We hope it is profitable for you ❤️
Please support our activity with your likes👍 and comments📝
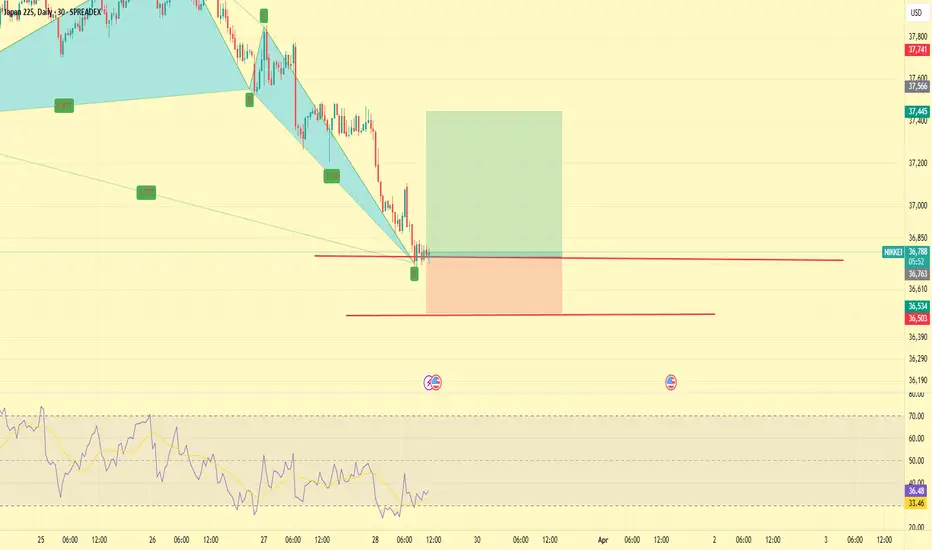
JPN225 Short 1. This trade is against the trend
2. There are multiple patterns on all timeframes
3. This trade is oversold on all timeframes
4. There is a triple bottom on M15 with divergence
5. 200 Pip stop loss
6. First target at M15 overbought since this is counter trend
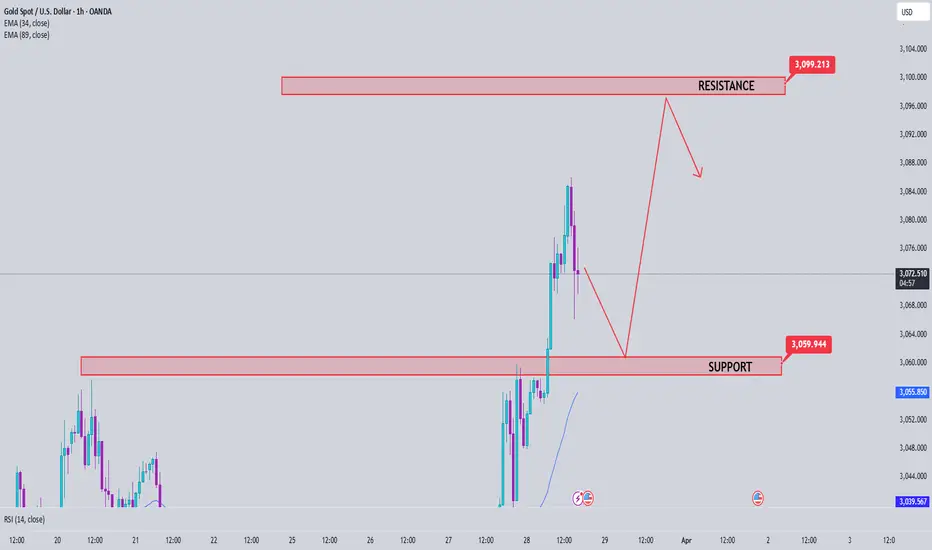
Gold Price Analysis March 28Fundamental Analysis
Gold (XAU/USD) continued its upward trend, hitting a record high of $3,086 during the European session on Friday. Global risk sentiment weakened due to concerns over US President Donald Trump's auto tariffs and uncertainty over upcoming tariffs, boosting safe-haven demand for gold.
In addition, expectations of an early Fed rate cut due to concerns over Trump's trade policies affecting US economic growth also supported gold's gains. Although the USD recovered slightly ahead of the US personal consumption expenditure (PCE) price index report, this did not reduce the appeal of XAU/USD.
Technical Analysis
Gold is quite difficult to trade around the ATH zone today. Note that the lower boundary zone of 3060 is converging with the EMA 34 zone and the SELL zone around the 3100 round-trip barrier. The basic trading strategy requires your patience as the market is not easy to trade at the moment.
28.03.25 Morning ForecastPairs on Watch -
FX:EURAUD
FX:AUDJPY
A short overview of the instruments I am looking at for today, multi-timeframe analysis down to what I will be looking at for an entry. Enjoy!

TAO SHORTDisclaimer 👉 This is my personal analysis for educational purposes , Buy/Sell/Trade at your own risk. I am not a financial Advisor

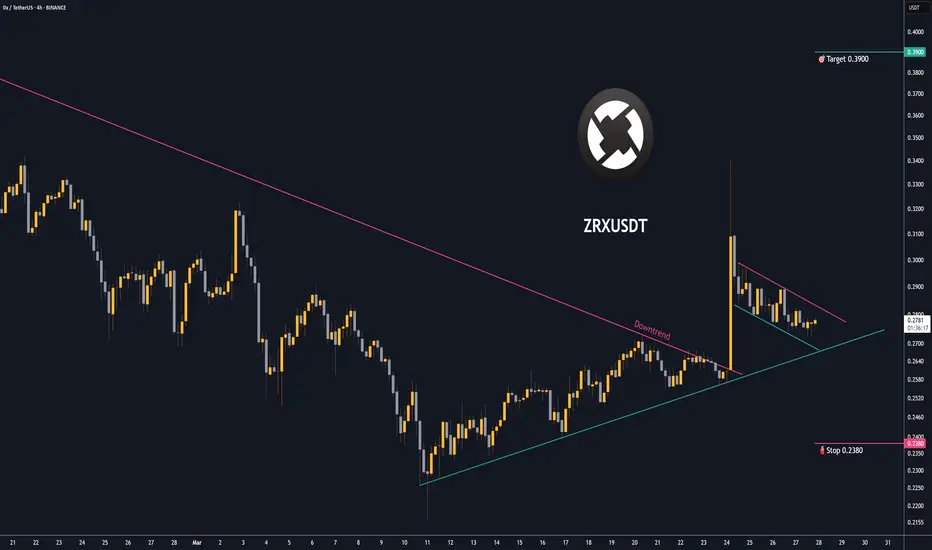
Trading opportunity for ZRXUSDTBased on technical factors there is a Buy position in :
📊 ZRXUSDT
🔵 Buy Now
🪫Stop loss 0.2380
🔋Target 0.3900
📏 R/R 2,7
💸RISK : 1%
We hope it is profitable for you ❤️
Please support our activity with your likes👍 and comments📝
Trading opportunity for Bitcoin BTCUSDT Based on technical factors there is a Buy position in :
📊 BTCUSDT
🔵 Buy Now
🪫Stop loss 85000.00
🔋Target 93000.00
📏 R/R 2,1
💸RISK : 1%
We hope it is profitable for you ❤️
Please support our activity with your likes👍 and comments📝

Trading opportunity for CTCUSDTBased on technical factors there is a Buy position in :
📊 CTCUSDT
🔵 Buy Now
🪫Stop loss 0.6100
🔋Target 0.9500
📏 R/R 2,2
💸RISK : 1%
We hope it is profitable for you ❤️
Please support our activity with your likes👍 and comments📝

Expecting 90k in BTCAs per daily chart, I'm expecting BTC to hit 90k and face resistance.
If that resistance is broken, we may see one more move towards ATH.
Given global instability, it's not that hard to imagine BTC becoming safe heaven.
There have been signs recently that BTC is getting bought in large QTY. So keeping fingers crossed and holding longs.

27.03.25 Morning ForecastPairs on Watch -
FX:NZDCAD
OANDA:XAGUSD
FX:NZDUSD
A short overview of the instruments I am looking at for today, multi-timeframe analysis down to what I will be looking at for an entry. Enjoy!

Trading opportunity for BIDUSDTBased on technical factors there is a Buy position in :
📊 BIDUSDT
🔵 Buy Now
🪫Stop loss 0.04350
🔋Target 0.08000
📏 R/R 2,6
💸RISK : 1%
We hope it is profitable for you ❤️
Please support our activity with your likes👍 and comments📝

Gold Analysis March 26Candle D still shows that the battle between buyers and sellers has not yet been defeated.
3033 Plays an important role in the current downtrend structure. H4 Closes above the 3033 zone, officially breaking the wave and giving priority to the BUY side.
Gold is pushing up and wants to break the dynamic resistance of 3027. Closes above 3027, gold is heading towards 3033-3035. If it does not break this zone, you can SELL to 3005 and if the US breaks 3005, hold to 2983. If the 3033 zone is broken, wait for BUY to break 3033, the daily target is towards 3045.

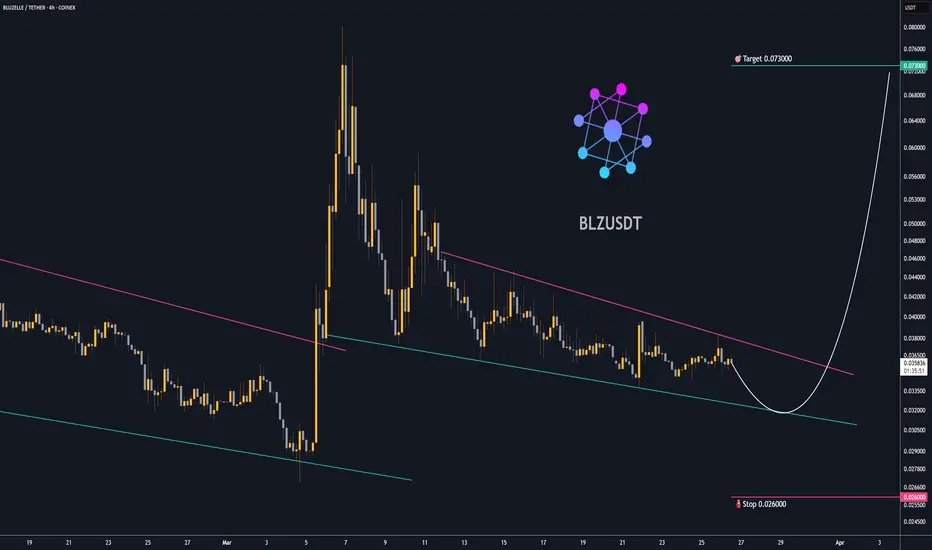
Trading opportunity for BLZUSDTBased on technical factors there is a Buy position in :
📊 BLZUSDT
🔵 Buy Now
🪫Stop loss 0.026000
🔋Target 0.073000
📏 R/R 3,8
💸RISK : 1%
We hope it is profitable for you ❤️
Please support our activity with your likes👍 and comments📝
26.03.25 Morning ForecastPairs on Watch -
OANDA:XAGUSD
FX:EURUSD
FX:NZDUSD
A short overview of the instruments I am looking at for today, multi-timeframe analysis down to what I will be looking at for an entry. Enjoy!

Trading opportunity for Tensor TNSRUSDTBased on technical factors there is a Buy position in :
📊 TNSRUSDT
🔵 Buy Now
🪫Stop loss 0.1950
🔋Target 0.2500
📏 R/R 2
💸RISK : 1%
We hope it is profitable for you ❤️
Please support our activity with your likes👍 and comments📝

Trading opportunity for AVAILUSDTBased on technical factors there is a Buy position in :
📊 AVAILUSDT
🔵 Buy Now
🪫Stop loss 0.03700
🔋Target 0.04700
📏 R/R 2
💸RISK : 1%
We hope it is profitable for you ❤️
Please support our activity with your likes👍 and comments📝
