Trade
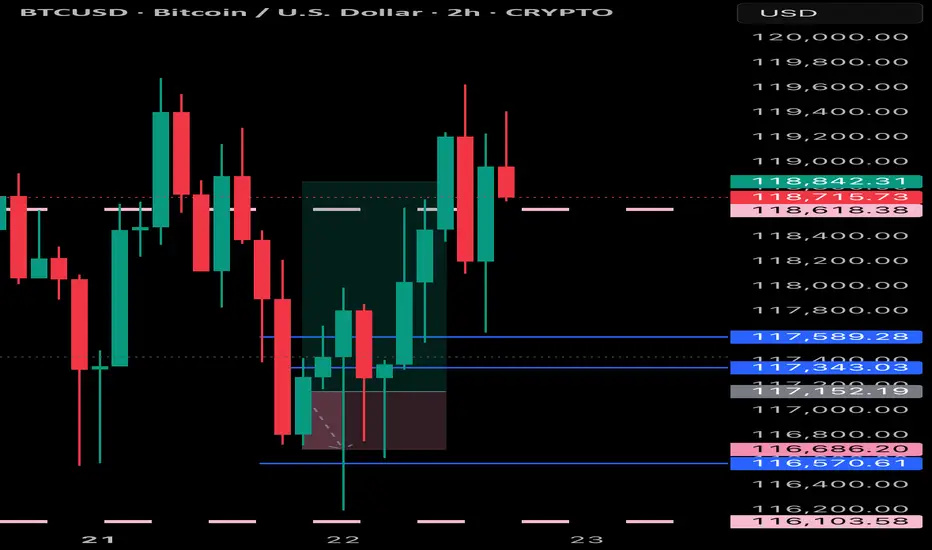
BTCUSD RECAPBITCOIN has preformed as expected in short period of time can continue even more to the up side but will wait for good entries
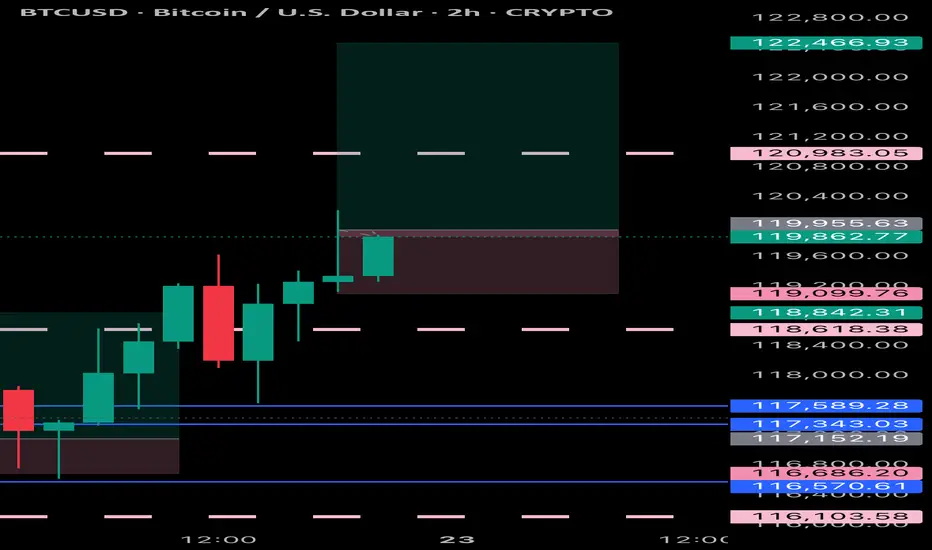
BTCUSD BTCUSD still expecting some good run within to the up side as there’s a new higher price that’s not been touched
audnzd long trade in my opinion this is a good trade with a good r/r hope hit the tp consider this is my trade not your trade and i just like to share my trades with world

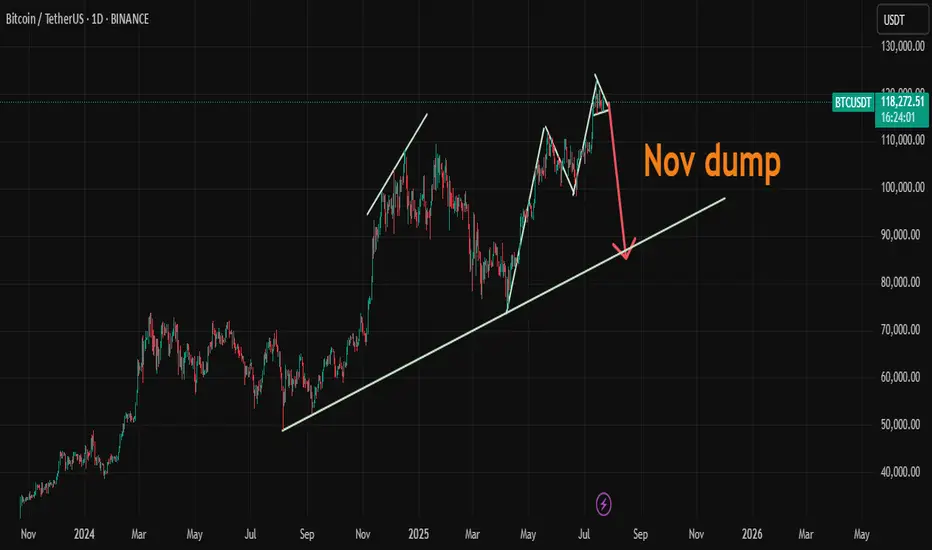
BTC/USDTHello friends, I hope you are well. We should probably expect a slight increase in Bitcoin after the big drop in the financial market, which will most likely start in November. What is your opinion?
22.07.25 Morning ForecastPairs on Watch -
FX:GBPJPY
FX:AUDUSD
OANDA:XAUUSD
FX:GBPUSD
A short overview of the instruments I am looking at for today, multi-timeframe analysis down to what I will be looking at for an entry. Enjoy!

EURUSD Bullish ProjectionIt’s been a while since my last update here.
Here’s my projection and actual entry/entries on EURUSD, based on a sweep of the previous 1H swing low and mitigation of a Daily imbalance (Fair Value Gap).
We're anticipating a full Change of Character to mark the end of the ongoing Daily pullback.

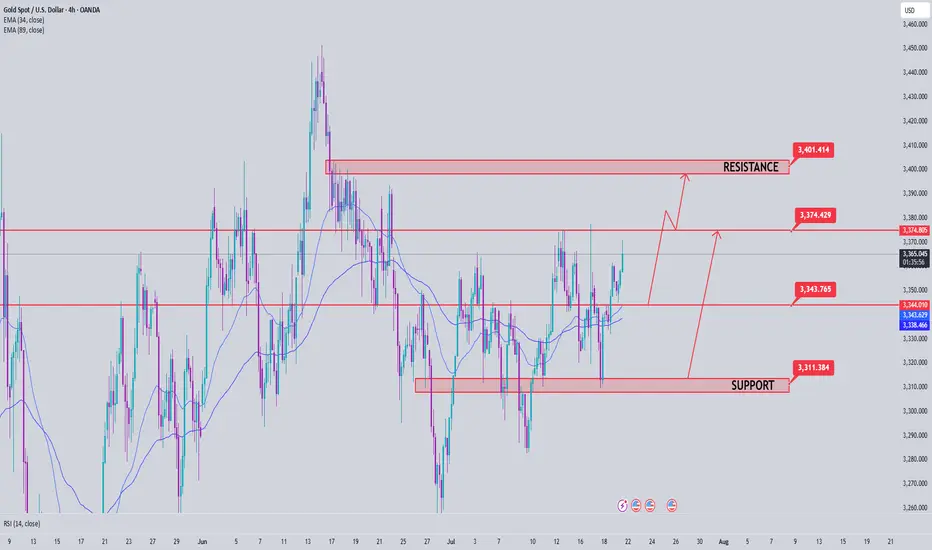
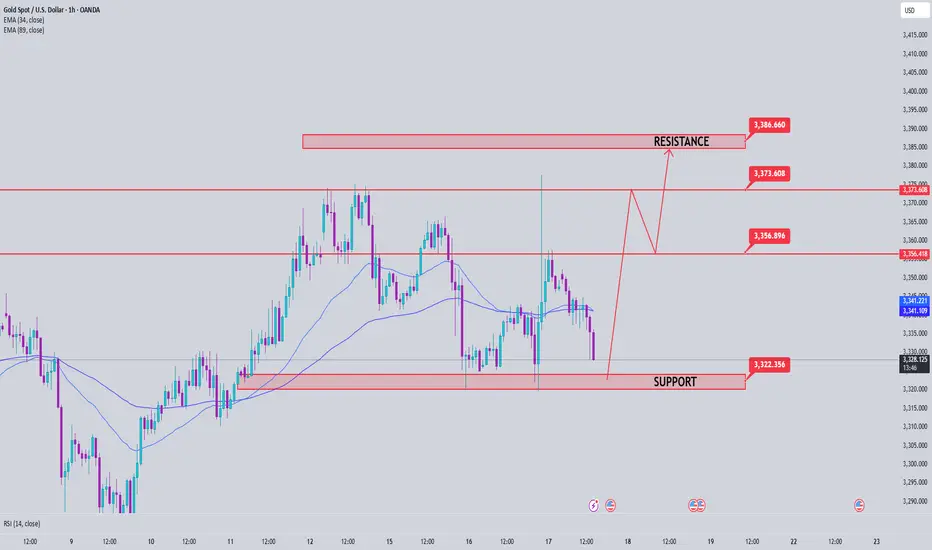
Gold Price Analysis July 21After being reinforced by CPI data last week, gold prices have regained their bullish momentum and are currently trading in a wide range. The technical structure still shows a dominant uptrend, with the trendline continuing to act as reliable support, targeting the important resistance zone of 3400 next week.
📌 Preferred trading strategy:
Watch the price reaction around the support zone of 3343. If there is a rejection signal of this zone accompanied by buying pressure, that will be the ideal entry point.
If the price continues to correct deeper, the strong support zone of 3322 will be a reasonable DCA point.
It is not recommended to SELL if the price breaks the confluence zone of 3373, as this is a signal confirming the strong bullish momentum continues.
📍 Important price zones:
Support: 3343 – 3322
Resistance: 3373 – 3400
🚀 Buy Trigger:
Price rejects 3343 zone with clear bullish signal
Strong bounce from 3322 zone
21.07.25 Morning ForecastPairs on Watch -
FX:GBPAUD
FX:EURUSD
FX:AUDUSD
OANDA:XAUUSD
A short overview of the instruments I am looking at for today, multi-timeframe analysis down to what I will be looking at for an entry. Enjoy!

$SUSDT (or S , ex FANTOM): good entry for a long setupCrypto Market Outlook
The overall crypto market is in a clear uptrend.
The money printer is running, and USD dominance is dropping — all signs pointing to a potential continuation of the rally in the coming months.
Unless a black swan event hits, it's not too late to position yourself if you’re still on the sidelines.
⚠️ Always manage your risk with a proper stop loss — altcoins move fast and can reverse just as quickly.
One interesting setup: $S
✅ Relatively new
✅ Didn’t pump too hard
✅ Broke out of its downtrend
✅ Found solid support
The Fib levels offer good targets for take profit zones.
🔍 Ideal entry: within the green box or lower.
Let the pump cool off — it could offer a perfect entry opportunity. Be patient and wait for a good position.
If $S pumps from here without retrace:
→ Jump in with a tight stop loss
→ Or look elsewhere for a better risk/reward setup.
DYOR.
#Crypto #Altcoins #Bitcoin #ETH #Trading #CryptoMarket #TechnicalAnalysis #RiskManagement #DYOR

XRPUSDT Weekly Chart Analysis | Next Bullish MoveXRPUSDT Weekly Chart Analysis | Major Resistance Levels Align for Next Bullish Move
🔍 Let’s break down the XRP/USDT weekly setup, highlighting key technical signals and major upside targets for the next rally.
⏳ Weekly Overview
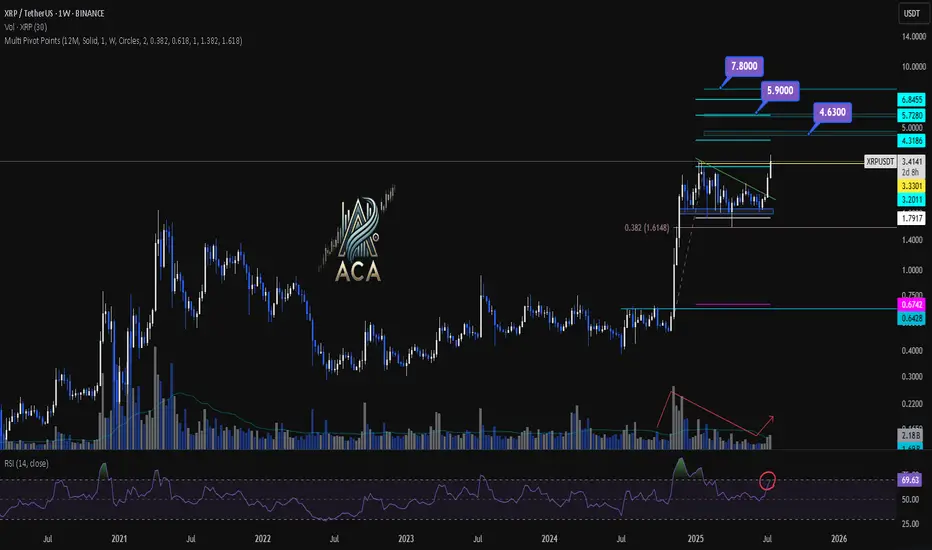
The weekly chart shows consolidation just below a major resistance, with price action tightening and preparing for a breakout. A recent correction found support near the 0.382 Fibonacci retracement level, which has acted as a springboard for renewed momentum. Notably, the R2 pivot point level aligns closely with this area, strengthening its importance as a decision zone for bulls.
🔺 Upside Targets & Confluences:
- First Target: $4.63 — This coincides with the R2 monthly pivot point and aligns with key Fibonacci extension targets, offering strong confluence for a reaction zone.
- Second Target: $5.90 — Our most realistic medium-term target, also backed by cluster resistance from both pivot analysis and fib projections.
- Final Target: $7.80 — This is the major Fibonacci extension level, marking the highest projected upside if momentum persists.
📊 Key Technical Highlights:
- Pivot Point R2 & Fibonacci Confluence: The R2 level reinforces a critical resistance, overlapping with the $4.63 Fibonacci target.
- Fibonacci Retracement: Price respected the 0.382 retracement during the latest correction, signaling healthy trend continuation.
- Volume Confirmation: An uptick in volume confirms that buyers are stepping in, supporting the bullish momentum.
- RSI Signal: RSI is entering the overbought zone, which typically indicates a strong surge in buying pressure and can mark the start of a momentum move.
🚨 Conclusion:
XRP is setting up for a major breakout as key technical levels align. Watch for a sustained move above $4.63 to unlock the $5.90 area, with a final potential push towards $7.80 if bulls maintain control. Volume expansion and an overheated RSI are both classic signs of an incoming momentum wave—keep your eyes on these levels for validation of the setup.
18.07.25 Morning ForecastPairs on Watch -
FX:GBPAUD
FX:EURAUD
FX:EURNZD
FX:EURCAD
A short overview of the instruments I am looking at for today, multi-timeframe analysis down to what I will be looking at for an entry. Enjoy!

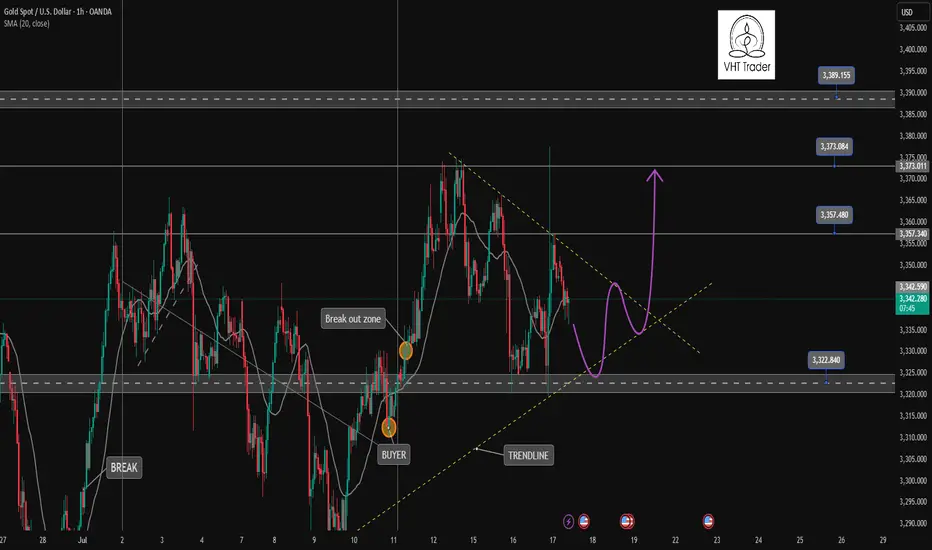
Gold returns to Sideway range waiting for new momentumOANDA:XAUUSD A sweep of liquidity back to the 3377 zone and then back into the triangle trading range. Currently, the market will wait for new momentum for the next trend. If the 3322 zone is still holding, the uptrend to 3400 is still there. This is an important price zone in today's trading day.
📉 Key Levels
BUY Trigger: rejection 3323 with bullrish confirmation
Target: 3373
SELL Trigger: Break and trading Bellow support 3321
Target: 3285
Leave your comments on the idea. I am happy to read your views.
17.07.25 Morning ForecastPairs on Watch -
OANDA:US30USD
CAPITALCOM:DE40
FX:GBPJPY
A short overview of the instruments I am looking at for today, multi-timeframe analysis down to what I will be looking at for an entry. Enjoy!

Gold Price Analysis July 17XAUUSD Analysis Today
The price has cleared the liquidity to the 3377 zone, then returned to trading within the triangle. The market is currently waiting for new momentum to determine the next trend.
✅ BUY Scenario
If the 3322-3323 zone continues to hold and there is a bearish rejection signal and confirmation of buying power, gold is expected to continue its uptrend towards the 3373 - 3400 zone.
❌ SELL Scenario
If the price breaks the 3321 support with clear selling pressure, it can extend the decline to 3285.
🔑 Key Level Today
Support: 3321 - 3323
Resistance: 3373 - 3400
💡 Strategy:
Watch the price reaction at the important support zone to decide the next action.
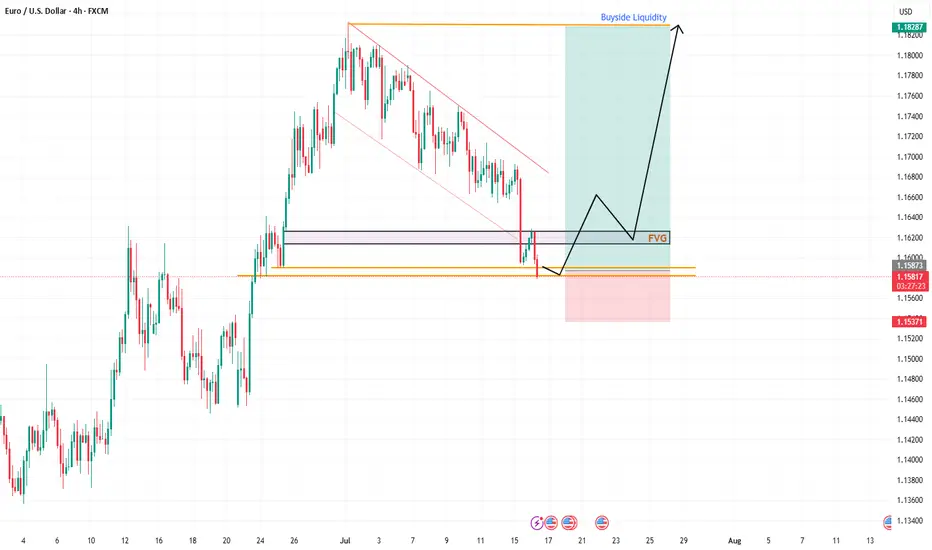
EU's Wild Drop: A Sneaky Trap or Reversal Time?Hey Fellow Traders! 😎
What a ride yesterday, right? The EUR/USD took a massive plunge, smashing through the descending channel like a wrecking ball and sweeping up all that liquidity. 💥 But hold up—was that just a clever market manipulation to shake out the bulls? I think so! 🧠
Right now, the price is chilling in a Daily Fair Value Gap (FVG), and I’m expecting some serious action here. This could be the perfect setup for a reversal! The market makers pulled a fast one—tricking bullish traders into flipping bearish after that dramatic drop. But guess what? That’s the trap! 🕸️ Don’t fall for it.
I’m eyeing a long entry right at this level. Here’s the plan:
Entry: Right now—let’s catch this wave! 🌊
Stop Loss: Set it tight around 1.15360 to keep risk in check.
Take Profit: Aiming for those juicy highs (check the chart I shared in my last post for the exact levels). 📈
This setup is screaming opportunity, so let’s talk about it! 💬 What’s your take—are we reversing or is the market still playing games? Drop your thoughts below, smash that Like button if you’re with me, and Follow for more trade ideas! 🚀 Let’s keep the community buzzing. 🐝
#Trading #EURUSD #MarketAnalysis #ReversalSetup
16.07.25 Morning ForecastPairs on Watch -
FX:GBPJPY
FX:GBPNZD
FX:USDJPY
A short overview of the instruments I am looking at for today, multi-timeframe analysis down to what I will be looking at for an entry. Enjoy!

SPX500 LongThere is a lot of support at this level
There is a shark pattern on M15 and M30
All timeframes are oversold and there are multiple bottoms with divergence
This trade is with the trend
25 Pip stop loss

EURUSD as DXY s gaining momentum DXY has completed its long term downside now lets look for sell on EURUSD
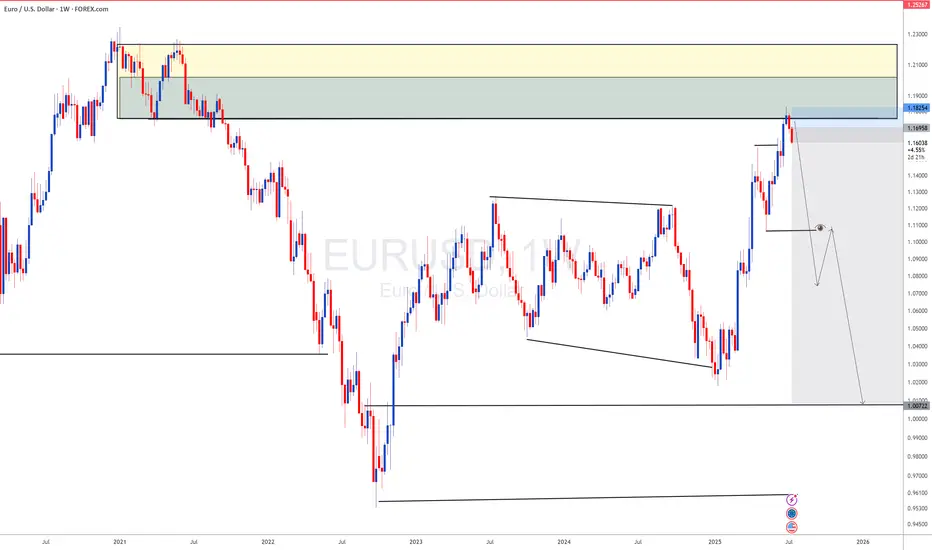
DXY - USD Index: either 86 or 112If the current pullback can break above the Centerline, then massive upside is on the plate.
But if it gets rejected, massiv downside is possible.
We don't know yet.
Just let the market tell you.

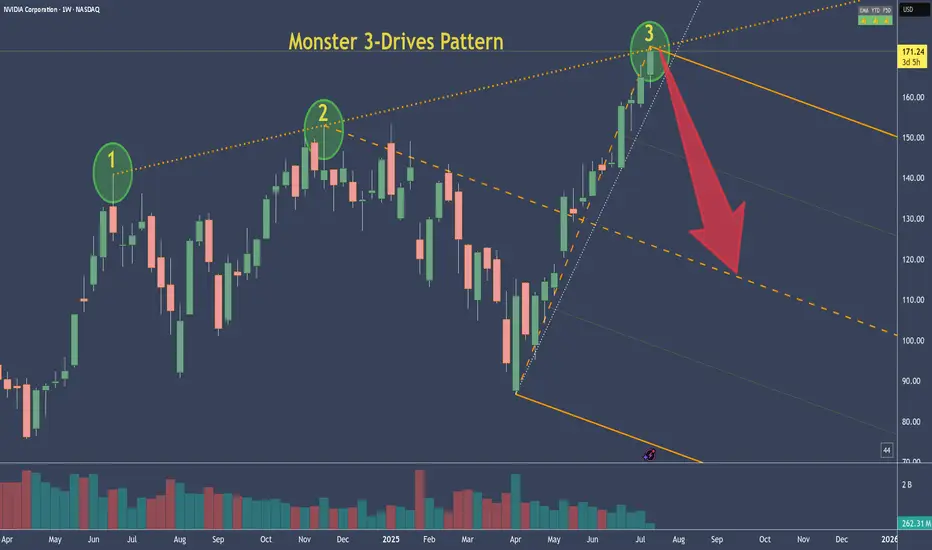
NVDA - NVIDIA's 3-Drive Pattern target if it plays outThis is the weekly chart of NVDA.
We can clearly see a 3-Drives pattern forming.
If this pattern plays out, the centerline would be my target. Of course, it's still too early to short.
But I’ve got my hunting hat on and I'm watching for signals on the daily chart.
One would be a break of the slanted trendline—but there are a couple of other conditions that need to align as well.
Always ask yourself: What if?
15.07.25 Morning ForecastPairs on Watch -
FX:EURUSD
CAPITALCOM:DE40
FX:EURGBP
FX:GBPJPY
A short overview of the instruments I am looking at for today, multi-timeframe analysis down to what I will be looking at for an entry. Enjoy!

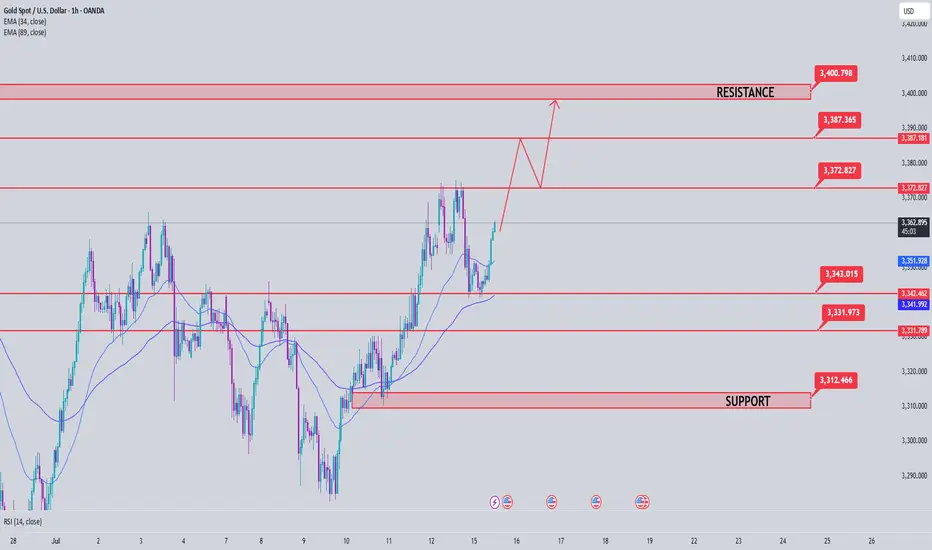
Gold Price Analysis July 15Continued uptrend after touching the 3345 buy zone
As analyzed at the beginning of the week, gold price has touched the buy zone around 3345 and continues to maintain the bullish wave structure, heading towards the 3400 resistance zone.
Currently, if gold breaks the 3373 mark, the uptrend is likely to be further strengthened. At that time, it is not advisable to trade against the trend, especially when the buyers completely control the market.
However, in case gold falls below the 3343 support zone (the resistance level in yesterday's US session), the current uptrend may be temporarily interrupted. At that time, the market will need to form a new momentum to establish the next trend.
🔑 Important price zones:
Support: 3343 – 3330 – 3313
Resistance: 3373 – 3387 – 3400
📌 Trading strategy:
Hold BUY order at 3345, expected target 3400
Activate SELL order if there is a clear price rejection signal at 3373 or 3387 (with confirmation of selling pressure)
SELL at 3400 if the strong resistance zone reacts clearly