Gold Trading Strategy July 3✏️D1 candle continues to increase towards the price gap zone. At the beginning of the European session, sellers accept to enter the market at this resistance price zone around 3365. The accumulation pattern of gold price is forming a triangle pattern.
The lower boundary is broken, it will lead to the breakout point of the lower boundary and vice versa, if the upper boundary of the triangle is broken, the price will move towards the next resistance.
📉 Key Levels
Resistance: 3388-3363
Support: 3330-3311-3297-3277
Buy trigger: breakout above 3363
Sell trigger: breakout below 3330
If this idea resonates with you or you have other ideas, please comment. I look forward to reading your thoughts!
Best regards, VHT Traders!
Trade

EURNZD Trade Recap +3% 2nd July 2025A long position taken on EURNZD for +3%. Full explanation as to why I executed on this position and also my management plan I put in place.
Any questions you have just drop them below 👇

04.07.25 Morning ForecastPairs on Watch -
FX:GBPJPY
FX:USDJPY
OANDA:XPTUSD
FX:EURCAD
A short overview of the instruments I am looking at for today, multi-timeframe analysis down to what I will be looking at for an entry. Enjoy!

Swiss Vault Job: GBP/CHF Entry Blueprint Unlocked🕵️♂️💼 GBP/CHF: The Swiss Vault Infiltration Protocol 💼🕵️♂️
(Swing/Day Plan — Executed in Silence, Paid in Profits)
🌟Hi! Hola! Ola! Bonjour! Hallo! Marhaba!🌟
Dear Money Makers & Silent Operators, 🤑💰💸✈️
Welcome to the Thief Trading Syndicate's Strategic Playbook – today’s mission targets the GBP/CHF vault. We’ve cooked up a master plan powered by our signature blend of technical finesse and stealthy macro-insight. This setup is based on institutional footprints and high-stakes zones where liquidity flows like digital gold.
📊 Current Bias:
🟥 Bearish weight remains, but we smell bullish smoke beneath — reversal setups in play.
📈 Entry Strategy:
Long (Bullish) — Scout entry above 1.06500+ in higher timeframes (4H+). Retest confirmation required.
Short (Bearish) — “The vault’s unguarded! Slip in short anywhere up top—clean sweep mode.”
🛑 Stop Loss Placement:
Place SL near recent swing highs/lows on the 5H chart (swing basis). Customize per lot size and multiple entries. Your risk defines your escape rope.
🎯 Profit Extraction Target:
Long TP: Aim for the 1.11500 vault door (or vanish before it slams).
Short TP: Dive to 1.06500, or pull the plug earlier if guards wake up.
📰 Strategic Conditions:
This pair’s behavior is currently driven by mixed macro triggers — smart money positioning (COT), sentiment clusters, and market structure traps.
→ For full details: Fundamental macros, COT leaks, sentiment drift, and institutional zones — check your sources.
🚨 News & Risk Protocols:
No new entries during red-folder events.
Use trailing stops to lock loot and run.
💥 Boost Our Bandits!
Smash that ❤️ to strengthen our robbing force. Each tap fuels future missions. No indicators. Just raw street-smart trading edge.
👀 More heists incoming. Stay low. Stay sharp. Stay profitable. 🐱👤🎯📈

Copper is gonna to complete the 2nd leg??Hi all trading lovers and copper buyers...
Seems that after BREAKOUT from Descending Triangle and Pullback to breakout level, price is going to complete the 2nd BULLISH Leg in Weekly uptrend with a round level target (5.5555)...
(Pullback could be a bit deeper...)
PLEASE NOTE THAT IS ONLY AN ANALYSIS AND COULD BE WRONG...
MARKET IS BASED ON POSSIBILITIES AND UNCERTAINTIES...
MANAGE YOUR RISK...
#Forex #Trading #Analysis #Copper #Chart #Spike #Wedge #Uptrend

02.07.25 Morning ForecastPairs on Watch -
FX:EURNZD (Live)
FX:EURJPY
FX:GBPJPY
FX:AUDCAD
A short overview of the instruments I am looking at for today, multi-timeframe analysis down to what I will be looking at for an entry. Enjoy!

GBPAUD waiting for conditions to break out of the wide rangeGBPAUD found some buying momentum at the 2.085 support in today's trading session. In the long term, the pair's trading range is wide, extending from 2.102 to 2.067. A breakout of this range will form a new trend.
A BUY trading signal is confirmed when the pair breaks the resistance at 2.10200.
A SELL signal is confirmed when the pair breaks the support at 2.085.
📈 Key Levels
Support: 2.085 - 2.067
Resistance: 2.102 - 2.138

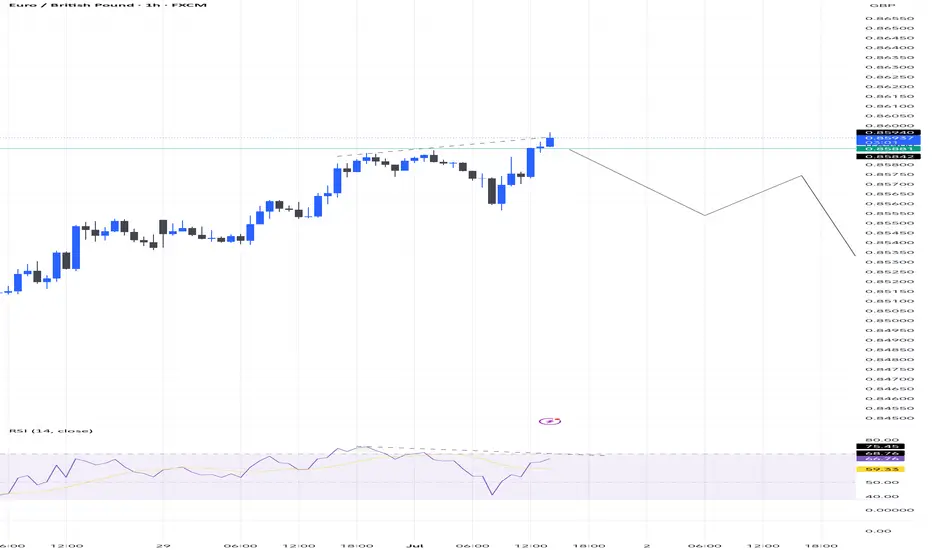
EURGBP short trade Idea with divergence 💶 EURGBP SHORT SETUP – Clean Supply Rejection 📉🔥
Looking at a fresh opportunity to short EURGBP based on recent price action and structure:
🔹 Market Context:
Price recently pushed into a key supply zone or resistance around 0.84800–0.85000.
Multiple rejections spotted at that level – suggesting weak bullish momentum and engineered liquidity.
🔹 Setup Bias: Bearish
We’re anticipating a short-term correction or continuation to the downside, targeting recent demand zones or imbalances.
🔹 Trade Setup (Example):
Entry: ~0.84800
Stop Loss: ~0.85100 (above supply wick)
Take Profit: ~0.84100 (demand/imbalance fill area)
Risk to Reward: ~1:3 potential
🔹 Confluences:
Rejection candle at supply
Divergence
Price broke structure (BOS) to the downside earlier
Overbought signals (if using RSI/Stoch)
Clean imbalance zone below
📊 Execution Tip:
Wait for confirmation (M15 bearish engulfing / lower high break) to avoid early entries.
01.07.25 Morning ForecastPairs on Watch -
FX:EURNZD
FX:GBPCAD
FX:EURUSD
FX:GBPJPY
A short overview of the instruments I am looking at for today, multi-timeframe analysis down to what I will be looking at for an entry. Enjoy!

Gold price analysis July 1On the D1 chart, the price has recovered positively when the candle closed above 50% of the decrease range of last Friday's session. This shows that buying power is returning and a new uptrend is forming, with the target heading towards the GAP zone around 3363.
Today's trading strategy:
Prioritize buying (BUY) if the price has a correction to the support zone of 3300.
Sell strategy should only be implemented at important resistance zones, with short-term profit expectations because the main trend is leaning towards the uptrend.
Important technical levels:
Support: 3300 - 3337 - 3360
Resistance: 3334 - 3348 - 3363

S&P 500 Outlook. Best Quarter Since 2023… But What Next?The S&P 500 just logged its best quarterly performance since Q4 2023 , surging on optimism around global trade negotiations and growing expectations that the Fed may begin cutting rates as early as September. US futures are green this morning, thanks to developments like Canada backing off digital taxes, ongoing dialogues with China ahead of the July 9 deadline, and risk-on sentiment is pushing yields and the dollar lower.
But as traders, we need to ask:
Are we witnessing a genuine economic inflection point? Or is this just a liquidity-driven rally that’s pricing in a best-case scenario?
Technical View
Support Zone: 6,150 was just broken through. And 6000, the round number level, coinciding with the 20-day EMA and previous swing level.
Resistance Levels: 6,235 is the next critical ceiling, a clean breakout could see price reach the extension level of 6,415.
Momentum Indicators: RSI remains elevated and is creeping toward the overbought. While momentum is strong, watch out for the possible development of a divergence.
Possible Scenarios
The 'Soft Landing’ Is Now the Base Case
Markets are trading as if the Fed has successfully engineered a soft landing. But that’s now fully priced in, and historically, the most dangerous trades are the ones everyone agrees on. If trade talks stall, inflation re-accelerates, or earnings disappoint, the reversal could be brutal and fast.
Risk-on Sentiment Without Volume Is a Yellow Flag
Despite the price strength, volume has been tapering off. The S&P’s recent leg up occurred on lighter-than-average participation, suggesting institutions may be watching, not chasing. That’s often the case in low-volatility summers, but it also implies that any negative catalyst could cause outsized downside moves.
Macro-Fundamentals May Not Justify Valuation Expansion
Yes, inflation is slowing, and the Fed might cut. But if they do, it’s likely because growth is weakening, not because the economy is roaring. So the very condition that triggers rate cuts could also cap earnings growth!
Projection
Bullish Scenario: A confirmed breakout above 6,280 could carry us toward 6,400–6,500 by mid-Q3, especially if the trade deals progress, July inflation comes in soft, and the Fed signals accommodation.
Bearish Risk: If price fails to hold above 6,120, especially if trade optimism fades, or inflation growth spikes or Fed rhetoric shifts hawkish again, this could then open a quick pullback toward 6,000 or lower, which also aligns with the 50-day SMA.
Key Events to Watch
July 9 Trade Talks Deadline: Any sign of stalling could bring volatility back fast.
June CPI Print (July 10): Crucial for confirming the Fed's next move.
Earnings Season Kickoff (mid-July): Tech-heavy expectations may not be easy to beat after such a strong run.
Conclusion
A record-setting quarter is impressive but not necessarily predictive. This quarter’s rally has been built more on relief and expectations than hard data. When expectations (not earnings) are doing the heavy lifting, any misstep from central banks or geopolitics could unravel gains rapidly.
A rate cut might be delayed, or inflation re-accelerates, or trade talks stall; any of these could leave equities hanging. Remember: the higher the climb without real earnings growth, the harder the fall when sentiment shifts. It's not just about the chart. It is about the narrative behind the price.
What’s your bias for Q3?
Are you buying this breakout or fading the optimism? Drop your thoughts below.

GBP/CAD (Two Trade Recaps) EUR/NZD Long and GBP/JPY LongEUR/NZD Long
Minimum entry requirements:
- If tight non-structured 15 min continuation forms, 5 min risk entry within it if the continuation is structured on the 5 min chart or reduced risk entry on the break of it.
- If tight structured 15 min continuation forms, reduced risk entry on the break of it or 15 min risk entry within it.
- If tight non-structured 1H continuation forms, 15 min risk entry within it if the continuation is structured on the 15 min chart or reduced risk entry on the break of it.
- If tight structured 1H continuation forms, 1H risk entry within it or reduced risk entry on the break of it.
GBP/JPY Long
Minimum entry requirements:
- Tap into area of value.
- 1H impulse up above area of value.
- If tight non-structured 15 min continuation follows, 5 min risk entry within it if the continuation is structured on the 5 min chart or reduced risk entry on the break of it.
- If tight structured 15 min continuation follows, reduced risk entry on the break of it or 15 min risk entry within it.

30.06.25 Morning ForecastPairs on Watch -
PEPPERSTONE:HK50
FX:EURJPY
FX:GBPJPY
FX:GBPUSD
A short overview of the instruments I am looking at for today, multi-timeframe analysis down to what I will be looking at for an entry. Enjoy!

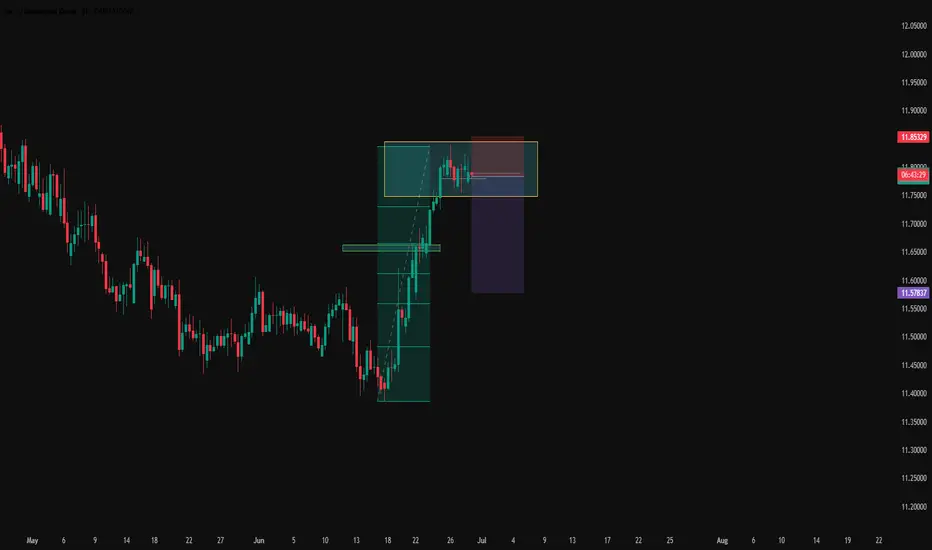
#006: EUR/NOK SHORT Investment Opportunity
Hi, I'm Andrea Russo and today I want to show you this SHORT investment opportunity on an often undervalued but extremely interesting pair: EURNOK.
I would like to thank in advance our Official Broker Partner PEPPERSTONE for the support in creating this article.
The Euro / Norwegian Krone exchange rate has reached an excess area, with a recent high in the 11.79 area, showing signs of bullish exhaustion on multiple timeframes. Prices are currently above the EMA200, but this data is not enough to justify a further extension of the rise, especially considering the behavior of institutional operators and the macro weakness of the euro.
Technical context
The price structure shows a congestive lateral phase, with upper spikes that do not find continuation, signaling a probable distribution phase. The level of 11.8530 has acted as an upper protective zone, often defended with declining volumes and passive orders.
The target at 11.5800 corresponds to a historical cluster of volumes, and is supported by protections at the level of options and open interest. In the event of a break of the local lows, an acceleration of the bearish movement is plausible.
Fundamental context
The Norwegian krone is currently benefiting from an improvement in domestic macro data, while the euro is suffering from a fragile context with divergences between member countries and signs of slowdown.
Market sentiment shows a balanced positioning by retail traders, indicating a possible expectation of institutional investors to strike forcefully in the opposite direction to any future imbalances.
Stay tuned for more updates.
Exclusive: GBP/USD Swing Heist – Limited-Time Opportunity!🏴☠️ GBP/USD HEIST ALERT: Bullish Loot Grab Before the Cops Arrive! 🚨💰
🌟 Attention, Market Pirates & Profit Raiders! 🌟
"The vault is unlocked—time to swipe those pips!"
🔥 THIEF TRADING STRATEGY (Swing/Day) 🔥
Based on high-risk, high-reward technical & fundamental analysis, here’s the master plan to plunder GBP/USD ("The Cable")!
📈 ENTRY (Bullish Heist Zone)
"The vault is OPEN!" – Long at any price, but for precision:
Buy Limit orders preferred (15m-30m timeframe).
Pullback entries from recent swing lows/highs = sneakiest loot grab!
🛑 STOP LOSS (Escape Route)
Thief SL: Nearest swing low (4H chart).
Adjust based on: Risk tolerance, lot size, & number of orders.
"A good thief always has an exit plan!"
🎯 TARGETS
1.37500 (or escape early if the cops 🚓 (bearish traps) show up!).
Scalpers: Only long-side raids! Use trailing SL to lock profits.
💥 WHY THIS HEIST? (Bullish Momentum)
Technicals + Fundamentals align for a potential breakout.
Overbought? Risky? Yes—but the best loot is guarded!
📢 TRADING ALERT (News & Risk Mgmt)
Avoid new trades during high-impact news (volatility = police sirens!).
Trailing stops = Your getaway car. Protect profits!
🚀 BOOST THE HEIST!
💖 Hit "Like" & "Boost" to fuel our next raid!
💬 Comment your loot tally below!
"Stay sharp, thieves—see you at the next heist! 🤑🔥"

"USD/CHF Breakout - Real Deal or Trap?"🏦 SWISS BANK HEIST: USD/CHF BULLISH LOOT GRAB 🚨
(Professional Money Snatching Strategy)
🦹♂️ Attention All Market Bandits!
(Hola! Oi! Salut! Hallo! Ahlan!) 🎭💰
🔥 Thief Trading Intel Confirmed!
The USD/CHF "Swissy" vault is ready for cracking! Our bullish robbery plan targets 0.84500 - but we must escape before the bears (police) set their trap!
🔓 ENTRY: CRACKING THE SAFE
"0.82800 MA is the vault door!"
✔ Option 1: Buy Stop above MA (breakout play)
✔ Option 2: Buy Limit at swing low (15m/30m pullback)
🔔 Pro Tip: Set alerts - real thieves never miss their heist!
🚨 STOP LOSS: POLICE EVASION PLAN
📍 Thief SL: 0.81900 (below 3H swing low)
⚠️ Warning: No SL before breakout! You'll trigger the alarms!
💎 TARGET: ESCAPE WITH THE LOOT
🎯 Primary Take: 0.84500
💰 Scalpers: Long-only! Trail SL like a getaway car!
📊 MARKET CONDITIONS
⚖️ Neutral Trend (but bullish potential brewing!)
🔍 Key Intel Needed: COT reports, macro data, CHF safe-haven flows
🌐 Full Briefing: Bi0 linkss 👉🔗 (don't go in blind!)
🚦 RISK MANAGEMENT PROTOCOLS
• ❌ Avoid trading during news events
• 🔒 Always use trailing stops
• 💣 Position size = your explosive potential
🦾 SUPPORT THE SYNDICATE
💥 SMASH THAT BOOST BUTTON!
💬 Comment your heist results below!
🔔 Next robbery coming soon - stay tuned!
🤑 Remember thieves: Book profits before the Swiss police arrive!

"CHF/JPY Bullish Trap? We’re Stealing Profits Anyway!"🔥 Swiss-Yen Bank Heist: Bullish Loot Grab! (CHF/JPY Master Plan) 🔥
🌟 Hi! Hola! Ola! Bonjour! Hallo! Marhaba! 🌟
Attention Money Makers & Market Robbers! 🤑💰💸✈️
Based on the 🔥Thief Trading Style🔥 (technical + fundamental analysis), we’re plotting a bullish heist on the CHF/JPY "Swiss-Yen" Forex Bank. Follow the strategy on the chart—long entry is our golden ticket! Target? The high-risk Red Zone—where police traps, overbought signals, and bearish robbers lurk. But we’re sneaky thieves… and we always get the loot! 🏆💸
📈 Entry: "The vault is wide open!" Swipe bullish gains at any price—the heist is LIVE!
Pro Tip: Place buy limit orders within 15-30 min (swing lows/highs).
🛑 Stop Loss:
Thief-style SL at recent 4H swing low (174.100) (Day/scalping trade)
Adjust based on your risk, lot size, and multiple orders.
🎯 Target: 177.200 (Time to cash out!)
🧲 Scalpers: Eyes here! 👀
Only scalp LONG.
Big money? Charge in! Small budget? Join swing traders and execute the robbery.
Trailing SL = Your money’s bodyguard. 💰
Why CHF/JPY?
Bullish momentum fueled by:
Fundamentals (COT reports, macro trends)
Sentiment + Intermarket analysis (Check our bioo for deep dives! 🔗👉👉👉)
⚠️ Trading Alert: News = Chaos! 📰🗞️🚫
Avoid new trades during major news.
Trailing stops = Profit protector.
💖 Support the Heist!
Smash the Boost Button! 💥
Strengthen our robbery squad. Steal profits daily with the Thief Trading Style! 🏆💪🚀
Stay tuned—another heist drops soon! 🤑🐱👤🤩

EUR/CAD Raid Alert: Last Chance to Loot This Bullish Breakout!🏴☠️ EUR/CAD LOOT ALERT: Can We Steal 100 Pips Before the Trap Springs? (Thief Trading Blueprint)
🌟 Hola! Bonjour! Ciao! Hallo! Marhaba! 🌟
Attention Forex Bandits & Loonie Raiders! 💶🦫💰
🔥 Thief Trading Intel: We're targeting EUR/CAD for a MA breakout heist! Long entry only - eyeing that 1.57200 breakout level. High-risk MA Zone ahead: overbought, consolidating, perfect for our ambush.
"Take your pips and vanish - this steal's on the house!" 💨💵
🚪 ENTRY: The Trap is Set!
📈 "Wait for MA breakout at 1.57200 - then STRIKE!"
Option 1: Buy Stop above MA (breakout confirmation)
Option 2: Buy Limit at swing levels (15-30 min TF)
📌 Pro Thief Move: SET THOSE ALERTS!
🛑 STOP LOSS: Escape Plan
🔊 "Listen up, rookies!" 🗣️
Breakout trades? NO SL until after confirmation!
Rebels: Place wherever... but sleep with one eye open! 👁️
📍 Smart Crew SL: Nearest swing low (1H TF)
🎯 TARGET: Loot & Scoot!
🎯 1.58200 (100 pips of pure profit!)
⚡ SCALPERS' QUICK HIT
👀 Long only!
Deep pockets? Raid now
Light wallet? Join swing heist
Trailing SL = Your Getaway Car! 🚗💨
📢 WHY THIS HEIST?
"Euro vs Loonie" showing strength! Watch for:
COT data & Macro trends
Intermarket analysis
Sentiment shifts
🔗 Full dossier? Bio0 links below! 👉🏻☝🏻👉🏻☝🏻
⚠️ WARNING: News = Police Raid! 📰🚨
CAD news moves fast! Protect your stash:
❌ No new trades during news
🔒 Trailing stops = Handcuff-proof profits
💖 SUPPORT THE CREW!
💥 SMASH THAT BOOST BUTTON! 💥
More boosts = bigger future scores!
Stronger crew = more pips for all!
Next currency heist coming soon... 💶🔫

GBP/USD HEIST ALERT: Bullish Breakout or Bearish Trap?🌟 Hey! Hola! Ola! Bonjour! Hallo! Marhaba! 🌟
Calling all Market Robbers & Profit Pirates!💸💰
🔥 Thief Trading Intel: Our crew’s latest heist targets GBP/USD "The Cable"—bullish breakout incoming! Long entry only. High-risk Red Zone ahead: overbought, consolidating, and ripe for a reversal. Don’t get caught in the bear trap! 🏴☠️
"Take your loot and run, trader—you’ve earned this steal!" 💪🎯
🚪 ENTRY: The Heist Begins!
📈 "Wait for MA breakout (1.36000) then STRIKE—bullish profits await!"
Option 1: Buy Stop above Pink Resistance (breakout confirmation).
Option 2: Buy Limit at swing low/high (15-30 min TF).
📌 Pro Tip: SET AN ALERT! Don’t miss the breakout.
🛑 STOP LOSS: Escape Route
🔊 "Yo, listen up! 🗣️
Buy Stop orders? NO SL until after breakout! 🚀
Rebels: Place SL wherever—but you’ve been warned! ⚠️🔥
📍 Thief SL (Smart Crew): Recent/swing low (1.35000, 4H TF).
📍 Adjust based on your risk, lot size, and orders.
🎯 TARGET: Loot & Exit!
🎯 1.37500 (or escape early if the market turns!)
⚡ SCALPERS’ QUICK GRAB
👀 Long scalps ONLY!
Big wallets? Raid now.
Small stacks? Join swing traders.
Trailing SL = Your Money Shield! 🛡️💰
📢 WHY THIS HEIST? (GBP/USD Bullish Momentum)
"The Cable" is heating up! Key drivers:
Fundamentals (COT, Macro Data)
Sentiment & Intermarket Trends
Future Targets & Score Outlook
🔗 Full intel? Bio links below! 👉👉
⚠️ TRADING ALERT: News = Danger Zone! 📰🚨
News = Volatility Spikes! Protect your loot:
❌ Avoid new trades during news.
🔒 Trailing SL = Profit Lock.
💖 SUPPORT THE HEIST CREW!
💥 SMASH THAT BOOST BUTTON! 💥
More boosts = easier money grabs!
Stronger crew = bigger heists!
Profit daily with Thief Trading Style! 🏆🚀
Next heist coming soon—stay tuned! 🤑🐱👤🤩

NZD/CHF Heist Blueprint: Snag the Kiwi vs. Franc Profits!Ultimate NZD/CHF Heist Plan: Snag the Kiwi vs. Franc Loot! 🚀💰
🌍 Greetings, Wealth Raiders! Hola! Ciao! Bonjour! 🌟
Fellow money chasers and market bandits, 🤑💸 let’s dive into the NZD/CHF "Kiwi vs. Franc" Forex heist with our 🔥Thief Trading Style🔥, blending sharp technicals and solid fundamentals. Follow the charted strategy for a long entry, aiming to cash out near the high-risk ATR zone. Watch out for overbought signals, consolidation, or a trend reversal trap where bearish robbers lurk. 🏴☠️💪 Seize your profits and treat yourself—you’ve earned it! 🎉
Entry 📈
The vault’s open wide! 🏦 Grab the bullish loot at the current price—the heist is live! For precision, set Buy Limit orders on a 15 or 30-minute timeframe, targeting a retest of the nearest high or low.
Stop Loss 🛑
📍 Place your Thief SL at the recent swing low on a 4H timeframe for day trades.
📍 Adjust SL based on your risk tolerance, lot size, and number of orders.
Target 🎯
Aim for 0.50400 or slip out early to secure your loot! 💰
Scalpers, Listen Up! 👀
Stick to long-side scalps. Got big capital? Jump in now! Smaller stacks? Join swing traders for the robbery. Use a trailing SL to lock in your gains. 🧲💵
NZD/CHF Market Intel 📊
The Kiwi vs. Franc is riding a bullish wave, fueled by key drivers. Dig into the fundamentals, macro trends, COT reports, sentiment, intermarket analysis, and future targets for the full scoop. 🔗👇
⚠️ Trading Alert: News & Position Safety 📰
News drops can shake the market! To protect your loot:
Skip new trades during news releases.
Use trailing stops to secure profits and limit losses. 🚫
Join the Heist! 💥
Support our robbery plan—hit the Boost Button! 🚀 Let’s stack cash with ease using the Thief Trading Style. 💪🤝 Stay sharp for the next heist plan, bandits! 🤑🐱👤🎉

EURUSD What Next? SELL!
My dear friends,
My technical analysis for EURUSD is below:
The market is trading on 1.1716 pivot level.
Bias - Bearish
Technical Indicators: Both Super Trend & Pivot HL indicate a highly probable Bearish continuation.
Target - 1.1635
About Used Indicators:
A pivot point is a technical analysis indicator, or calculations, used to determine the overall trend of the market over different time frames.
Disclosure: I am part of Trade Nation's Influencer program and receive a monthly fee for using their TradingView charts in my analysis.
———————————
WISH YOU ALL LUCK

Gold Price Analysis June 27Daily Trend Analysis:
The price has reacted strongly at the 3348 level, forming a clear and sustainable bearish structure. The 3296 zone is now a critical level — a confirmed breakout below this area could lead to a deeper decline, especially with limited potential for recovery on Friday.
Today, the bearish trend is likely to face less resistance compared to the bullish side. As such, a move toward the support zones at 3278 and 3255 is highly probable.
Any bullish retracement during the European session should be viewed as a good opportunity to look for SELL setups, targeting 3278 and 3255.
As previously analyzed, SELL zones are clustered around key resistance levels. Traders should closely watch price reactions in these areas for potential entry signals.
🔹 Breakout key level: 3296
🔹 Support zones: 3278 – 3255
🔹 Resistance zones: 3300 – 3312 – 3325 – 3336 – 3348 – 3363

USDJPY is ready to go down to 143.834USDJPY is ready to follow my strategy and is already going down to 143.834
