Tradeanalysis

EURUSD Short | Doji formed after hourly uptrend -> reversal!We see a Doji forming after an uptrend by h1 chart + some other signs which I have drawed on the chart.
Comment your thoughts below :)

GBPUSD Buy IdeaWe see a clear trend and also a bounce off at fib ~61.8 level combined with higher highs and higher lows. potential new higher high forming where our tp is.
Leave your comments below, read them!

Oversold SP500 on the short term - Potential move up 4 stocks! SPY hitting oversold on all time frames leading up to the 4HR. A lot of "bears" in the market. What i am seeing is a consolidation phase after hitting 40-70% gains on nearly every stock on the market. Granted this was in tandem following a -50% market decline from Q4 of 2018.
Again what must come up must come down. A lot of people are thinking a major market correction is in order...I personally think that would not happen until the election year of 2020. We still have some time to make good money before a broader pull back. Overall people are still bullish, almost to a fault.
My longer term theory is when normal markets correct CRYPTO market will RISE :) As some of you may know I have mainly built my following and trading group around crypto and have done fairly well.
Regardless! Looking forward to SPY trade next week. I am utilizing this chart to help base some of my POT Stock Movements. Again, be very cautious in this market. Falling into FOMO will inevitably result in Panic Selling. Set SL's to an affordable loss %. I normally set mine to depending on the type of stock, volatility, and the type of risk level you are taking.
Good luck to everyone and Happy Hunting


infinity trades nzd/jpySimple continuation of the h4 bullish structure. After respecting a sig level @76.33 we can see a profit take occur which has caused a short term snap back to our potential entry price @75.60 we will asses price action at this price and anticipate buying pressure being added on the basis of the ascending trend level being re tested this will give us confidence in a bullish market.
We have chosen the 76.33 price for our first target for same reasons as explained above our technical target is @78.00 handle the stop loss for this trade is sitting below the last swing low also below a natural price of S/R.

AUDUSD Sell Opportunity..AudUsd, Elliot wave triangle, Monday while bank holiday in USA Aussi Dollar was consolidationg earlier london session just around 0.71500 and as Dxy getting back strength and china usd deal is in progress, this pair has chance to break 0.71000 level.

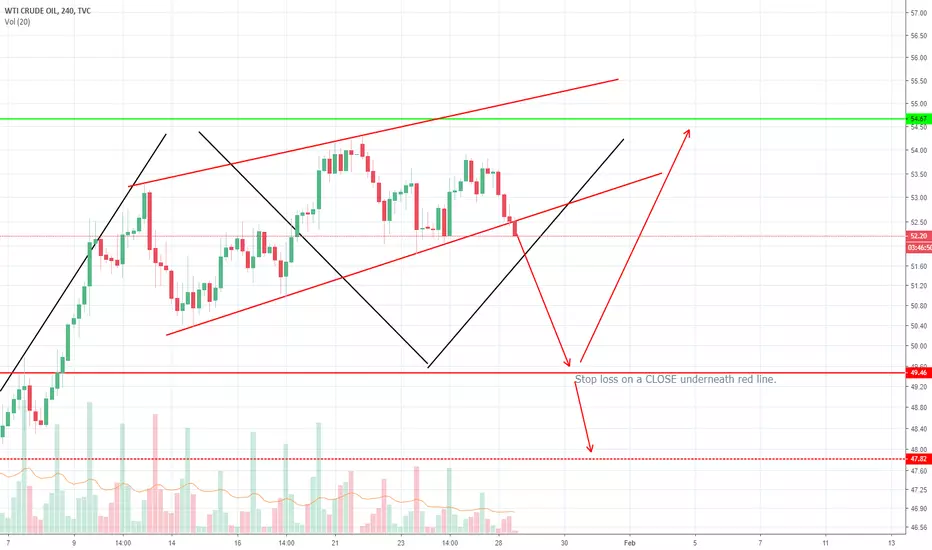
USOIL short (short term chart)Broke out of channel. Should be seeing bottom target being hit. Will take profits at that level.
If we get a bounce from that level, will go long from there. Otherwise, will short to the red dotted line.


Stellar (XLM): A look at basic TA on a daily timeframeXLM on the daily looks a little bearish now.
RSI starting to drop, MACD momentum is evening out and I expect a crossing over in the few days. The first red candle has appeared since October 1st.
Unless we see a big rally I can see us slipping further down as outlined in my last analysis.

XLM, wait on better positionBased on RSI and MACD, plus BTC recent movements I will be waiting until a drop into the 4000-4200 range before entering a long with Stellar.
I will be looking to buy back in at 0.20-0.21 USD which would mean a fall within this range (unless BTC breaks upwards which I consider unlikely).
I will update this chart regularly.
This is not trading advice, just my own personal idea and thoughts. Safe trading out there.

USDCAD IDEAMy thoughts on two alternate ideas:
IDEA 1 - If it breaks the support zone and the trendline it would go lower to the next zone which is either at the 38.2% or around the 61.8% on fibs (that's more long term those levels as I did the fibs a bit wider, however even if I did a smaller fibs the zones I drew out will still be around key levels).
IDEA 2. If it instead respects the trendline and pretty much the support zone then it can go to test the resistance zone. Also I did a counter trendline as that could be a possible confirmation for it to go higher plus a possible entry once it breaks and then retests. If it gets to the resistance zone at the top, breaks wait for the retest there and there's a good possible entry.
When it does break the zone that's when you drop down to the lower time frames to get more precise entries on the retest

For anyone shorting XLM now, be carefulI have closed my previous trade
at 4140. RSI on the hourly plus a look at previous consolodation period was my reasoning behind this. If you continue to short XLM it may make sense but I am just making this update to show what I am doing. Do you agree or disagree? Let me know
Have fun trading out there and be careful.

Short Term Forecast not good for XLM (Stellar)RSI suggests XLM was overbought. I have entered a shirt at 4400 and I expect to close at the 4100 mark where we may see a short revival.
Targets are as follows:
1: 4100
2: 4000
3: 3800
From 3800-3900 I will be entering a long again.
Disclaimer: This is not trading advice, just what I plan on doing.

EURAUD (H4): Triple Top Short OpportunityEURAUD
Timeframe: H4
Direction: Short
Cofluences:
- Triple Top Resistance
- H4 Short Term Trendline Broken
- Crossover of 8EMA and 50EMA
Trade Suggestion:
Entry @ 1.6220
SL: 1.6375
TP1: 1.6013
TP 2:1.5886
Risk : -152 pips
Reward: +334 pips
Risk/Reward: 1:2.20
May the pips move in our favour! Good luck! :D


I recommend triple chart multiple time frame layoutThis amplifies analysis range from lower to higher time frame, therefore not losing important data.
To short look for the time of ranging to sell at a high point, not just at the moment. For example, September 3 & 4 multiple time frame analysis revealed overbought condition in a downtrend market, great sell order!

BTC is about to see some bullish momentum..Expect to see some bullish momentum the coming week! Although intermediate term I expect for us to be bullish, I do believe that we will see new lows mid to long term so don't get too excited and forget about the dangers of how quickly things can go south!
*this is not financial advice, simply sharing my opinions and looking for feedback from others.
Best of luck,
Zerotozeros

Bitcoin intra-day buy opportunityHi All,
I don't usually post setups like this on smaller time frames. But I wanted to show an example of a flag pattern that I would typically take a trade on.
We can see on Bitcoin a strong impulse move up which forms the pole and tight consolidation occurring within a range to possibly complete the flag.
An entry is confirm on a break of the pole. If you are trading on Bitfinex, then you would already be in a position.
Please give this trade idea a THUMBS UP and I will keep you updated!
Disclaimer: This is only my opinion, make of it what you wish. It is not financial advice.

Was Correct About Ripple Dip - Ripple Rebound ForThe Short Play!XRP behaved as expected. Many people are quick to call tops without calling bottoms as well. Thanks to everyone who send me a message telling me about your profits! I hope everyone continues to make smart trades.
If you are holding XRP right now the only smart move to make is to switch to another currency you are positive is going to grow faster than Ripple - or wait.
As a professional trader I spend weeks or months waiting for assets to get to where I want them to be sometimes they are in the negative for most of that time. Crypto is a thousand times the speed of any other asset class - in a market that doesn't sleep. Some describe month long holds as "longs" whereas in other markets that would be a very short horizon.
In part due to the fact that the market never closes and also because there are no regulations against practices that are banned on regulated markets - Ripple sometimes trades its worth - other times it pauses before catching up. Ripple has an inverse relationship with Bitcoin whether we like it or not.
BTC appears to be tracing the bottom right-hand side of an inverse head at shoulders pattern. BTC is currently trading at $6500 and will rise to $7100 again by Aug 10th.
Ripple will gain momentum thanks to BTC and should quickly move back up to the 5700-5800 range from the BTC pressure alone. With the added momentum, we should see 61k sats again in short course.
I still believe in a $2 Ripple at some point this year. Summer trading has traditionally proven to be rewarded by the major gains seen in the fall!. Ripple is a good buy right now on the short play - or to add to your portfolio of "long" positions - the price is right.

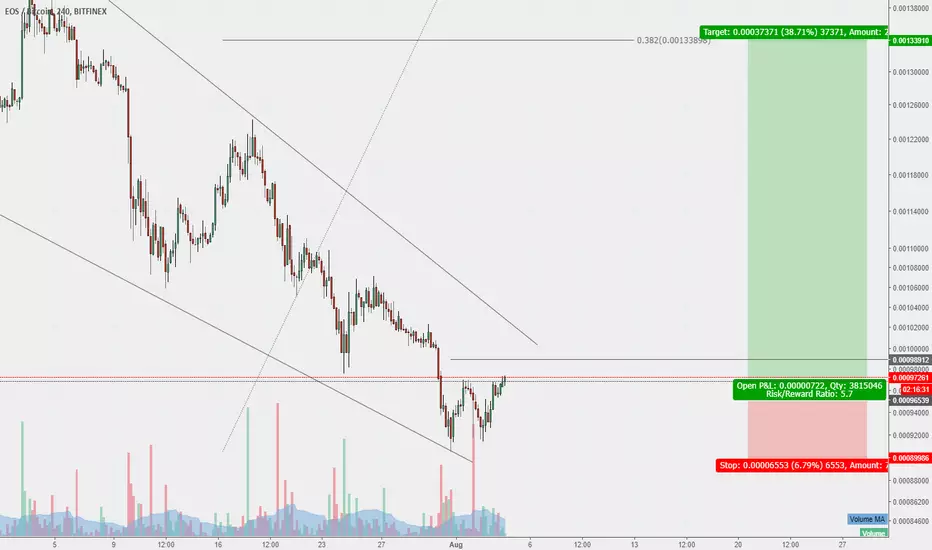
Slowly Accumulating EOS for a BullrunThere is a larger falling wedge pattern on EOSBTC that I've been keeping watching closely. I believe we are near the bottom and targetting a breakout to test the 38.2% Fib from the beginning of the falling wedge.
On the smaller time frames, I've been entering into a LONG position on:
Double bottom pattern
Cup and handle pattern
Bull flag pattern
I will be taking partial profits along the way in case the market dumps, however will hold remainder of the position to the target shown while trailing stops.
Please give this trade idea a THUMBS UP and I will keep you updated!
Disclaimer: This is only my opinion, make of it what you wish. It is not financial advice.
NZDJPY ShortFollowing basic trends this will be a strong opportunity to short for this coming trading week. No support shows this to be a profitable trade.
