TradeCityPro | Bitcoin Daily Analysis #149👋 Welcome to TradeCity Pro!
Let’s move on to Bitcoin’s analysis. Today, Bitcoin has once again moved toward a certain range, and we need to see whether it can break this zone this time or not.
⏳ 4-Hour Timeframe
On the 4-hour timeframe, Bitcoin has once again moved toward the 117000 zone today, faced a rejection candle from this level, and now it seems to be heading for a correction.
✔️ Considering tomorrow is also a holiday, the likelihood of ranging and correcting is much higher than continuing the trend, because for the uptrend to continue, the price needs volume inflow — and today and tomorrow, significant volume is unlikely to enter Bitcoin. That’s why the probability of correction and ranging is higher.
📊 If, during the correction, the price can hold above 115364, then with the start of the new week, the probability of a new bullish wave increases significantly. In that case, we can open a long position upon breaking the 117000 zone.
✨ However, if the price breaks below 115364, the correction could extend down to 112233. This still won’t change the overall trend, but it would fake the entire move made during the week — which is not a good sign for the bullish trend.
🔍 As long as the price remains above 112233, I am still only looking for long triggers and will not open any shorts for now.
❌ Disclaimer ❌
Trading futures is highly risky and dangerous. If you're not an expert, these triggers may not be suitable for you. You should first learn risk and capital management. You can also use the educational content from this channel.
Finally, these triggers reflect my personal opinions on price action, and the market may move completely against this analysis. So, do your own research before opening any position.
Tradecitypro

TradeCityPro | PENGU Consolidates, Awaiting Altseason Breakout👋 Welcome to TradeCity Pro!
In this analysis, I want to review the PENGU coin for you. This project is one of the new Solana-based meme coins from China, with a market cap of $2.4 billion, ranked 43rd on CoinMarketCap.
📅 Daily Timeframe
On the daily timeframe, this coin started a strong bullish trend from the 0.003813 low. In the first wave of this move, it managed to reach around the 0.015 zone, and after a long correction period, it has now started a new bullish wave, moving up to the 0.043576 high.
✔️ Currently, the price is in a correction and consolidation phase, but the correction is mostly time-based since it hasn’t even reached the 0.236 Fibonacci level yet.
📈 The next bullish leg will start with a break above 0.043576. I will try to open a long position on this coin if this level is broken.
📊 For now, we can’t determine the next targets based on Fibonacci levels because we first need to see how far the price corrects. After breaking 0.043576, I will update the analysis and define the targets.
✨ If the correction deepens, the price can retrace to the 0.236, 0.382, and 0.5 Fibonacci levels. In the case of a sharp drop, as long as the price remains above the 0.015 zone, the trend is still bullish, and a break below this level would signal a trend reversal.
📝 Final Thoughts
Stay calm, trade wisely, and let's capture the market's best opportunities!
This analysis reflects our opinions and is not financial advice.
Share your thoughts in the comments, and don’t forget to share this analysis with your friends! ❤️

TradeCityPro | OP Eyes Breakout in Prolonged Altseason Range 👋 Welcome to TradeCity Pro!
In this analysis, I want to review the OP coin for you — one of the Layer 2 projects whose token currently holds a market cap of $1.39 billion and is ranked 68th on CoinMarketCap.
📅 Daily Timeframe
On the daily timeframe, OP is moving within a range box between 0.521 and 0.920, which formed after a downtrend, and the price has been fluctuating in this box for several months.
🔑 One key resistance on this coin is 0.816, which can be used as a trigger for a long position.
📈 This trigger can also be used for spot buying, but given its Bitcoin pair, I prefer to take the position in futures and reserve spot buys for future triggers.
💥 For momentum confirmation of this position, we can use RSI’s entry into the Overbought zone, since RSI is currently near this area, and if it enters, it could support a strong upward move.
📊 The next long trigger is the breakout of 0.920. However, this trigger is not valid at the moment because the price hasn’t reacted to it for a long time, and in the future, if it does react, the level will likely change. In that case, I’ll update the analysis and give you the new trigger.
✔️ If OP declines, the first important support we have is 0.626. A close below this level could allow for a risky short position, but for shorts, I’ll personally wait for a break below 0.521.
📝 Final Thoughts
Stay calm, trade wisely, and let's capture the market's best opportunities!
This analysis reflects our opinions and is not financial advice.
Share your thoughts in the comments, and don’t forget to share this analysis with your friends! ❤️

TradeCityPro | Bitcoin Daily Analysis #148👋 Welcome to TradeCity Pro!
Let’s move on to Bitcoin’s analysis. Yesterday, Bitcoin made an upward move, but now it’s back around the same levels and has essentially faked most of that move. Let’s see what its next move could be.
⏳ 4-Hour Timeframe
Two changes have been made to the chart. First, I turned off the Fibonacci tool because the key levels in this corrective phase have already been identified, so there’s no need to use Fibonacci levels right now.
✔️ The second change is that I moved the Maker Buyer zone slightly higher because I think this placement is more accurate and the price has reacted better to it.
✨ With this updated zone, we can see that yesterday the price reached it, got rejected, and is now moving down.
📊 Volume during this correction has been decreasing, which is a positive sign for buyers. However, RSI faked the 61.67 zone, which isn’t great from a momentum perspective, but since the market doesn’t have a clear trend right now, it’s not very important for us.
💥 In my view, as long as the price stays above 115364, this correction is logical and doesn’t harm the bullish leg. But if the correction deepens, the probability of a drop back to 112233 increases.
💫 Confirmation of a bullish move will come after breaking the current zone. For the start of longer-term bullish legs, the 120041 and 122733 triggers are very important.
⏳ 1-Hour Timeframe
In the 1-hour timeframe yesterday, we could have opened a position using a candle setup, which could have given us a 2:1 risk-to-reward. But if you didn’t take profit, you likely hit the stop-loss by now.
🔔 I personally opened this position on my sub-account, while on my main account, I currently hold long-term Bitcoin positions with wider stops.
📈 At the moment, for opening a new position on Bitcoin, we can enter on a break of 116829. However, I’ll personally wait for the price to test this zone multiple times, form a clear main trigger, and then enter upon its breakout.
🔽 As for shorts, there’s no short trigger as long as Bitcoin is above 115364.
❌ Disclaimer ❌
Trading futures is highly risky and dangerous. If you're not an expert, these triggers may not be suitable for you. You should first learn risk and capital management. You can also use the educational content from this channel.
Finally, these triggers reflect my personal opinions on price action, and the market may move completely against this analysis. So, do your own research before opening any position.

TradeCityPro | Bitcoin Daily Analysis #147👋 Welcome to TradeCity Pro!
Let’s dive into Bitcoin. Today, Bitcoin has made an upward move and is triggering our setups.
⏳ 4-Hour Timeframe
In the 4-hour timeframe, Bitcoin made a bullish move today and activated the trigger I had previously shared with you in the 1-hour timeframe analysis. It has now reached the 116000 zone.
✔️ After breaking above the SMA25, the price has now reached the SMA99, which is forming a PRZ with the 116000 area. At the same time, RSI has reached its resistance zone, and rejection from here could work against this bullish leg.
⭐ On the other hand, the bullish momentum and buyer strength are very strong. The volume of the last two candles strongly favors the buyers, and considering the upward trend in the higher cycles, the probability of breaking the 116000 zone has increased.
📊 If this zone is broken, we can open a long position. The next resistances are 120000 and 122000. I’ll open this position with a wide stop so that it averages with our previous entry. If the market moves up, the position will carry more volume.
✨ In case of rejection from this 116000 zone, the main support trigger we have is 112233. As long as the price doesn’t fall below this area, we can still consider Bitcoin in an uptrend.
⏳ 1-Hour Timeframe
The trigger we had in the 1-hour timeframe was the 115327 zone. I mentioned that if the price touches it once, forms a higher low, and then breaks it, we can open a position on the next breakout.
🔍 That’s exactly what happened. Yesterday, the price hit it once and registered a higher low, but the candle that broke 115327 wasn’t ideal for entry — it was better suited for a stop-buy strategy.
📈 I didn’t open this position myself because I had mentioned that I wasn't actively trading in the 110000-116000 range, so I didn’t place a stop-buy.
💥 Now the price has entered the zone. If we get a pullback, we can open a long position in the next upward wave, which I think is a very good trigger.
🥸 However, since the RSI has entered the Overbuy zone, there's also a chance that this leg may continue without a pullback. In that case, we can use other strategies like candle setups to enter the market.
❌ Disclaimer ❌
Trading futures is highly risky and dangerous. If you're not an expert, these triggers may not be suitable for you. You should first learn risk and capital management. You can also use the educational content from this channel.
Finally, these triggers reflect my personal opinions on price action, and the market may move completely against this analysis. So, do your own research before opening any position.

TradeCityPro | SUIUSDT Is the best time to buy ?👋 Welcome to TradeCityPro Channel!
Let's analyze and review one of the most popular coins in the market, sui, and update our previous analysis and find new triggers
🌐 Overview of Bitcoin
Before starting the analysis, I want to remind you again that we moved the Bitcoin analysis section from the analysis section to a separate analysis at your request, so that we can discuss the status of Bitcoin in more detail every day and analyze its charts and dominances together.
This is the general analysis of Bitcoin dominance, which we promised you in the analysis to analyze separately and analyze it for you in longer time frames.
Very briefly, we are going to take a look at the SUI chart in a nutshell so that we don't miss the triggers
We are currently inside our 4-hour range box and are fluctuating between 3.31 and 3.59
After the 3.59 break or the 3.31 fake breakout, I will definitely try to open a long position and I also need volume confirmation for this.
For short positions, the 3.31 break is a very good trigger, but try to pay more attention to other charts. If you open with the failure of this trigger, try to save your profit very quickly.
📝 Final Thoughts
Stay calm, trade wisely, and let's capture the market's best opportunities!
This analysis reflects our opinions and is not financial advice.
Share your thoughts in the comments, and don’t forget to share this analysis with your friends! ❤️

TradeCityPro | Bitcoin Daily Analysis #146👋 Welcome to TradeCity Pro!
Let’s dive into Bitcoin analysis. In this analysis, I want to take a look at the higher timeframes since conditions in the lower timeframes haven't changed much compared to yesterday, and it’s a good idea to review the broader picture.
📅 Daily Timeframe
In this timeframe, after the completion of the previous corrective leg that extended to the 78,000 zone, Bitcoin started a new uptrend and has managed to climb up to the 122,000 area.
💥 The most important resistance during this move was 110,183, which, as you can see, has been broken, and Bitcoin is still holding above this level.
✔️ The curved trendline we've drawn in the higher timeframes has been broken in this timeframe, but in my view, confirmation of this trendline break comes only after the 110,183 level is broken again to the downside.
⚡️ Currently, the RSI oscillator is sitting on a support level around 38.21. This area is a very important momentum zone for Bitcoin, and if it breaks, the likelihood of downward momentum entering the market increases.
🧩 However, we still need more confirmations for a bearish scenario, and breaking this level on the RSI alone does not confirm a trend reversal.
🔽 If the correction continues, the main support we currently have is at 110,183. The SMA99 also acts as a dynamic support and, if it overlaps with 110,183, will form a very strong PRZ (Potential Reversal Zone).
📈 If the uptrend wants to resume from here, the first trigger confirming trend continuation is the 120,000 high — and breaking the range between 120,000 and 122,000 will start the next bullish leg.
❌ Disclaimer ❌
Trading futures is highly risky and dangerous. If you're not an expert, these triggers may not be suitable for you. You should first learn risk and capital management. You can also use the educational content from this channel.
Finally, these triggers reflect my personal opinions on price action, and the market may move completely against this analysis. So, do your own research before opening any position.

TradeCityPro | Bitcoin Daily Analysis #145👋 Welcome to TradeCity Pro!
Let’s get into Bitcoin analysis. Yesterday, Bitcoin was rejected from the zone I had mentioned, and today it will probably begin its new downward move.
⏳ 4-Hour Timeframe
In yesterday’s analysis, I told you that a pullback to SMA25 and the 0.5 Fibonacci zone was possible. That happened, and now, given the current candle, the probability of a corrective scenario has increased.
✔️ I still won’t open any position on Bitcoin and am waiting for it to exit the box between 110000 and 116000. But if certain conditions occur in the market, I might open a position inside this box as well.
✨ First of all, Bitcoin is still above the 111747 support, which is a very important support zone. As the price reaches it, there’s a chance it gets stuck there again.
📊 On the other hand, seller strength is very high, and as you can see, the RSI has been rejected from the 50 ceiling, and a red engulfing candle with very high volume is forming — all of which indicate the power of sellers.
🔽 I still stand by my opinion that as long as the price is above 110000, I won’t open a short position. But for a long position, we can move to the 1-Hour timeframe to review the trigger that has formed.
⏳ 1-Hour Timeframe
Before reviewing the triggers, there’s a very important point that explains why I currently prefer to remain without a position.
💫 Bitcoin in the HWC and MWC cycles has a very strong upward trend. Right now, in the LWC, it’s moving downward. So this Fibonacci drawn on the bearish leg doesn’t really mean much and won’t give us very strong and accurate resistances.
🔍 On the other hand, the LWC is moving against the higher cycles — meaning the higher cycles are stronger. That’s why shorting doesn’t make sense, since it’s against the main market cycle.
🔑 But also, since LWC has gained downward momentum, long positions — if not set with wide stop-losses — will likely get stopped out, because this momentum may cause small downward legs that hit stop-losses.
👀 So opening a long position is also difficult right now, and that’s why I say it’s better to wait for the price to move out of the 110000 to 116000 range, and then enter a position more comfortably.
🎲 If the price goes below 110000, we’ll receive the first sign of a trend reversal in the MWC, and then we can open short positions. And if it goes above 116000, LWC becomes bullish again and the continuation of the uptrend can begin.
Let’s now go to the triggers:
📈 The trigger we have for a long position is 115327 — an important ceiling that overlaps with the 0.5 Fibonacci level and has been touched several times.
☘️ If we get another touch to this level, I myself will likely try to open a long position, and I think it’s a good entry point that’s worth the risk to anticipate a breakout of 116000.
🔽 For a short position, a break below the 112205 low will start the continuation of the correction. I won’t open this position myself, but if you believe Bitcoin wants to reverse its trend, this is a very good trigger in terms of price level and you can open the position.
❌ Disclaimer ❌
Trading futures is highly risky and dangerous. If you're not an expert, these triggers may not be suitable for you. You should first learn risk and capital management. You can also use the educational content from this channel.
Finally, these triggers reflect my personal opinions on price action, and the market may move completely against this analysis. So, do your own research before opening any position.

TradeCityPro | Bitcoin Daily Analysis #144👋 Welcome to TradeCity Pro!
Let’s dive into Bitcoin analysis. Today is the first day of the week and Bitcoin has made a bullish move.
⏳ 4-Hour Timeframe
After the weekly candle closed, Bitcoin made an upward move and pulled back up to the 0.5 Fibonacci zone.
✔️ The long trigger I provided yesterday in the 1-Hour timeframe has been activated. If you opened a short-term position, it has likely already hit the target. If it was a long-term position with a larger stop, then it should still be open for now.
💫 The current 4-Hour candle has wicked into the 0.5 Fibonacci zone, which indicates a strong rejection from this area. If the candle closes red, the probability of starting the next bearish wave will increase significantly.
📊 Besides the resistance from the Fibonacci level, the SMA25 is also overlapping with this zone, so this upward move could also be seen as a pullback to the SMA25 before another drop begins.
✨ However, the candle hasn't closed yet, so it's too early to decide anything. In my opinion, Bitcoin has re-entered a choppy and sideways phase that doesn’t provide good and clean positions — most trades like yesterday’s need to be scalps.
🔍 If a deeper correction happens, our lower support levels are already identified (with the most important one being the 110000 zone). For shorts, I’ll look for entries below 110000. As for longs, I’ll wait for confirmation and stabilization above 116000. For now, I’m only observing this box between 110000 and 116000.
❌ Disclaimer ❌
Trading futures is highly risky and dangerous. If you're not an expert, these triggers may not be suitable for you. You should first learn risk and capital management. You can also use the educational content from this channel.
Finally, these triggers reflect my personal opinions on price action, and the market may move completely against this analysis. So, do your own research before opening any position.

TradeCityPro | Bitcoin Daily Analysis #143👋 Welcome to TradeCity Pro!
Let’s dive into the Bitcoin analysis. Today, the weekly candle will close and the market will return to its normal condition starting tomorrow. It’s very important to have a solid analysis today so we can make profits in the upcoming week.
⏳ 4-Hour Timeframe
Yesterday, Bitcoin had another short drop and wicked down to around the 111747 zone, but then returned above the 0.618 Fibonacci level.
💥 Even from this timeframe, it’s clear that a long trigger has formed on lower timeframes, and it seems like a V-pattern is being formed, which we’ll analyze in the lower timeframes.
📊 If the market activates the long trigger today, I’ll try to enter so I don’t miss out in case a bullish move starts with the new weekly candle and I can have an open position.
✔️ The RSI oscillator also entered the oversold zone yesterday and exited it. Since Bitcoin is still above the 110000 zone, I still view the trend as bullish. So this double bottom that formed on the RSI is a very good sign for bullish momentum in the market.
⏳ 1-Hour Timeframe
In the 1-Hour timeframe, we had a short trigger at the 114560 zone in the previous analysis, which was activated and the price moved down. I had mentioned in that analysis that I wouldn’t open a short position with this trigger, and I didn’t.
🔽 Now the position of that trigger has shifted and moved to the 114028 zone. Today I’m watching the market closely, and if the price moves up toward this trigger with increasing volume, I’ll open a long position if 114028 breaks.
🔍 This is one of those positions where you can use either a small or large stop loss. If you go with a larger stop, you can ride the next bullish leg that may push the price back toward the 120000 zone. But if you go with a smaller stop, it becomes a short-term trade that will be closed with smaller risk-to-reward ratios.
📈 Personally, I prefer to go with a larger stop loss so that if Bitcoin starts another bullish leg, I can have a well-positioned entry. (Just make sure to practice proper risk management — I personally won’t risk more than 0.25% on this position since the main momentum hasn’t entered yet.)
💫 As for short positions, I won’t provide any triggers for now because I’m not opening shorts myself, and if you open one, I won’t be able to guide you on what to do with it.
❌ Disclaimer ❌
Trading futures is highly risky and dangerous. If you're not an expert, these triggers may not be suitable for you. You should first learn risk and capital management. You can also use the educational content from this channel.
Finally, these triggers reflect my personal opinions on price action, and the market may move completely against this analysis. So, do your own research before opening any position.

TradeCityPro | Bitcoin Daily Analysis #142👋 Welcome to TradeCity Pro!
Let's get into the Bitcoin analysis. Yesterday, Bitcoin continued its correction and we need to see what is going to happen in the market today.
📅 Daily Timeframe
First, let’s take a look at the higher timeframe. On the daily chart, that curved upward trendline we had was broken by yesterday's candle, and the breakout candle had high volume.
✔️ For now, I don’t consider this trendline as broken and I’m waiting to get confirmation of the break.
🔍 Currently, the price is in a correction phase, and this correction is quite natural since the price had very low volatility for a long time and was stuck below the 120000 zone.
💥 But no trend reversal has occurred yet. In my opinion, as long as the price is above the 110000 zone, the trend is bullish, and I will consider the trend reversal confirmed only if a lower high and a lower low below 110000 are formed.
⏳ 4-Hour Timeframe
Yesterday, the corrective movement of the price continued, and after a pause at the 0.5 Fibonacci level, another bearish leg formed down to the 0.618 zone.
🔔 The RSI oscillator also entered the oversold area and then exited it again. I believe there’s a high possibility that until the end of the week, Bitcoin will range in these areas and the probability of a bullish or bearish move is much lower.
🔽 However, if the 0.618 Fibonacci level breaks, the price can move to lower areas like the 111000 zone. I think the likelihood of this happening in the future is high because that zone is a strong PRZ, and at the same time, it counts as a pullback to the 110000 zone.
📈 In the bullish scenario, if the price is supported from this area and starts to move upward, since we currently have no highs below the 116000 zone, we need to wait until the first bullish leg is formed and then enter on the second leg after the new high is broken.
⚡️ For now, I’m not opening any short or long positions. I prefer the price to form more structure so I can make a more comfortable decision.
❌ Disclaimer ❌
Trading futures is highly risky and dangerous. If you're not an expert, these triggers may not be suitable for you. You should first learn risk and capital management. You can also use the educational content from this channel.
Finally, these triggers reflect my personal opinions on price action, and the market may move completely against this analysis. So, do your own research before opening any position.

TradeCityPro | Bitcoin Daily Analysis #141👋 Welcome to TradeCity Pro!
Let’s dive into Bitcoin analysis. Yesterday, the exact bearish scenario I told you about happened. Let’s see what opportunities the market is offering us today.
⏳ 4-Hour Timeframe
Yesterday, I mentioned that the price had tested the 116829 zone too many times and that this area had become very weak. I also said that if the price made a lower high than 120041, deeper corrections would be likely.
✔️ Another perspective I have on the market is that sometimes certain support and resistance levels simply aren’t strong enough to continue the trend.
🔑 For example, in this case — despite Bitcoin being in an uptrend across all cycles — the 116829 support couldn’t hold, and the price broke it to reach a stronger support zone, one that might be capable of continuing the trend.
📊 Right now, this is what might be happening again. Support levels like 0.5, 0.618, and 0.786 Fibonacci retracement zones could be where the next bullish leg begins.
✅ At the moment, price has reached the 0.5 Fibonacci level, and the previous strong bearish momentum has slightly weakened. If you look at the volume, momentum is still in favor of sellers, but based on the long lower wicks on the candles, we can say the bearish trend is showing signs of weakness.
💥 On the other hand, RSI is approaching 30, and in an uptrend, when RSI nears the Oversold zone, it can often be a good entry point for a long. However, we’re not acting on this yet — we’ll wait for more confirmations before opening any positions.
⭐ For now, there’s no trigger for a long position on this timeframe. A break below 115000 could act as a short trigger, but given the trend Bitcoin is in, I’m not opening any short positions at the moment.
⏳ 1-Hour Timeframe
The price has dropped down to 114560, and I believe today we might enter a corrective phase. However, if the price stabilizes below 114560, the correction could continue. The next targets would be the Fibonacci levels from the 4-hour timeframe.
🔽 I won’t open a short position with the break of 114560, and I suggest you don’t take that short either.
📈 If this move turns out to be a fakeout, the first trigger we have now is at 118736, which is quite far from the current price. For this trigger to activate, we’d need to see a V-pattern form.
🔍 There are no other triggers right now. But if more range structure forms, we might consider opening a risky long on the breakout of the range top.
❌ Disclaimer ❌
Trading futures is highly risky and dangerous. If you're not an expert, these triggers may not be suitable for you. You should first learn risk and capital management. You can also use the educational content from this channel.
Finally, these triggers reflect my personal opinions on price action, and the market may move completely against this analysis. So, do your own research before opening any position.

TradeCityPro | Bitcoin Daily Analysis #140👋 Welcome to TradeCity Pro!
Let’s dive into the Bitcoin analysis. Yesterday, the interest rate decision by the US Federal Reserve was announced, and once again, just like the past few months, it remained unchanged. Let’s see what impact it had on Bitcoin.
⏳ 4-Hour Timeframe
In the 4-hour timeframe, after the announcement of the unchanged interest rate and Powell’s speech, Bitcoin printed a red candle on the support zone and even wicked lower, but then recovered and the price returned back into the box.
✔️ Basically, we can say that this month’s rate decision had no real impact on the market, and Bitcoin is still moving inside its range box. The fact that the support zone wasn’t lost is a positive sign for the continuation of the trend.
⭐ But the important point is this: if the uptrend is going to continue, the price must print a higher high or at least a level equal to 120041, and in my opinion, if for any reason a lower high gets printed, the chances of breaking below 116829 significantly increase.
📊 I currently have no new position on Bitcoin, and all my entries are below 110000. But if 120041 breaks, I’ll open a long position for the next bullish wave that Bitcoin might start.
💥 A major trigger for starting a new leg is the 61.67 level on the RSI. As long as RSI remains below this level, there’s no bullish momentum in the market — and considering that the number of touches to 116829 has increased, the probability of a correction is also rising.
❌ Disclaimer ❌
Trading futures is highly risky and dangerous. If you're not an expert, these triggers may not be suitable for you. You should first learn risk and capital management. You can also use the educational content from this channel.
Finally, these triggers reflect my personal opinions on price action, and the market may move completely against this analysis. So, do your own research before opening any position.

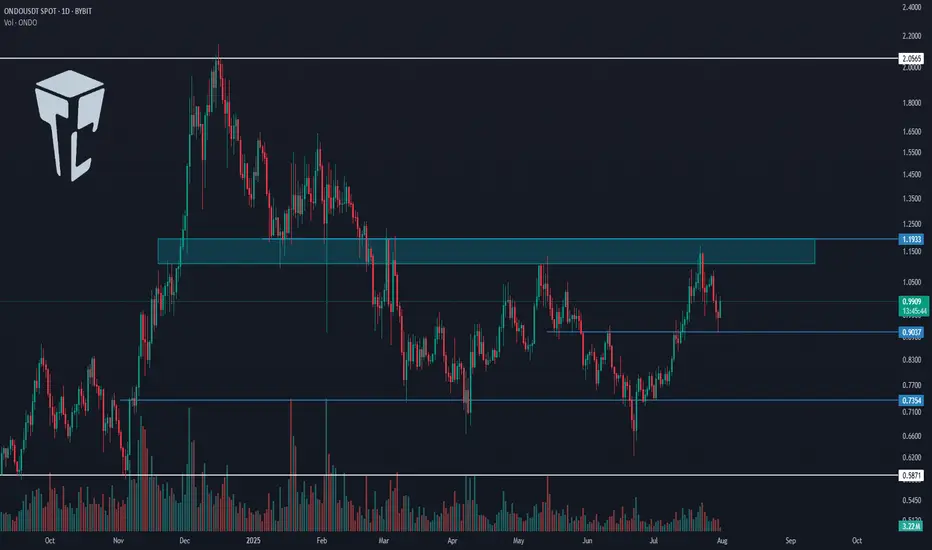
TradeCityPro | ONDO Builds Strength Beneath Key Supply Barrier👋 Welcome to TradeCity Pro!
In this analysis, I want to review the ONDO coin for you — one of the RWA projects, currently ranked 37th on CoinMarketCap with a market cap of $2.93 billion.
📅 Daily Timeframe
In the daily timeframe, as you can see, this coin has formed a range box between the levels of 0.7354 and 1.1933, and the price is currently sitting in the upper half of this box.
✔️ At the moment, the price is hovering around 0.9037, and it’s forming a higher low above 0.7354. If this low gets confirmed, the probability of breaking above 1.1933 increases.
⭐ The 1.1933 zone is a very significant supply level that was previously acting as support in late 2024, and after being broken, has since acted multiple times as resistance.
📊 If this area breaks, we can open a long position, or even buy this coin in spot. Personally, if this trigger is broken, I’ll open a long-term long position.
✨ The target for this position is 2.0565, and once the price reaches this level, we can take profits and consider a spot buy.
📝 Final Thoughts
This analysis reflects our opinions and is not financial advice.
Share your thoughts in the comments, and don’t forget to share this analysis with your friends! ❤️
TradeCityPro | Bitcoin Daily Analysis #139Welcome to TradeCity Pro!
Let's go over Bitcoin's analysis. Today, Bitcoin is showing some signs regarding its next move, and today could be a critical day — especially considering that U.S. interest rate data is set to be released tomorrow.
4-Hour Timeframe
Today, there’s no need to switch to other timeframes — this 4-hour chart tells us everything.
Yesterday, the price was moving toward the 120041 area, which we intended to use as a long trigger, but that didn’t happen. The price failed to stabilize above this level, and RSI was rejected from the 61.67 zone.
Currently, the price has formed a lower high compared to 120041 and is now moving toward the support area around 116000.
Selling volume has significantly increased, which is not good for the bullish trend. If this support level breaks, deeper corrections to the 0.618 or even 0.786 Fibonacci levels could occur.
I’ll take profit on my long position that I opened from below 110000 if the price stabilizes below this zone, but I absolutely won’t open any short positions for now.
In my opinion, as long as the price is above 110000, any drop or correction is simply a better entry point for a long position. However, we shouldn’t buy during a falling market — we must wait for our triggers to activate.

TradeCityPro | DOGE Faces Resistance with Altseason Tailwinds👋 Welcome to TradeCity Pro!
In this analysis, I want to review the DOGE coin for you. One of the first and most popular shitcoins in crypto, which managed to attract a very strong market cap during the previous bull run due to the hype around Elon Musk.
🔍 Currently, this coin has a market cap of $34.06 billion and ranks 8th on CoinMarketCap.
📅 Daily Timeframe
In the daily timeframe, this coin has created a very strong support level at 0.15190, and now after a bullish leg, it has formed a top at 0.27359.
📊 The buying volume increased nicely during this bullish leg, and the price moved up to the 0.27359 resistance.
✔️ Now, after the first touch, the price has started a slight correction and is moving downward. If further touches occur, we can open a long position after breaking the top.
📈 Breaking 0.27359 could be one of those positions that stays open all the way up to 0.46496, and we can buy this coin in spot using the profit from that trade. I will try to have a position open after breaking 0.27359, aiming for 0.46496.
💥 The next trigger we have is the break of 0.31222, but the price should first form some structure after reaching that area, and only after confirmation should we open a position. Just entering based on that break doesn’t seem logical to me.
🔽 If a correction and drop happen, as long as the price stays above 0.15190, there’s no problem for the trend to continue. But if the price stabilizes below that level, a trend reversal might occur.
📝 Final Thoughts
This analysis reflects our opinions and is not financial advice.
Share your thoughts in the comments, and don’t forget to share this analysis with your friends! ❤️

TradeCityPro | Bitcoin Daily Analysis #138👋 Welcome to TradeCity Pro!
Let’s get into the Bitcoin analysis. Today is the start of the week, and it’s very important to begin our trading week with the right analysis and outlook.
📅 Daily Timeframe
On the daily timeframe, as you can see, not much has changed compared to the previous analysis, and the price is still ranging near the supply zone.
✔️ The fact that no price correction has occurred so far shows the strength of the buyers, and even if a correction does happen, as long as the price stays above 110183, the trend will still be considered bullish.
🧩 The main trigger for trend continuation is either the price reaction to the curved trendline or the break of 122733. We can find more optimal triggers in the lower timeframes.
⏳ 4-Hour Timeframe
In this 4-hour timeframe, after a fakeout below 116829, the price corrected down to the 0.5 Fibonacci level and now has returned again to the box between 116829 and 120041.
🔍 The fakeout trigger is 120041, and I’ll try to have at least two positions open in the market when this level breaks — whether on Bitcoin or altcoins.
📈 The main trigger for the next bullish leg is 122733.
If RSI also breaks the 61.67 resistance alongside 120041, the likelihood of the move continuing will increase.
❌ Disclaimer ❌
Trading futures is highly risky and dangerous. If you're not an expert, these triggers may not be suitable for you. You should first learn risk and capital management. You can also use the educational content from this channel.
Finally, these triggers reflect my personal opinions on price action, and the market may move completely against this analysis. So, do your own research before opening any position.

TradeCityPro | INJ Battles Key Resistance Amid Altseason Buzz👋 Welcome to TradeCity Pro!
In this analysis, I want to review the INJ coin for you. It’s one of the RWA and AI projects, currently ranked 63 on CoinMarketCap with a market cap of $1.51 billion.
📅 Daily Timeframe
On the daily timeframe, after a drop to the 6.94 level, this coin has bounced back and is now moving upward along with a rising trendline.
✨ A strong support has formed at 10.28, and after price reacted to this level, a new bullish leg started and pushed the price up to 16.04.
🔔 There is a Maker Seller zone around 16.04 that has repeatedly prevented the continuation of the upward move, and currently price is struggling with it again.
📈 Breaking this zone will initiate a new phase of the trend. I plan to have a long position open if 16.04 is broken.
🛒 This trigger is also suitable for spot buying, and if Bitcoin pair and Bitcoin dominance confirm the move, we can consider buying in spot too. But personally, I prefer opening a futures position.
💥 Breaking the 72.87 zone on the RSI will be a solid confirmation for the entry of bullish momentum, and with this breakout, a new bullish leg can begin.
🔽 If a correction happens, I will wait for the trendline to break and will not open a short position for now.
Currently, the first trigger we have for a short is at 10.28.
📝 Final Thoughts
This analysis reflects our opinions and is not financial advice.
Share your thoughts in the comments, and don’t forget to share this analysis with your friends! ❤️

TradeCityPro | Bitcoin Daily Analysis #137👋 Welcome to TradeCity Pro!
Let’s go over the Bitcoin analysis. I’m making a change to how I analyze Bitcoin — I will no longer include indicators like dominance charts.
🔍 From now on, I’ll be analyzing Bitcoin in daily, 4-hour, and 1-hour timeframes only.
📅 Daily Timeframe
On the daily timeframe, Bitcoin is in a strong uptrend that started from the 78,397 level and in two bullish legs has reached the 122,733 zone.
✅ This level, along with the 0.618 Fibonacci Extension, has created a strong resistance zone. Although price has attempted multiple times to break into or above this area, it has not yet succeeded in closing a candle above or inside the range.
🎲 We also have a curved trendline from higher timeframes, which the price is reacting to even on the daily chart. Currently, the price is near this trendline. There is a possibility that price consolidates over time until it reaches this trendline and then begins its next bullish leg.
📊 If that happens, breaking 122,733 or 120,140 would be triggers for opening a long position on the daily timeframe.
I do not recommend buying Bitcoin on spot right now, because I believe we’re close to the top of this bullish cycle, and this current leg might be the last one.
⭐ A breakout of 76.50 on the RSI would be a strong confirmation of bullish momentum, and would mark the continuation of the uptrend.
🔑 If we get a pullback, the price could correct to dynamic zones like SMA25 or SMA99. Important static support levels are at 110,183 and 100,763.
⏳ 4-Hour Timeframe
In the 4-hour chart, we can see more details of the bullish leg. After the sharp move to 122,733, a correction phase began, forming a range box.
💥 The bottom of the box is around 116,829, which I’ve marked as a zone. It also overlaps with the 0.382 Fibonacci, making it a very important PRZ (Potential Reversal Zone).
The top of the range is at 120,041.
🧩 Yesterday, price made a fakeout to the downside. As you can see, it dumped hard with heavy selling volume and hit the 0.5 Fibonacci level, but couldn’t hold there and quickly bounced back above 116,829.
🧲 Today, I think it's better not to go below the 4-hour timeframe and avoid getting caught up in small market noise.
A break above 120,041 can trigger a long entry.
Another breakdown from the box might trigger a deeper correction.
❌ Disclaimer ❌
Trading futures is highly risky and dangerous. If you're not an expert, these triggers may not be suitable for you. You should first learn risk and capital management. You can also use the educational content from this channel.
Finally, these triggers reflect my personal opinions on price action, and the market may move completely against this analysis. So, do your own research before opening any position.

TradeCityPro | JUP Eyes Breakout as Altseason Momentum Builds👋 Welcome to TradeCity Pro!
In this analysis, I want to review the JUP coin for you. It’s one of the projects in the Solana ecosystem, currently ranked 59 on CoinMarketCap with a market cap of $1.65 billion.
📅 Daily Timeframe
On the daily timeframe, this coin is currently sitting below a very important resistance zone at 0.6312. This is a strong resistance area and serves as the main trigger for a trend reversal in this coin.
✔️ The main support floor for JUP is located at 0.3409, a level price has tested twice before. Now it has returned to 0.6312, and we can see increased market volume at this level, which indicates tension between buyers and sellers.
✨ A breakout of 0.6312 would be a good trigger for a long position, and I plan to open a long if this level breaks. This could potentially be a long-term position with a high risk-to-reward ratio.
🔔 The next major resistance zones are at 0.7858 and 1.1435, which we can use as targets for this position.
🔽 If the price gets rejected from the top and moves down, breaking 0.4186 and 0.3409, we can look to open a short position.
🧩 The break of 0.3409 would confirm the start of a downtrend, and it's one of the key zones where I’ll definitely look to hold a short position if it breaks.
📝 Final Thoughts
This analysis reflects our opinions and is not financial advice.
Share your thoughts in the comments, and don’t forget to share this analysis with your friends! ❤️

EURAUD is currently showing signs of a bearishEURAUD is currently showing signs of a bearish trend continuation. Despite short-term upward movement driven by optimism around the ECB, the overall structure remains vulnerable to downside pressure.
The European Central Bank (ECB) is expected to keep interest rates unchanged, potentially ending a seven-year streak of cuts. While this could bring temporary strength to the Euro, the technical setup still favours the bears.
Watch for a Break Below the Neckline
If price manages to break below the neckline of the current pattern, it could trigger a strong bearish move. First support: 1.77100 Second support: 1.76300
You May find more details in the chart.
Ps: Support with like and comments for more analysis.

TradeCityPro | Bitcoin Daily Analysis #136👋 Welcome to TradeCity Pro!
Let’s get into the analysis of Bitcoin and major crypto indices. As usual in this analysis, I’m going to review the futures triggers for the New York session.
⏳ 1-Hour Timeframe
On the 1-hour timeframe, price is still ranging inside the box, and none of its triggers were activated yesterday.
✔️ The support floor is at 117,342, and another key support zone is around 116,000.
✨ If these zones break, Bitcoin may begin a deep correction. In that case, we can open short positions or close long-term long positions that we’re already holding.
⭐ For long positions, we still have the 119,395 and 120,594 triggers. A breakout of either zone could provide a very good entry point for the next bullish leg of Bitcoin.
👑 BTC.D Analysis
Let’s move on to Bitcoin Dominance. Yesterday, dominance stabilized above the 61.20 zone, and as I mentioned before, breaking this zone led to a bullish leg, which continued up to 62.41, and currently, it has more bullish momentum.
💥 If 62.41 breaks, the bullish momentum will intensify. However, I still believe the overall trend is bearish, and if 60.46 breaks to the downside, the decline could continue.
📅 Total2 Analysis
Let’s go over Total2. This index has continued to correct and has now dropped to the 1.41 zone, which corresponds to the 0.5 Fibonacci level. It has now created a trigger around 1.47.
⚡️ If 1.47 breaks, we can open a long position. Our next trigger will be 1.53.
A breakout of 1.53 would signal the start of the next bullish wave.
📅 USDT.D Analysis
Now to Tether Dominance. This index has finally exited its range box and has broken the 4.25 level.
The current resistance stopping price is 4.36.
🔔 If dominance drops back below 4.25, strong bearish momentum could hit, increasing the likelihood of a breakdown of 4.13.
❌ Disclaimer ❌
Trading futures is highly risky and dangerous. If you're not an expert, these triggers may not be suitable for you. You should first learn risk and capital management. You can also use the educational content from this channel.
Finally, these triggers reflect my personal opinions on price action, and the market may move completely against this analysis. So, do your own research before opening any position.

TradeCityPro | Bitcoin Daily Analysis #135👋 Welcome to TradeCity Pro!
Let’s move on to the analysis of Bitcoin and major crypto indices. In this analysis, as usual, I’m going to review the futures triggers for the New York session.
⏳ 1-Hour Timeframe
Yesterday, Bitcoin broke the 119,395 level but couldn’t hold above it and has now returned below this level, currently sitting on its previous trendline.
✔️ Today, the market will probably try to form more structure, and I think Bitcoin will range.
⭐ However, if it wants to move, we can enter a long position with the trigger at 120,594.
🔽 For a short position, we can enter if the 116,000 support area breaks.
👑 BTC.D Analysis
Let’s move on to Bitcoin Dominance. Yesterday, dominance had a bullish move, and finally, a support floor managed to prevent further drop in dominance.
🧩 A retracement to 61.20 has occurred. If this retracement continues, the upper levels are 61.53 and 62.
A break of 60.46 will start the next bearish leg.
📅 Total2 Analysis
Let’s go to Total2. This index has formed a range box between 1.48 and 1.55 and is still oscillating within it.
🎲 If 1.55 breaks, we can open a long position, and on the other hand, if 1.48 breaks, the price could correct to lower support levels.
📅 USDT.D Analysis
Let’s move on to Tether Dominance. This index also has a range box and is still moving inside it.
🔑 Breaking 4.13 is very important for the future market trend and could lead to a drop in dominance.
