TradeCityPro | Bitcoin Daily Analysis #87👋 Welcome to TradeCity Pro!
Let’s get into the analysis of Bitcoin and major crypto indices. As usual, I’ll review the triggers for the New York Futures session.
⏳ 1-Hour Timeframe
On the 1-hour timeframe, Bitcoin moved sideways yesterday as I mentioned, and after the RSI exited the Overbuy zone, it corrected down to the 102391 area.
🔍 This was a very minor correction, mainly due to the RSI leaving the Overbuy zone. Currently, the oscillator has reset, and if it re-enters Overbuy, we can confirm the start of bullish momentum.
✨ Now the candle has closed above the 103642 area, and if the price stabilizes above this level, it could move toward the main resistance at 106247.
📊 In my opinion, the price will move toward 106247 and then enter a correction because the breakout of 103642 was accompanied by increased volume, and if this volume continues, the probability of this move increases.
📉 If the correction starts from the current level, the first support we have is 102391, and after that, there is no solid support until 99337.
🧩 The reason I’m not using Fibonacci to find support zones is that the price hasn’t confirmed the start of a correction yet, and a proper top hasn’t been formed. I’m waiting for that top and confirmation of the correction before identifying key correction levels.
✔️ For now, only these two support levels are important, and as long as the price is above 99337, the trend remains bullish.
📈 For opening a position today, the Bitcoin trigger at 103642 has been activated and is currently getting a pullback. If you get confirmation from this pullback, you can enter a position — but be careful, there's a very important resistance at 106247 and that zone is highly significant.
👑 BTC.D Analysis
Let’s move to Bitcoin dominance. Yesterday, dominance had a slight correction and pause, and today it broke the 63.61 area and is moving toward the 63.23 support.
⚡️ It seems there’s strong bearish momentum in dominance, and if it continues to drop, I believe it could easily break 63.23 and move further down.
📅 Total2 Analysis
Let’s check out Total2. Yesterday, the 1.17 trigger for this index also activated, and you could open positions on altcoins.
💥 The next resistance we currently have is the 1.22 area, and considering the drop in Bitcoin dominance, this index can easily move toward that resistance.
🔔 At the moment, I can’t give you any trigger on this index — you can only enter based on confirmation from individual coins.
📅 USDT.D Analysis
Now let’s look at Tether dominance. This index has also continued its move and after a short pause, broke below 4.65 and is moving downward.
🎲 For now, the trend in dominance is bearish, which pushes the market upward.
❌ Disclaimer ❌
Trading futures is highly risky and dangerous. If you're not an expert, these triggers may not be suitable for you. You should first learn risk and capital management. You can also use the educational content from this channel.
Finally, these triggers reflect my personal opinions on price action, and the market may move completely against this analysis. So, do your own research before opening any position.
Tradecitypro

TradeCityPro | APT: Testing Momentum After Key Breakout👋 Welcome to TradeCity Pro!
In this analysis, I want to review the APT coin for you. This coin belongs to the Aptos project, which is one of Ethereum’s Layer 2 solutions.
⚡️ APT, with a market cap of $3.6 billion, is currently ranked 32 on CoinMarketCap.
⏳ 4-Hour Timeframe
As you can see in the 4-hour timeframe, after finding support at the 4.687 zone, the price made a very sharp bullish move and reached 5.708. After an initial rejection, it has now managed to stabilize above this level.
🔍 If this bullish move continues, we could see another upward leg, with the next resistance at 6.047. If this level breaks, the price could move up to 6.752.
✔️ There’s a very important RSI ceiling at 80.76, which has consistently caused rejections after sharp upward moves. If the price aims for another bullish wave, this level will be critical and could mark the top of the move.
⭐ A breakout above this level seems unlikely for now, since 80.76 is a very high reading for the RSI oscillator, and the chance of it breaking is quite low. But if it does happen, we could see an extremely sharp and unusual move.
🔽 As for a bearish scenario and short positions, we currently need to wait for a trend reversal. If the breakout above 5.708 turns out to be fake and the price starts moving downward, we can look for a trigger in a lower timeframe to enter.
🔑 But keep in mind that short positions in these market conditions are very, very risky. And if you do open such a position, make sure to secure profits frequently with small risk-to-reward setups.
📝 Final Thoughts
This analysis reflects our opinions and is not financial advice.
Share your thoughts in the comments, and don’t forget to share this analysis with your friends! ❤️

TradeCityPro | Bitcoin Daily Analysis #86👋 Welcome to TradeCity Pro!
Let’s move on to the analysis of Bitcoin and major crypto indices. As usual, in this analysis I want to review the futures session triggers for New York.
✔️ Yesterday the market made another bullish leg and has now reached the 103642 resistance. There’s a chance we might enter a correction phase because the move has been very sharp and I think the market needs a rest.
⏳ 1-Hour Timeframe
As you can see in the 1-hour timeframe, we had a bullish move that continued after a pullback to the 99337 zone, climbing all the way to 103642.
💥 The RSI trigger I gave you also got activated and yesterday you could open a momentum-based position. I personally already have a long on Bitcoin from near 88000, so I didn’t open another one yesterday.
⚡️ Currently, RSI is exiting the Overbuy zone, and if that happens, the chance of entering a correction phase increases. As long as the price is above 99337, the main market momentum is still bullish and we’re not confirming a trend reversal just yet due to this strong momentum.
📈 Over the past few weeks, I emphasized a lot that you should definitely have at least one long position open, and not to open short positions unless a trend reversal is confirmed. I hope you’ve used the analyses and opened proper positions on either Bitcoin or altcoins.
📊 Today, it’s a bit late to open new positions because I think the market has made its main move and now we’re waiting for a correction phase to start. However, if you don’t have a position, you can enter a very risky trade on the breakout of the 103642 level.
🚨 This position is very risky and I personally won’t open it because we’re near the ATH and I think even if Bitcoin moves up to 106247, it’ll likely take a breather and won’t go straight up.
🔼 In any case, if you want to open a long position, I personally suggest waiting for a new structure to form and then look for a trigger. Otherwise, the only current trigger we have is 103642.
📉 As for a short position, you definitely know by now that with this strong bullish momentum, I’m not going to give you a short trigger. You have to wait for a proper structure for short entries.
👑 BTC.D Analysis
Let’s go to Bitcoin dominance. Yesterday dominance finally made a bearish move. It was a very sharp and one-sided drop to the 63.61 level without any corrections.
🧩 Currently, dominance is very bearish and altcoins have moved up strongly. Especially Ethereum, which after a long time made a sharp bullish move. I think as the market starts to correct, dominance will also move up and correct.
⭐ For altcoin entries, I personally wait for dominance to make a short-term upward correction and if it continues the second leg downward, I’ll enter altcoins.
📅 Total2 Analysis
Let’s move on to Total2. This index also had a sharp bullish move and after breaking 1.05, it managed to climb to 1.17.
🔔 I’ve talked a lot about the 1.05 zone and repeatedly told you to make sure you have a long position if it breaks. With that trigger activated, the Total2 uptrend has started and reached the 1.17 resistance.
✨ Currently, the only available trigger is the breakout of the 1.17 zone, and if it’s broken, we can enter another position.
📅 USDT.D Analysis
Let’s move to USDT dominance. Yesterday the 4.82 trigger was activated and dominance continued to fall. I also emphasized the 4.99 breakdown a lot and once again, I hope you’ve used the analysis and opened a position.
👀 Currently, the price has reached the 4.65 zone, which is very important and could trigger a correction. But if this zone breaks, we can open short positions.
💫 Overall, today if you notice, all the charts we analyzed seem to have made enough moves and now it’s time for a correction. However, if their triggers are activated and you don’t already have a position, you can still enter.
❌ Disclaimer ❌
Trading futures is highly risky and dangerous. If you're not an expert, these triggers may not be suitable for you. You should first learn risk and capital management. You can also use the educational content from this channel.
Finally, these triggers reflect my personal opinions on price action, and the market may move completely against this analysis. So, do your own research before opening any position.

TradeCityPro | Bitcoin Daily Analysis #85👋 Welcome to TradeCity Pro!
Let’s move on to the analysis of Bitcoin and key crypto indices. As usual in this analysis, I’ll review the futures triggers for the New York session.
📰 Yesterday, the U.S. interest rate decision came out, which remained unchanged and didn’t have much impact on the market—this was expected for some time. Now that the news had no real effect, the market can continue its previous trend.
⏳ 1-Hour Timeframe
As you can see in the 1-hour timeframe, after the news came out yesterday, the price ranged a bit and then moved upward, triggering the 97409 level. I hope you entered a position with that trigger because I had emphasized it strongly.
✔️ Currently, the price has reached the 99337 zone and is stabilizing above it. If this holds, the next resistance level is 101965.
💥 The RSI oscillator is also in the Overbuy zone, which is helping the price maintain its bullish momentum. There’s a resistance at 75.77 on the RSI, and if that breaks as well, we could see a very sharp move in the chart.
📊 Buy volume has been strong in this leg and aligns with the trend. If volume starts decreasing, divergence will appear, and we’ll get the first sign of trend weakness. Just remember—weakness doesn’t mean trend reversal.
📉 As for short positions, I think by now you know my trading style. In a market like this, where momentum is strongly bullish and price is breaking resistance one after another, I don’t think opening a short position makes sense. We should wait for proper structure to form before considering a short.
👑 BTC.D Analysis
Moving on to Bitcoin dominance—yesterday the 65.28 zone was broken and price moved up near the top of the channel, but then reversed and has now dropped to the midline of the channel.
🔑 Currently, the dominant trend is still bullish, but short-term momentum is bearish, and there’s a good chance it drops further to 64.91.
⚡️ Since the higher timeframes are still bullish, we could see bullish momentum return at any time. Technically, the 64.91 zone is the next major support.
📅 Total2 Analysis
Let’s look at Total2—finally, the 1.05 trigger was activated, and Total2 started moving upward. I had strongly emphasized this trigger as well, and I hope you took advantage of it.
🧩 Price has now reached the 1.07 level, and if that breaks, it could move up to 1.1.
🔼 If this bullish move turns out to be a fakeout, the next valid triggers for short positions are a break of 1.03 and then 1.01.
📅 USDT.D Analysis
Now to Tether dominance—this index also broke the 4.99 level and is now trending downward.
🔍 If this move continues, we could see a drop to around 4.82. That would allow the market to continue its upward movement even further.
❌ Disclaimer ❌
Trading futures is highly risky and dangerous. If you're not an expert, these triggers may not be suitable for you. You should first learn risk and capital management. You can also use the educational content from this channel.
Finally, these triggers reflect my personal opinions on price action, and the market may move completely against this analysis. So, do your own research before opening any position.

TradeCityPro | HYPE: Bullish Momentum Builds Near Resistance👋 Welcome to TradeCity Pro!
In this analysis, I’m going to review the HYPE coin for you. The Hyperliquid project is one of the DEX projects in the crypto space that also functions as a Derivatives platform, and it currently holds the highest 24-hour volume among all DEXs.
🔍 The token for this project, with the symbol HYPE, has a market cap of $7.23 billion and is ranked 20th on CoinMarketCap.
⏳ 4-Hour Timeframe
In the 4-hour timeframe, as you can see, this coin is in an uptrend with an ascending trendline, and it’s currently encountering resistance at 21.48.
📈 If the price stabilizes above this zone, a new bullish wave can begin, with the next resistance being at 22.799.
✔️ You can enter a long position using the 21.48 breakout trigger. Buying volume has increased significantly, which raises the chances of this level breaking.
📊 For short positions and a potential bearish trend in this coin, the first trigger would be a rejection from the 21.48 resistance. If the price gets rejected at this level, the likelihood of breaking the trendline increases.
⭐ A break of the trendline itself can also serve as a trigger. Breaking this trendline would eliminate bullish momentum in the market, and a breakdown below the 39.29 level on the RSI would further support bearish momentum.
🔽 The main short position can be opened upon breaking the 19.552 level. This is a very strong support, and if the price closes below it, it could drop further to 17.88.
👀 Overall, the long setup on this coin looks quite logical, and if the 4-hour candle closes as is and doesn’t turn out to be a fakeout, it could be a great entry opportunity.
📝 Final Thoughts
This analysis reflects our opinions and is not financial advice.
Share your thoughts in the comments, and don’t forget to share this analysis with your friends! ❤️

TradeCityPro | Bitcoin Daily Analysis #84👋 Welcome to TradeCity Pro!
Let’s dive into the analysis of Bitcoin and major crypto indices. As usual, I’m going to review the New York futures session triggers for you.
⏳ 1-Hour Timeframe
As you can see in the 1-hour timeframe, yesterday after news of tensions between India and Pakistan, Bitcoin moved upward and made a sharp rally to the 97409 zone, returning once again to this high.
📰 This news created fear in the market, and the buying that occurred was driven by fear and news impact. In my opinion, this bullish leg won’t be sustainable in the long term unless the price stabilizes above the 97409 level and starts a new upward leg.
✨ If the 97409 level is broken, we can enter a long position since it aligns with the current bullish trend, and we can position ourselves for the breakout with a wide stop-loss.
✔️ But make sure your stop-loss is wide and placed below the market’s main support because a significant resistance is being broken, and there's a high chance of volatility before the market actually moves upward. A tight stop-loss may get triggered before the actual rally begins.
💥 A momentum confirmation for today’s long position could be RSI entering the Overbuy zone, and if that happens, the chances of breaking 97409 increase significantly.
📉 For a short position, we should wait and see how the news impact plays out in the market. If it turns out to be driven by FOMO, naturally in the next few days, the price may move back down, and we could enter short positions on breaks of levels like 95370 or 93626.
👑 BTC.D Analysis
Let’s move to Bitcoin Dominance. Yesterday, dominance stabilized above the 64.91 level and managed to move up to 65.25.
🎲 Currently, Bitcoin is a much better option for long positions since dominance is rising, and even breaking 65.28 would confirm another bullish leg in dominance, potentially pushing it toward the top of the channel.
📅 Total2 Analysis
Let’s analyze Total2. Yesterday, this index faked a breakdown below 1.01 and simultaneously moved upward with the news, now reaching the 1.03 zone. A break of this zone could confirm a bullish move toward 1.05.
⭐ The main trigger for a long position remains the break of 1.05, and I strongly recommend being positioned if that level is broken.
🔽 For a short position, you can still enter on a break of 1.01 — I still think it’s a valid trigger.
📅 USDT.D Analysis
Now for USDT Dominance: yesterday, this index also faked a move above the 5.20 level and has since dropped to 5.04.
💫 Activation of the 5.04 trigger could be confirmation for a long position and a sign of USDT dominance starting to decline. The main trigger remains the break of the 4.99 bottom.
❌ Disclaimer ❌
Trading futures is highly risky and dangerous. If you're not an expert, these triggers may not be suitable for you. You should first learn risk and capital management. You can also use the educational content from this channel.
Finally, these triggers reflect my personal opinions on price action, and the market may move completely against this analysis. So, do your own research before opening any position.

TradeCityPro | SUI: Bullish Push Faces Key Resistance Test👋 Welcome to TradeCity Pro!
In this analysis, I want to review the SUI coin for you. It's one of the DeFi layer-1 projects that was highly hyped in 2024 and has recently gained renewed attention due to some news from the project.
🔍 This project's coin, with the symbol SUI, has reached a market cap of $11.3 billion, ranking it 11th on CoinMarketCap.
📅 Daily Timeframe
As you can see in the daily timeframe, since the last analysis I shared in this channel, the price has rebounded from the support zone I highlighted and, after breaking the trendline, made a bullish leg up to 3.6402.
📊 A significant amount of buying volume has entered the market, and the RSI has entered Overbuy territory. These two factors drove the bullish move, and the 3.6402 resistance is a key level that has temporarily held off further price increases.
✔️ Currently, we’re seeing a few corrective candles that caused the price to reject from this resistance, but it's holding up well and still looks poised to move back toward this level.
🛒 For spot buying, if the price moves back toward this area, you can enter a position on a break of 3.6402. The next trigger is the break of 4.0866, and the main resistance ahead is 5.2689.
🔽 If a correction occurs, support levels are 2.7830 and 2.2495. If price retraces, these can serve either as short targets or long entry zones depending on the price reaction.
📉 Confirmation of trend reversal would come if the price fails to make a higher high above 3.6402 and breaks the current low. After that, we can consider opening a short position.
📝 Final Thoughts
This analysis reflects our opinions and is not financial advice.
Share your thoughts in the comments, and don’t forget to share this analysis with your friends! ❤️

TradeCityPro | Bitcoin Daily Analysis #83👋 Welcome to TradeCity Pro!
Let’s dive into the Bitcoin analysis and key crypto indices. As usual, I want to review the triggers for the New York futures session.
🔍 Today, I’ll provide the analysis in the 4-hour timeframe, since not much has changed on the 1-hour chart compared to yesterday, and it's better to take a slightly longer-term look at the chart.
⏳ 4-Hour Timeframe
As you can see in the 4-hour chart, we have an upward leg that started from the 84,000 zone and extended to 97,108. Currently, it's ranging between 93,626 and 95,370.
✔️ The main market top lies at 97,108, but the price has formed a range slightly lower, with 93,626 acting as support.
⚡️ There's a strong divergence visible in the RSI — while Bitcoin has formed three consecutive higher highs, RSI has printed lower highs. This divergence was activated when RSI broke below 50, and the price corrected to 93,626.
📊 In my opinion, the market has now digested the divergence, but the impact it had was a correction down to this level. If 93,626 breaks, deeper corrections could follow.
✨ The 93,626 zone overlaps with the 0.236 Fibonacci retracement and forms a PRZ. If this level breaks, we can open a short position. I open this kind of trade in lower timeframes as a scalp and take quick profits, since it’s counter-trend.
🔽 The maximum short-term target I expect for this trade is the 91,945 area. It's possible that the price corrects further or even reverses trend, but it's not logical in my strategy to hold these kinds of trades longer.
🔑 The key supports ahead are 91,945 (which overlaps with 0.382 Fibonacci), and further down are the 0.5 and 0.618 Fibonacci levels.
📈 For a long position, breaking 95,370 is currently the best trigger. You can also enter on a break of 97,139, but there's strong resistance at 98,828 that could halt the upward move.
🔼 If the price corrects and reaches 91,945, you can consider a long entry based on the price’s reaction to the supports I mentioned.
👑 BTC.D Analysis
Let’s move on to Bitcoin dominance. On the 4-hour chart, there’s an ascending channel where price is moving, with multiple touches. Right now, it’s testing resistance at 64.91.
☘️ If this level breaks, dominance could move up to the top of the channel. There’s also a very important static resistance at 65.59. If price reaches this area, we need to watch its reaction.
📅 Total2 Analysis
Now onto Total2. Similar to Bitcoin, it had a bullish leg, but corrected more deeply — down to the 0.382 Fibonacci retracement, and now it’s at the 1.01T support.
⭐ If this zone breaks, the next supports are at the 0.5 and 0.618 Fibonacci levels. There’s also a strong support at 980B, and the major bottom is at 932B.
📉 For a short position, breaking 1.01T is suitable. For a long position, a bullish reaction from this same area is a good trigger. The main long trigger is the break of 1.05T.
📅 USDT.D Analysis
Let’s move to Tether dominance. This indicator has reached a major top at 5.19. If this level breaks, it can move upward.
👀 If it breaks, the next resistance is 5.37. This move would coincide with a market correction or drop.
📊 To confirm a bearish Tether dominance (bullish market), rejection from 5.19 is a good trigger. The main trigger is still the break of 4.99.
❌ Disclaimer ❌
Trading futures is highly risky and dangerous. If you're not an expert, these triggers may not be suitable for you. You should first learn risk and capital management. You can also use the educational content from this channel.
Finally, these triggers reflect my personal opinions on price action, and the market may move completely against this analysis. So, do your own research before opening any position.

TradeCityPro | SAND: Critical Support Test After Pullback👋 Welcome to TradeCity Pro!
In this analysis, I want to review the SAND coin for you. It’s one of the most popular Metaverse projects, widely recognized and among the top in its category.
✔️ This project’s coin currently holds a market cap of $693 million and ranks 91st on CoinMarketCap.
⏳ 4-Hour Timeframe
As you can see on the 4H chart, after a bullish leg that pushed the price up to 0.3140, a correction phase began. Following the break of 0.2903, the price has now corrected down to 0.2714.
🔍 If this 0.2714 level breaks, the price could continue down to the support at 0.2437 — so a break below 0.2714 would be a valid short entry.
👀 Personally, I prefer waiting for the price to first bounce off 0.2714, move upward, and print a lower high relative to 0.2903, then break 0.2714 on a second attempt. In that case, the short setup becomes much more reliable.
🔽 That said, even if the level breaks now without a bounce — since RSI is already near the oversold zone — I’ll still open a short. If RSI enters oversold, it could lead to a sharp drop.
⚡️ One negative factor for short positions is that volume has been decreasing since the price started correcting from 0.3140, which isn't a good signal for further downside — there’s a divergence between price and volume.
📈 However, that’s a positive signal for potential long positions. When volume drops during a correction in an uptrend, it shows buyers still have control. As long as this divergence persists, the uptrend is more likely to continue than to reverse.
📊 For long positions, if buying volume enters the market and the price holds above 0.2714, you can enter based on lower-timeframe structure breaks. The main long entry will be confirmed once the price breaks above the 0.3140 high.
📝 Final Thoughts
This analysis reflects our opinions and is not financial advice.
Share your thoughts in the comments, and don’t forget to share this analysis with your friends! ❤️

TradeCityPro | INJUSDT Ready for a Big Move?👋 Welcome to TradeCityPro Channel!
Let’s dive in and analyze one of the popular crypto projects, INJ, which has a high likelihood of movement, and check our entry triggers together.
🌐 Overview Bitcoin
Before starting the analysis, I want to remind you again that we moved the Bitcoin analysis section from the analysis section to a separate analysis at your request, so that we can discuss the status of Bitcoin in more detail every day and analyze its charts and dominances together.
This is the general analysis of Bitcoin dominance, which we promised you in the analysis to analyze separately and analyze it for you in longer time frames.
📊 Weekly Time Frame
On the weekly time frame, I see that the seventh period is stable, INJ, and compared to the majority of altcoins that have their own low price levels, it is in a better space and is engaged in its own supports!
After breaking the primary trend ceiling, namely 9.28, we experienced a sharp upward movement and formed a historical ceiling at $53, and after forming a distribution box and breaking the important floor of 16.20 and pulling back to it, we experienced a continued decline.
We have now reached support again, which was previously a very important resistance, and now, as a result, it is probably not lost, but the weekly candle is a very good and bearish candle! Don’t forget to save your profit, your strategy booklet, and your positions, otherwise, you will have made a 450% move without adding anything to your capital!
📉 Daily Time Frame
On the daily time frame, our trend is completely bearish as you can see, and the events are completely accompanied by the formation of a downward bottom and top, but we are likely to suffer for a while.
After getting rejected from 34.16 and forming a box between 20.16 and 25.93 and losing the bottom, it made a move and then while pulling back with low volume and the next conversion to red, it became an inverted Sharpe, we experienced a decline!
After breaking the daily trendline, which was also an important trendline, its trigger at 8.48 was broken, and we are currently engaged with the resistance at 10.47, and the next and most important trigger, so to speak, is after breaking 10.47, and you can even have a spot buy with this level!
🕓 4-Hour Timeframe
In the 4-hour time frame, we are also ranging between the box of 9.24 to 10.41, and practically, whichever side we break, we can say we can take its position and go along with it!
📈 For a long position, the trigger is completely clear, and after breaking 10.41, make sure to take a long position, and you can even open a position before this trigger breaks with the presence of momentum in lower time frames!
📉 For a short position, we have just formed the support at 9.24, and if we bounce from this support and hit a lower high, or better yet, get rejected before 10.41, we go for a short position and a break of 9.24!
✍️ Final Thoughts
Stay level headed, trade with precision, and let’s capitalize on the market’s top opportunities!
This is our analysis, not financial advice always do your own research.
What do you think? Share your ideas below and pass this along to friends! ❤️

TradeCityPro | Bitcoin Daily Analysis #82👋 Welcome to TradeCity Pro!
Let’s dive into the analysis of Bitcoin and key crypto indicators. As usual, I’ll walk you through the futures triggers for the New York session.
⏳ 1-Hour Timeframe
As you can see, yesterday the price stabilized below 95370 and completed a downward leg to 93626, reacting exactly to the level I pointed out in the previous analysis.
✔️ I mentioned earlier that you could enter a short position after breaking 95370 — but remember, this position is against the higher timeframe trend, so the downward move will likely end once it hits the first support, since the market momentum remains bullish on larger timeframes.
💥 Currently, the price has reacted to 93626 and seems to be resting from the previous downward move. I believe a new range box may form between 95370 and 93626 — if that happens, I’ll go long on a break above 95370.
🔽 For short positions, given the bearish momentum in this timeframe, we can look to re-enter on a break below 93626 in the next retest.
📊 Watch volume and RSI today. The volume of red candles has been much higher than bullish ones, which increases the chance of a deeper correction. If you’re shorting, keep a tight stop-loss, take profits quickly, and treat it as a scalp trade.
📈 For long positions, since it’s against the short-term trend, you’ll need a wider stop — but if the correction ends and a new bullish leg begins, the trade may stay open longer.
🧩 As for RSI: as long as it stays below 50, market momentum is bearish. A break below 30 and entry into oversold increases the likelihood of more downside.
👑 BTC.D Analysis
Bitcoin dominance broke 64.77 yesterday and retraced to 64.60. If this downward move continues, we could see early signs of a trend shift.
✨ Important note: dominance has been in an uptrend on higher timeframes, so a break of 64.60 only confirms a short-term correction. Don’t take it as a trend reversal just yet.
💫 If dominance continues to drop and the market rises, altcoins could outperform Bitcoin. Conversely, if dominance rises again, Bitcoin will rally more than altcoins.
📅 Total2 Analysis
Total2 broke below 1.03 yesterday, retested it, and now looks set to continue downward. The next support is at 1.00 — if you’re already short, consider taking profits at that level.
☘️ We’ll get full trend reversal confirmation with a break below 1.00. For long positions, the 1.05 breakout is extremely important. I strongly recommend not missing that trigger if it happens.
📅 USDT.D Analysis
USDT dominance stabilized above 5.10 yesterday, moving further away from 4.99, and is now testing 5.19. A break above 5.19 would be a strong signal that a deeper market correction is starting.
🔑 On the flip side, a break below 4.99 is still the best and most important trigger to confirm the market’s return to a bullish trend.
❌ Disclaimer ❌
Trading futures is highly risky and dangerous. If you're not an expert, these triggers may not be suitable for you. You should first learn risk and capital management. You can also use the educational content from this channel.
Finally, these triggers reflect my personal opinions on price action, and the market may move completely against this analysis. So, do your own research before opening any position.

TradeCityPro | TIA: Key Support Test in Cosmos-Based Token👋 Welcome to TradeCity Pro!
In this analysis, I want to review the TIA coin for you. This project is one of the protocols in the Cosmos ecosystem and currently ranks 53 on CoinMarketCap with a market cap of $1.51 billion.
📅 Daily Timeframe
As you can see on the daily chart, there's a descending trendline, and the price has been moving down along with it. Currently, the price has reached its main support zone at 2.274.
✨ This is the most critical support for this coin, and if it breaks, the price will move toward a new all-time low. So, buyers will do everything they can to protect this support.
💥 If the price gets supported at this level, the first trigger for opening a long position would be the breakout of the descending trendline. That trigger level is the break of 2.956.
🛒 You can also use this trigger for spot buying. The main trend reversal confirmation comes with a break above 4.324. However, in any case, if any of these triggers are activated, I personally will wait for Bitcoin dominance to show a trend reversal before buying altcoins on spot using the first solid trigger I find.
🔽 For short positions, the key point to remember is that the trend is already downward, so we don’t need a trend reversal confirmation to go short.
⭐ The short trigger is very clear and straightforward — if the 2.274 level breaks, you can enter a short position. Additionally, a pullback to the trendline can also be used as an entry point.
📝 Final Thoughts
This analysis reflects our opinions and is not financial advice.
Share your thoughts in the comments, and don’t forget to share this analysis with your friends! ❤️

TradeCityPro | Bitcoin Daily Analysis #81👋 Welcome to TradeCity Pro!
Let’s get into the analysis of Bitcoin and the key crypto indices. As usual, I’ll review the futures triggers for the New York session.
⏳ 1-Hour Timeframe
As you can see, Bitcoin has continued its correction down to the 95370 level and is currently testing this zone.
✔️ If the price breaks below this level and moves further down, we will start to see signs of a trend reversal. However, for short positions, I personally prefer to wait for a confirmed trend reversal.
📈 For long positions today, if the price pulls back to the 95370 zone, you can consider entering. Confirmation of the pullback can be taken from lower timeframes through candlestick signals or structural breaks.
📊 Market volume increased during the last corrective leg, which could raise the probability of a break below 95370.
👑 BTC.D Analysis
Moving on to Bitcoin dominance — the range between 64.77 and 64.91 still holds, with price fluctuating within.
⚡️ A breakout above 64.91 would confirm the continuation of the uptrend. A break below 64.77 could suggest a deeper correction.
📅 Total2 Analysis
Looking at Total2, the 1.03 support has broken and price is now moving downward. If this trend continues, it could drop to lower support levels.
⭐ However, if the break below 1.03 turns out to be a fakeout, price could rebound and head back toward 1.05.
📅 USDT.D Analysis
Finally, USDT dominance has closed above 5.10 today and may be starting its bullish leg.
💥 If this upward move continues, the market could experience a broader sell-off. Should Bitcoin triggers activate, this would be a good context to consider short positions.
❌ Disclaimer ❌
Trading futures is highly risky and dangerous. If you're not an expert, these triggers may not be suitable for you. You should first learn risk and capital management. You can also use the educational content from this channel.
Finally, these triggers reflect my personal opinions on price action, and the market may move completely against this analysis. So, do your own research before opening any position.

TradeCityPro | Bitcoin Daily Analysis #80👋 Welcome to TradeCity Pro!
Let’s dive into the Bitcoin analysis and key crypto market indicators. As usual, I’ll review the triggers for the New York futures session.
⏳ 1-Hour Timeframe
Yesterday, price made a bullish move and broke the 97139 zone, but later it turned out to be a fake breakout, and now it’s moving downward.
🔍 It’s likely that this downward move is just a pullback toward the SMA99 zone, and price may bounce back up afterward. If SMA99 breaks, deeper corrections down to 95370 are possible.
✔️ In my view, as long as price stays above the 95370 zone, Bitcoin remains in an uptrend. Only once price drops below this level can we start identifying potential bearish triggers.
📈 For now, we need to wait for more structure to develop before entering any positions. The 97139 level still remains a strong bullish trigger, but it’s best to wait for a reaction to it first so we can pinpoint the exact line, and then enter upon its breakout.
⚡️ Nothing more to add about Bitcoin for now — it’s Saturday, a weekend, and the chances of ranging price action are high.
👑 BTC.D Analysis
Looking at BTC dominance, yesterday it made a slight corrective move and pulled back to 64.77, where it seems to have found support.
📊 The next bullish trigger is the breakout of 64.91. Overall, the trend is still bullish, so if you're considering multi-day or swing positions, Bitcoin remains a better choice than altcoins.
📅 Total2 Analysis
Turning to the Total2 chart, this index was rejected from the 1.05 resistance once again yesterday and failed to hold above it. Until that changes, altcoins likely won’t see any significant upward momentum.
🔑 For downside movement in Total2, the trigger remains a break below 1.03.
📅 USDT.D Analysis
Now to Tether dominance — yesterday, this index finally closed a candle below the 4.99 level, but it was a fakeout, and it moved back above, once again preventing the broader market from turning bullish. This fakeout could inject bearish momentum into the market, potentially leading to deeper corrections.
⭐ For now, the 4.99 level still serves as a strong trigger for a bearish USDT dominance and thus a bullish signal for the market. A break above 5.10, however, would be a solid trigger for USDT dominance to trend higher.
❌ Disclaimer ❌
Trading futures is highly risky and dangerous. If you're not an expert, these triggers may not be suitable for you. You should first learn risk and capital management. You can also use the educational content from this channel.
Finally, these triggers reflect my personal opinions on price action, and the market may move completely against this analysis. So, do your own research before opening any position.

TradeCityPro | LDO: Watching for Breakout in DeFi Leader’s Range👋 Welcome to TradeCity Pro!
In this analysis, I’m going to review the LDO coin — one of the well-known DeFi projects within the Ethereum ecosystem with a significantly high TVL.
✔️ This project’s token currently has a market cap of $748 million, placing it at rank 86 on CoinMarketCap.
⏳ 4-Hour Timeframe
As you can see on the 4-hour chart, after a downtrend, LDO formed a bottom around the 0.676 zone and managed to rally up to 0.868.
🔍 Currently, the price is consolidating below that resistance in a ranging box. A breakout from either direction of the box could determine the next trend.
⭐ If the box breaks upward and the 0.868 level is breached, we can consider the prior downtrend over, and the price would be forming a new bullish structure. However, there is another resistance at 0.904 right above, and there’s a possibility of rejection from that level after the 0.868 breakout.
📈 For a long position, I personally plan to enter upon the breakout of 0.868. While it’s possible that the price might reverse from 0.904, I prefer having an earlier entry and using a more accessible trigger.
🔽 On the other hand, if the box breaks to the downside, the price might revisit the 0.676 support and potentially start a new bearish leg in line with the longer-term downtrend.
📉 The first short trigger is the break of 0.818 (the lower boundary of the box), but there’s another minor support at 0.795, which may cause a bounce.
👀 I personally prefer to wait for the 0.795 level to break for a short entry, given that market momentum is currently bullish, and I prefer a more reliable trigger for shorts.
📊 Volume within this range has been decreasing, which is normal in such consolidation phases. The longer the price stays in this range, the lower the volume tends to be — and typically, a breakout will lead to a sharper move.
The RSI oscillator also has a support zone at 43.17. If this level is broken, it could signal incoming bearish momentum and increase the probability of a downside breakout.
📝 Final Thoughts
This analysis reflects our opinions and is not financial advice.
Share your thoughts in the comments, and don’t forget to share this analysis with your friends! ❤️

TradeCityPro | Bitcoin Daily Analysis #79👋 Welcome to TradeCity Pro!
Let’s dive into Bitcoin and key crypto index analysis. As usual, in this analysis, I’ll walk you through the futures session triggers for the New York session.
⏳ 1-Hour Timeframe
On the 1-hour timeframe, as you can see, yesterday the price stabilized above the 95370 zone and continued its movement up to 97139.
✔️ The reason the price couldn’t move higher is that the RSI failed to stay above the 70 level and didn’t enter the Overbuy zone — it got rejected there. As a result, the price also got rejected from the 97139 resistance and is currently in a corrective phase.
🧩 The SMA25 indicator has now caught up to the price, and this could bring upward momentum into the market. If that happens, the price might resume its upward move, and breaking the 97139 high could lead to a continuation toward the 98828 zone.
📊 Volume increased during the bullish candles, but after reaching the 97139 high, volume returned to previous levels, and the price has been ranging.
⚡️ Today, if RSI enters the Overbuy zone, a bullish move is very likely — in that case, I recommend definitely holding a long position.
🔽 As for short positions and bearish sentiment on Bitcoin, as I’ve been saying for a while, we should wait for a proper trend reversal before entering short trades.
📈 If the price doesn’t respond to the SMA25 and keeps ranging, the next parameter that could drive bullish momentum is the SMA99.
👑 BTC.D Analysis
Moving to Bitcoin Dominance — BTC.D is still trending upward. Yesterday, after breaking the 64.72 ceiling, it started a new bullish leg, and so far, there’s no sign of trend weakness.
🎲 I suggest waiting for a new structure to form. For now, it’s still rising, and if this continues, Bitcoin will likely outperform altcoins.
📅 Total2 Analysis
Looking at Total2, this index was rejected from the 1.05 resistance yesterday. The reason is that Bitcoin dominance surged, meaning not much money flowed into altcoins, and Total2 couldn’t break its ceiling.
🔼 If BTC.D reverses and pulls back, a lot of capital could move into altcoins — in that case, we can consider opening long positions on altcoins.
📅 USDT.D Analysis
Now to Tether Dominance — another reason Bitcoin couldn’t extend its bullish leg yesterday was this indicator. Support at 4.99 held, preventing money from entering the market, and causing the correction phase.
💫 Currently, the 4.99 level remains a crucial trigger. If it breaks, the main bullish trend in the market could begin. On the other hand, a break above 5.10 would likely push the market into a deeper correction.
❌ Disclaimer ❌
Trading futures is highly risky and dangerous. If you're not an expert, these triggers may not be suitable for you. You should first learn risk and capital management. You can also use the educational content from this channel.
Finally, these triggers reflect my personal opinions on price action, and the market may move completely against this analysis. So, do your own research before opening any position.

TradeCityPro | ENA: Expansion Pattern Near Critical Break Levels👋 Welcome to TradeCity Pro!
In this analysis, I want to review the ENA coin for you. The Ethena project is one of the DeFi projects in crypto that has attracted a lot of hype in this category.
💥 ENA coin, with a market cap of $1.7 billion, ranks 50th on CoinMarketCap.
📅 Daily Timeframe
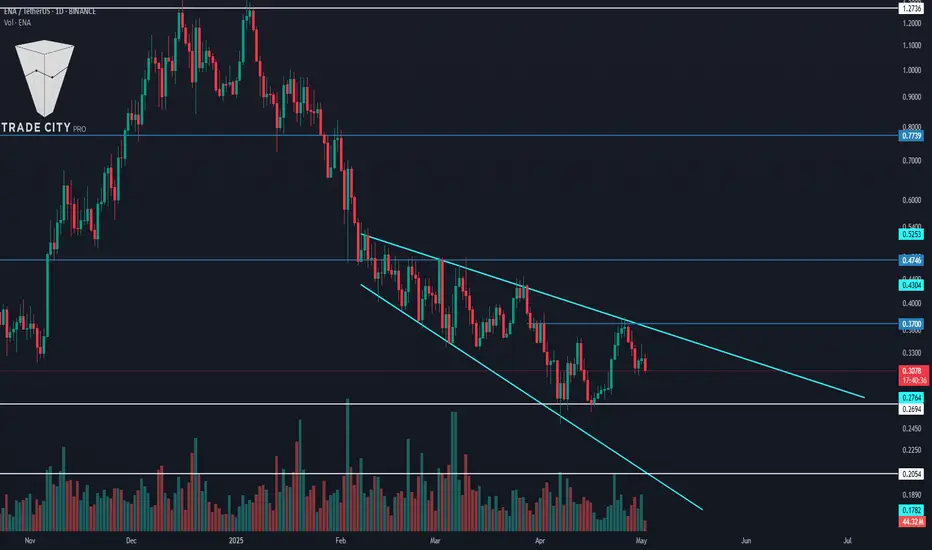
As you can see on the daily chart, there is an Expanding Triangle, and the price is fluctuating within this pattern.
📚 One key characteristic of an Expanding Triangle is that while the price is within the triangle, it tends not to respect static levels such as supports and resistances. Currently, the price is within the triangle and, as you can see, it doesn’t respond significantly to static zones.
📈 For this coin to become bullish, the triangle must break to the upside and the triangle trigger at 0.37 should be activated. In that case, the price can move upward and begin a bullish trend. Full confirmation of the bullish reversal will come with price stabilization above 0.4746.
✔️ For continued downward movement, the first trigger is the break of 0.2694. If you already hold this coin, you can use this level as a stop-loss — and once the price closes below it, you can trigger your stop-loss.
📊 For short positions, the break of 0.2694 is a valid trigger, but the issue is that it activates before the triangle breaks, and I personally prefer not to open a position within an Expanding Triangle — I’d rather wait and enter after it breaks.
🔽 Another trigger for a bearish move is the break of 0.2054. This is the main support for ENA, and if it breaks, the price will register a new All-Time Low.
📝 Final Thoughts
This analysis reflects our opinions and is not financial advice.
Share your thoughts in the comments, and don’t forget to share this analysis with your friends! ❤️
TradeCityPro | Bitcoin Daily Analysis #78👋 Welcome to TradeCity Pro!
Let’s get into the analysis of Bitcoin and key crypto indices. As usual, in this analysis I’ll review the triggers for the New York futures session.
⏳ 1-Hour Timeframe
As you can see in the 1-hour timeframe, Bitcoin is finally stabilizing above the 95,370 level. If this movement continues and the price stays above this level, the likelihood of a move up to 98,828 increases.
✔️ Over the past few days, I’ve strongly emphasized that you should open a position once 95,370 breaks. I hope you did, because that entry point was very significant, and breaking it could mark the beginning of Bitcoin’s next bullish leg.
💥 Currently, RSI is entering the Overbought zone, and if that happens, the chances of a sharp upward move increase. Buying volume is also rising, which is expected when a resistance level is broken.
📊 At the moment, opening new positions doesn't make much sense. If you already have an open position, I recommend riding the market momentum and taking profits whenever you notice momentum fading.
👑 BTC.D Analysis
Bitcoin dominance dropped slightly yesterday and returned below the 64.60 level. If this level is broken again, we can reconfirm the bullish sentiment.
🧩 If dominance gets rejected from the 64.60 ceiling, it’s likely to drop back down to the 64.22 support level.
📅 Total2 Analysis
Let’s look at Total2. Yesterday we saw a downward correction that extended to the 1.00 level. If you recall, I previously said I wouldn’t consider a trend reversal confirmed just from the 1.03 break — I’d wait for a break of the 1.00 support.
🔑 That’s why I didn’t close any of my positions at 1.03 and instead waited to see how the price would react at 1.00. As shown, the price reacted strongly at that level and quickly returned above 1.03.
✨ If the 1.05 level breaks, altcoins — just like Bitcoin — could begin a new bullish leg.
📅 USDT.D Analysis
Now let’s look at USDT dominance. Yesterday, it made a bullish move and broke above the 5.10 level, but the entire move turned out to be a fakeout, and the price dropped back below 5.10.
⭐ Currently, dominance is heading toward the 4.99 support. The main trigger for a bullish market shift is the break of this 4.99 level in Tether dominance. If this happens, altcoins will likely begin their bullish moves.
❌ Disclaimer ❌
Trading futures is highly risky and dangerous. If you're not an expert, these triggers may not be suitable for you. You should first learn risk and capital management. You can also use the educational content from this channel.
Finally, these triggers reflect my personal opinions on price action, and the market may move completely against this analysis. So, do your own research before opening any position.

TradeCityPro | FET: AI Token Eyes Breakout After Sharp Rebound👋 Welcome to TradeCity Pro!
In this analysis, I’m going to review the FET coin for you. This project is one of the top AI-related projects in the crypto category.
💫 With a market cap of $1.8 billion, it currently ranks 48th on CoinMarketCap.
📅 Weekly Timeframe
In the previous analysis, I mentioned that if the ascending trendline in this timeframe is broken, the price would make a higher high beyond 3.099, and with the activation of the trendline trigger, we could confirm a trend reversal in this timeframe.
✔️ As you can see, that scenario has played out. After breaking the trendline and the 0.382 Fibonacci level, the price dropped sharply down to the 0.786 level.
✨ The price reaction at this level was very quick, and after hitting this zone, it gained bullish momentum again with a bullish engulfing candle and has now reached the 0.797 area.
📈 If the 0.797 level breaks, the price could experience another sharp upward move. The next resistance levels are 1.095, 2.068, and 3.099 — with 1.095 overlapping with the 0.382 Fibonacci level.
📊 The main confirmation of trend reversal will be given by forming a higher high and higher low above the 0.797 level — confirming Dow Theory.
🔽 For a bearish continuation, the confirmation comes with a break of the 0.786 Fibonacci level. The main support levels are 0.185 and 0.058.
📅 Daily Timeframe
In the daily timeframe, we can better see the details of this bullish move. As observed, the price has had a sharp leg up from the 0.379 bottom to 0.791 without any real correction.
🧩 Given the strength of the 0.791 resistance, a correction is more likely here. If the price moves upward without correction, it’s usually not a good sign for trend sustainability. A healthy trend includes corrections.
🎲 However, if 0.791 breaks and RSI enters the Overbought zone, the price could continue rising toward the 1.128 resistance. While this might not be ideal for trend health, the risk-to-reward ratio makes opening a position worthwhile.
🛒 In my opinion, a correction followed by a new bullish wave would be a more ideal setup, increasing the chances of a breakout. Breaking this level could be a strong trigger for both spot buying and futures positions.
📉 For a bearish scenario, we need to wait for the price reaction to 0.791 and then enter after confirmation of trend reversal. Lower-level triggers would be the breaks of 0.567, 0.455, and 0.379.
📝 Final Thoughts
This analysis reflects our opinions and is not financial advice.
Share your thoughts in the comments, and don’t forget to share this analysis with your friends! ❤️

TradeCityPro | ENSUSDT Huge Breakout Coming? 👋 Welcome to TradeCityPro Channel!
Let’s dive in and analyze one of the DeFi coins, ENS, together. It’s been performing well recently and has some exciting news!
🌐 Bitcoin Overview
Before starting the analysis, I want to remind you that, as per your request, we’ve moved the Bitcoin analysis from the main section to a separate daily analysis. This allows us to discuss Bitcoin’s status in more detail and analyze its charts and dominance together.
This is the general analysis of Bitcoin dominance, which we promised to cover separately and analyze in longer timeframes.
📊 Weekly Timeframe
In the weekly timeframe, ENS is one of the bullish coins in the market with a promising outlook. It began its main upward movement before the start of 2025, back in late 2023.
After breaking the 9.99 level, we entered the main uptrend, and we can say that we broke the market cap ceiling, achieving a new ATH market cap.
We’re also riding a bullish curved line that acts as support. If this line is broken, it signals a weakening of the main uptrend. A drop below 15.90 would indicate a trend change in the MWC (Market Wide Correction).
Currently, our key weekly support has shifted. We were supported at 13.15, easily moving past this level. Our spot exit trigger is now 13.15, whereas last week it was 15.90.
📈 Daily Timeframe
In the daily timeframe, after a rejection from the ATH at 47.68, we entered a range box between 30.75 and 37.77. After some weak movements toward resistance, we saw a corrective wave.
Following a daily engulfing candle that covered the previous three candles, we experienced a sharp downward wave to 13.49. After that, seller pressure seemed to fade, and buyers stepped in. After a fake breakout at 13.49, we saw a move up to 18.41.
Additionally, the trendline formed during the recent declines in this chart was broken after the support at 13.49. However, since the trigger hasn’t been activated yet, we’re not acting on this trendline for now. But if 18.41 is broken, you could consider a risky spot buy.
✍️ Final Thoughts
Stay level-headed, trade with precision, and let’s capitalize on the market’s top opportunities!
This is our analysis, not financial advice always do your own research.
What do you think? Share your ideas below and pass this along to friends! ❤️

TradeCityPro | Bitcoin Daily Analysis #77👋 Welcome to TradeCity Pro!
Let’s dive into the analysis of Bitcoin and key crypto indexes. As usual, I’ll walk you through the triggers for the New York futures session.
⏳ 1-Hour Timeframe
As you can see in the 1-hour timeframe, Bitcoin is still ranging, and volume has decreased compared to yesterday. In times like these when market volume is low, you need to pay closer attention.
✔️ Today, I’ve drawn an ascending trendline on the chart. When price performs very shallow corrections after an uptrend and each low is higher than the previous one, it indicates a very strong bullish trend. So if this trend continues, it can lead to some very attractive trade setups.
💥 As mentioned, volume is quite low today, and volatility is also lower than before. This means that most market participants are waiting to see what will happen before reacting. We should take the same approach and wait for our triggers to be activated.
📈 For a long position, it’s pretty clear that Bitcoin has a very important resistance at the 95370 level, which is currently the only long trigger. If you don’t have a position from lower levels, this is a very logical and attractive entry, and I suggest having a position ready if this level breaks.
📊 For a bearish scenario, we haven’t yet received confirmation, and we need to wait until at least the trendline is broken. After that, with the activation of a trendline trigger like the 93626 level, we can enter a short position.
👀 As I’ve said in previous analyses, I personally won’t open a short position unless Bitcoin reaches the 91945 level, as that’s my first confirmation for a trend reversal.
👑 BTC.D Analysis
Let’s check Bitcoin Dominance. The dominance range box continues, and yesterday it again moved upward from the 64.22 support and reached the range top at 64.60.
☘️ If you had opened a position on altcoins like ETH after their triggers activated yesterday, you probably hit stop-loss because of this dominance move. As dominance moved up after those triggers, capital flowed out of altcoins, causing many of them to fake out and fall back below their resistance.
📅 Total2 Analysis
Now for Total2. Just like Bitcoin, Total2 is forming a range box, but it has significantly less bullish momentum. While Bitcoin has some upward slope during its range, Total2 is completely flat and oscillating between 1.03 and 1.05.
⚡️ Triggers for Total2 remain unchanged: breakout of 1.05 for bullish confirmation and 1.03 for bearish. But just like I mentioned that I won’t act on Bitcoin’s 93626 break and will wait for 91945, here I also won’t act on a 1.03 break—I’ll wait for confirmation below 1.00.
📅 USDT.D Analysis
Let’s move to Tether Dominance. A new lower high has formed just below 5.14, and for now, I’ve adjusted the resistance level to 5.10, because as you can see, the price is reacting well to this area and we can use it as a trigger.
🧩 For a bearish USDT.D scenario (which would mean bullish for the market), breaking below 4.99 remains the key trigger. For a bullish USDT.D scenario, breaking above 5.10 would be the first confirmation of a shift in dominance upward.
❌ Disclaimer ❌
Trading futures is highly risky and dangerous. If you're not an expert, these triggers may not be suitable for you. You should first learn risk and capital management. You can also use the educational content from this channel.
Finally, these triggers reflect my personal opinions on price action, and the market may move completely against this analysis. So, do your own research before opening any position.

TradeCityPro | QNT: Ranging Near Key Resistance in RWA Favorite👋 Welcome to TradeCity Pro!
In this analysis, I want to review the QNT coin for you. This project is one of the RWA projects that has been heavily hyped in recent months.
✔️ Currently, this coin has a market cap of $908 million and ranks 72 on CoinMarketCap.
⏳ 4-Hour Timeframe
On the 4-hour timeframe, as you can see, there is an upward trend along with a curved trendline that has caused the price to move from the bottom of 59.9 to 76.8.
💫 After the price reached the resistance at 76.8, a ranging box has formed, and volume has also been decreasing. A temporary support bottom has formed at the 73.8 area, and the price is ranging between these levels.
📊 Now, with the ranging box that has formed, the price has reached the curved trendline, and this trendline can potentially lead to bullish momentum entering the market.
💥 On the other hand, the RSI oscillator is also on important support at the 50 level, and if the price is supported by this trendline, the RSI moves upward again, and volume increases, we can enter a long position with the breakout of 76.8.
🔍 An important point about this entry is that there is a very strong resistance at the 80.1 area, and if you enter a position on the breakout of 76.8, you probably won't see much profit until the price reaches 80.1.
🎲 So basically, the 76.8 trigger is a preliminary trigger for the breakout of 80.1, and if I open a position on the breakout of 76.8, I won’t close it at 80.1 and will wait to see if the price breaks through the 80.1 area or not. In my opinion, this position is worth the risk because if 80.1 breaks, a very large reward could result from this position.
🔽 But if you want to take less risk, you can wait and open your position with the breakout of 80.1 itself. Naturally, since this area is a major resistance and the entry point is higher than 76.8, opening a position at that level will be harder and the likelihood of getting a proper confirmation candle is lower than with 76.8.
📉 For a short position, if we want to get a trigger from the chart itself, considering the decreasing volume and price reaching the curved trendline, if this trendline breaks and the 73.8 trigger is activated, we can enter a position. RSI confirmation would also be the break of the 50 area, and with that break, we could also get momentum confirmation.
🔑 But the point is that we must also consider market conditions. For example, in the current market conditions, the overall trend of Bitcoin and indexes like Total and Total2 has been bullish in recent weeks, and we can’t get bearish confirmation from these indexes.
✨ So it's possible that with the break of 73.8, the price moves downward, but because the indexes I mentioned also affect altcoins, with the continuation of their bullish trend, the downtrend of QNT may come to an end and its trigger may become a fakeout. That's why it’s better to wait for Bitcoin and the indexes to confirm a trend reversal before looking for short triggers.
📝 Final Thoughts
This analysis reflects our opinions and is not financial advice.
Share your thoughts in the comments, and don’t forget to share this analysis with your friends! ❤️

TradeCityPro | Bitcoin Daily Analysis #76👋 Welcome to TradeCity Pro!
Let’s dive into the Bitcoin analysis and key crypto indices. As usual, in this analysis I’ll review the futures triggers for the New York session.
⚡️ Not much has changed since yesterday, so without reviewing the previous analysis, let’s get into today’s setup to see what positions we can open.
⏳ 1-Hour Timeframe
As you can see on the 1-hour timeframe, the price is still within its range box. Even though yesterday it tested the lower range once and we expected a breakout to the upside, that didn’t happen, and the price was rejected from the 95370 resistance and continued to range.
✔️ After the rejection from this level, volume began to decline, which is a good sign. The lower the volume gets, the sharper the breakout move from the box is likely to be.
💥 If 95370 is broken, I definitely recommend having an open position, as the risk of hitting the stop loss is worth the potential gain. The target in case of a breakout will be the 98828 resistance.
⭐ The SMA99 is also providing good support and is currently sitting below the candles, which adds to the positive bias for this scenario.
🎲 If the price gets rejected from the resistance again, we’ll likely see more range-bound action today. But due to the strong bullish momentum, I don’t think the price will lose its support levels, and it’s likely to test 95370 again.
💫 That said, if I observe structural changes and see support levels like 91945 breaking, I’ll also be ready to take short positions.
🔽 However, for shorting, I think we should wait for more structure to form. Once the price shows more reaction to the 93626–95370 range box, and if 93626 breaks, we can enter a short. But right now, I’d personally wait for a break of 91945 before going short.
👑 BTC.D Analysis
Moving on to Bitcoin dominance, the range box is still intact, and price is above the 64.22 level. If Bitcoin breaks the 95370 resistance and BTC.D continues to rise without breaking below 64.22, then Bitcoin will outperform altcoins. If 64.41 is broken, we can expect a sharp bullish move in Bitcoin.
📊 To enter positions on altcoins, the best confirmation remains the break of the 64.22 level on BTC.D.
📅 Total2 Analysis
As for Total2, the 1.05 resistance still hasn’t been broken. To confirm the beginning of a bullish move in altcoins, we need a breakout of this level. The first target of this move would be the 1.07 resistance.
📉 To turn bearish, the first trigger is at 1.03. We’ll need to wait for the price to test it, so we can determine the precise level and react accordingly in future retests and breakouts.
📅 USDT.D Analysis
USDT.D behaves slightly differently from Bitcoin and Total2. While Bitcoin and Total2 are both near resistance and poised for a breakout, USDT.D is still some distance from the 4.99 support.
☘️ The probability of this support break coinciding exactly with Bitcoin and altcoin triggers is low. However, I believe this is a more significant trigger than Total2’s.
❌ Disclaimer ❌
Trading futures is highly risky and dangerous. If you're not an expert, these triggers may not be suitable for you. You should first learn risk and capital management. You can also use the educational content from this channel.
Finally, these triggers reflect my personal opinions on price action, and the market may move completely against this analysis. So, do your own research before opening any position.
