LIVE MARKET ANALYSIS & TRADE IDEAS: USDJPY, GBPUSD, GBPAUD & CJHello Traders,
Starting off early today with a big shout out to @TradingView for their continuous improvements to the platform and the valuable tools they provide to the trading community. Well done!
Here’s my analysis for today:
USDJPY H4
The USDJPY has formed a Momentum Low, signalling a potential trend reset. The underlying trend remains bullish on this timeframe.
Expectation: Increased buying activity is anticipated from the current price level.
GBPAUD H4
The GBPAUD is trading within a 915-pip range. Inside this range, price fluctuations create highs and lows. Applying the range trading principle—buy low, sell high—recent price action shows a bullish wave structure completed on the smaller timeframe following a rally from the Momentum Low.
Current Observation: A trend reset is occurring on the smaller timeframe, breaking below 1.9508.
Trading Approach: Look for a failure to make a Lower Low (LL) on the 5-minute chart and seek opportunities to trade to the upside.
GBPUSD H4
The GBPUSD remains in a downtrend on the H4 timeframe. However, a significant reset has occurred, forming Structure 4 at 1.2714.
Ideal Trade: The preferred strategy is to sell GBPUSD. However, based on wave structure analysis on the lower timeframe, the price is not yet primed for a bearish move.
CADJPY H4
The CADJPY exhibits similar behaviour to the USDJPY, with a recent dip below the previous Momentum Low. Yesterday, a bullish trend-changing pattern emerged.
Trading Opportunity: Look for buying setups above 107.46 based on the current price action.
Wishing you successful trades and a blessed weekend!
Tradeideas

THE STOCK GAUNTLET HAS BEGUN! GOOGLE 1/17⚔️🛡️ THE STOCK GAUNTLET HAS BEGUN! ⚔️🛡️
STOCK/TRADE UPDATE: 1/17
1⃣ NASDAQ:GOOG NASDAQ:GOOGL
Show some love: ❤️
LIKE | FOLLOW | SHARE | BOOKMARK IT
🔔 Hit the bell to be notified when each video drops!
NFA #tradingstrategy #HIGHFIVESETUP
NASDAQ:GOOG NASDAQ:GOOGL

DON'T SELL HIMS UNTIL YOU WATCH THIS FIRST!DON'T SELL YOUR NYSE:HIMS SHARES UNTIL YOU WATCH THIS FIRST🛑
In this video, we will discuss:
-Why you shouldn't sell on the NASDAQ:AMZN health news
-Amazons multiple failed business adventures
-How NYSE:HIMS is still ok even if Amazon is successful
-Fundamental and Technical analysis
You will want to buy not sell after you watch this video
NFA

Can S&P 500 stay above 6K?The SPX hit a new all-time high at the open, adding to its big gains from last week when Trump won the US election quite comfortably in the end. But the index it has since drifted lower, moving back below last week's high of 6013, potentially suggesting that the bullish momentum is fading after being up for several days. At the time of writing, it was approaching the 6,000 level from above, after it crossed it for the first time ever last week. Should it fail to hold above this level, and given the fact the RSI is at overbought levels on the daily time frame, we could see investors take profit on their long trades accumulated last week. A bearish-looking price candle such as an inverted hammer is the sort of price action the bears would look for now. If seen, we should then expect the S&P to ease back towards the breakout area of 5857 to 5882 in the coming days.
By Fawad Razaqzada, market analyst with FOREX.com

Trade Idea -- Starbucks Corporation (SBUX)SBUX is testing a significant resistance level, as illustrated by the horizontal consolidation pattern in the chart. A breakout above this level could suggest the start of an upward trend, especially if volume picks up. Watching the stock’s interaction with the moving averages and Bollinger Bands will be crucial in assessing the strength and sustainability of any potential breakout.

Nasdaq Monthly Analysis - Possible Measured Move CorrectionThere may be a lot of choppy price action at the top of this trading range until price definitively starts to trend down to facilitate the correction or break out to make new highs. The reason for speculation that Nasdaq may be due for a correction is based on the current impulsive wave's similarity to the previous impulsive wave in both price and time.
If the current impulsive wave has reached exhaustion it will be an approximate measured move of the previous impulsive wave with increase factors of:
1.022 increase in price range (10,365÷10,142)
1.046 increase in days to climax (637÷609)
If the upcoming correction is also a measured move of the previous correction, using the calculated increase factors, the correction should be projected to occur over approximately 340 days (325×1.046) and decline by approximately 6,483 Points (6,344×1.022).
This would bring price to 14,309 (20,792-6,483) around the date of June 16, 2025, which would also bring price back to the trend line.
The projected correction, based the listed calculations, may retrace 77 Points below the 61.8% level (14,386-14,309). It is also worth mentioning that the previous correction retraced 76 Points below the 61.8% level (10,503-10,427). This difference in retracement below 61.8% is a factor increase of 1.013 (77÷76).
On the monthly timeframe, technical indicators such as Stochastic and RSI show price as overbought.

Swing Trade Idea for Oct 13th, 2024 - Caesars Entertainment, IncCaesars Entertainment, Inc. (CZR) is approaching a key resistance level at $45 after a strong upward move. The price is currently in a mini consolidation phase just below this resistance, which, if broken, could trigger a new wave of bullish momentum. This setup indicates potential for a breakout, with increased volume likely confirming the strength of the move. The next upside targets lie in the $46-48 range, with the possibility of an extended rally if the resistance is cleared. Traders should keep a close watch on the price action near $45 and look for signs of a breakout, which could signal further gains in the coming sessions.

Trade Idea: Apple Inc. (AAPL)AAPL is approaching a key resistance level, as shown in the chart with a narrowing consolidation pattern. A breakout above the current range could signal a continuation of the upward trend. The stock is trading near the upper boundary of its range, and increasing momentum or volume could confirm the strength of the move. Monitoring the stock’s behavior around this resistance and the support levels will be crucial to determine if the breakout is sustainable or if the price will revert back into the consolidation zone.

Apple Inc. (AAPL) Trade IdeaAAPL is approaching a key resistance level, as shown in the chart with a narrowing symmetrical triangle pattern. A breakout above the current consolidation range could signal a continuation of the upward trend, especially with rising volume. Monitoring momentum and the stock’s behavior around the moving averages will be crucial for confirming any potential breakout.

Tesla, Inc. (TSLA) short term outlookNASDAQ:TSLA The price has recently moved above the previous resistance at $235 and is trending upwards within the Bollinger Bands. A breakout beyond the current range could push the stock toward the next resistance level near $265. With rising volume and price action maintaining strength above the moving averages, this upward momentum could continue. Monitoring volume and the stock's behavior around the $245 resistance will be crucial to confirming a breakout or potential retracement. ( NASDAQ:QQQ SP:SPX AMEX:SPY )

Apple Inc. (AAPL) short term outlookNASDAQ:AAPL is approaching a breakout point, as seen with the recent upward movement toward the $230 resistance level. The stock has been trading within a symmetrical triangle and has now broken above the key trendline after bouncing off support near $215. The price is climbing within the Bollinger Bands, and a further move above $230 could confirm a continuation towards the $240 area. Volume is also rising, indicating growing interest and momentum. ( NASDAQ:QQQ SP:SPX )

Super Micro Computer, Inc. (SMCI) trade ideaSMCI is in the process of bottoming out after a prolonged downtrend, as seen with a potential base formation. A breakout above its current consolidation zone could trigger a new upward leg, especially with improving volume patterns. Watching how the stock behaves around its moving averages will provide clues on the sustainability of this possible recovery.

Tesla, Inc. (TSLA) short term outlookNASDAQ:TSLA is approaching a key resistance level, with an ascending trendline supporting the price. A breakout above the current consolidation zone could lead to further upward movement, especially as the price hovers near the upper Bollinger Band. Keeping an eye on the volume and the stock's performance around the moving averages will be critical in determining the strength of any breakout.

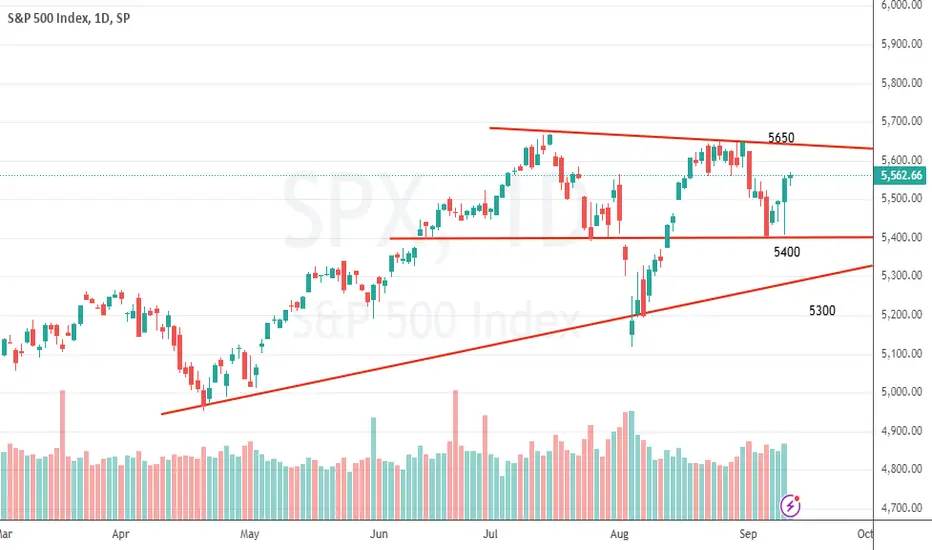
S&P 500 chart analysisThe S&P 500 is currently forming a symmetrical triangle pattern, signaling potential consolidation within this chart structure. The stock is likely to trade between the resistance level at 5650 and the support level at 5400 in the near term. If the index fails to hold above 5400, it may drop towards the next key support at 5300. A breakout above 5650 would suggest a bullish move, while a breakdown below 5300 could lead to further downside. Traders should monitor price action around these levels for confirmation of the next direction.
Apple Inc. (AAPL) chart analysisThe stock chart for Apple (AAPL) highlights the formation of an Ascending Triangle pattern. This is a bullish continuation pattern characterized by a rising support trendline and a horizontal resistance level, as depicted by the converging red lines.
In an ascending triangle, the rising support indicates that buyers are stepping in at progressively higher levels, while the horizontal resistance suggests that sellers are capping gains at a certain price level. This pattern generally suggests accumulation, where buying pressure builds up, and it often leads to a breakout above the resistance line if enough momentum gathers.
At the moment, AAPL is approaching the resistance line but has not yet broken out. If the stock price moves above the resistance level with strong volume, it could signal a bullish breakout, leading to a new leg higher. However, if the price reverses and breaks below the support line, it could signal a bearish move, making it essential to watch the coming price action closely.
Given the upward slope of the support line, the bias remains bullish, but traders should remain cautious until a clear breakout occurs.

NVIDIA Corporation (NVDA) chart analysisThe chart for NVIDIA (NVDA) displays a classic Head and Shoulders pattern, which often signals a trend reversal. This formation consists of three distinct peaks: the first being the left shoulder, the second and highest peak as the head, and the third, slightly lower peak, forming the right shoulder. The red line in the chart represents the neckline, a critical support level that has been tested several times.
Currently, the price sits just above this neckline, indicating the stock is at a crucial juncture. A breakdown below the neckline with increased volume could suggest a bearish reversal, which may lead to a significant downward movement. On the other hand, if the stock price bounces off this support, it could indicate the bulls are regaining control, leading to a potential continuation of the uptrend.
This pattern doesn't guarantee future movement but serves as a reliable indicator for many traders. In the short term, it will be important to monitor whether the stock breaks the neckline, signaling a trend shift, or if it holds and rebounds for further upward momentum.

Tata TechEnter NSE:TATATECH at CMP, with an SL of 1010.
It seems that this gem from the Tata Sons empire is on the verge of an up-move in the coming weeks.
Those willing to hold it for longer horizons may hold it till a close below 971.4, post which must take an exit.
The formation of a reversal pattern post a prolonged downtrend, along with presence of a valid trendline with upto 4 touchpoints, makes this a significant breakout.
This may also be a good time to allocate to this stock, from a longer term standpoint.
**********************************************************************************************************************
This is for illustrative purposes only. Do not construe this as investment advice

$CELH great R/RDespite the indicators showing a downtrend in the stock, I believe that the risk/reward ratio for NASDAQ:CELH is quite favourable.
Why? The risk is mostly mitigated; even if the company reports less-than-stellar results, this is already factored into the price.
However, if it does report even slightly better than anticipated results, we might witness a rally.
Take note of the bullish divergence between the price and the MACD-Histogram.
What are your thoughts? Do you anticipate further decline or a potential bounce from this point?"

GBP/USD breaks 3-year old bear trend lineThe GBP/USD has broken above its bearish trend line established since June 2021, indicating the potential for a significant upward move, possibly reaching the psychological level of 1.3000. But it could rise far beyond that level should this week's US CPI data disappoint expectations. If so, last July’s high of 1.3142, or even higher levels, should come into focus.
Meanwhile, short-term support is seen around 1.2815/20, corresponding to last week’s high when a large thrust candle was formed. Key support is now at the 1.2700 level, marking the breakout point.
The crucial level in this bullish technical GBP/USD forecast is last week’s low at 1.2615; a drop below this would likely invalidate the bullish breakout.
By Fawad Razaqzada, market analyst at FOREX.com

Silver consolidation continues ahead of potential breakoutSilver is currently in a bullish consolidation phase, which should not be mistaken for a sign of weakness. Despite the recent strengthening of the US dollar, silver’s long-term bullish trend remains intact.
Silver was testing support around $29.50 at the time of writing after a sharp drop on Friday. But this volatility is all inside a bullish continuation pattern. Key support lies around $28.70, and for as long as we hold above this level, the path of least resistance remains to the upside.
Given silver's struggles to maintain above $30, it may be wise to await confirmation on lower time frames before potentially trading the metal on the long side.
Key upcoming events include the French parliamentary elections on June 30, and significant US economic data releases, such as the May core PCE inflation on Friday, followed by the June non-farm jobs report and the month's CPI report in the following two weeks. These events could impact the dollar and, consequently, silver prices.
By Fawad Razaqzada, market analyst at FOREX.com

EURUSD Short- London Session - 1:6 RR Good Morning London,
The H4 is a currently in a bearish cycle, evidenced by the break of structure that took place last week.
Yesterday, we saw the market begin to give a bearish continuation to the downside but stalled towards the end of New York.
I'm anticipating a bearish continuation this morning based on the following:
30mins BMS with price currently within HVA
Price traded above the 15mins buyside zone EU open where I'm looking to be a seller
H1 and H4 is currently within a bearish cycle with a clear target at the LOR (1.08356)
Potential RR is a 1:6 adjusted to a static RR.

Trapped traders provides a great Short opportunity on DOW The plan for the session was to trade short off resistance on the DOW after an initial opening drive higher. The short side was the play and paid out nicely for patient sellers.
In the video I talk through the key Price Action for the move and prime trade areas on the DOW Index.
ANY QUESTIONS, JUST LEAVE IN THE COMMENTS !!
** If you like the content then take a look at the profile to get more ideas and learning material **
** Any Comments and likes are greatly appreciated **

What's Next for Bitcoin?Taking a look at the daily timeframe, price action continues to trend lower in the bearish channel. In the event we get another daily candle that closes below the last, I would expect to see further downward momentum towards 55,000, and then 52,000.
Stochastics is overbought and RSI is holding below 50. These are 2 additional technical confirmations that this pair is likely to trend lower.
This week we also have Core CPI data on Wednesday. If we get a strong report, we may see a crypto selloff as the dollar will likely strengthen.
