Tradeoftheday

GBPUSD London ShortsWhat I see and we could have one massive push down to setup a mid reversal today/tomorrow

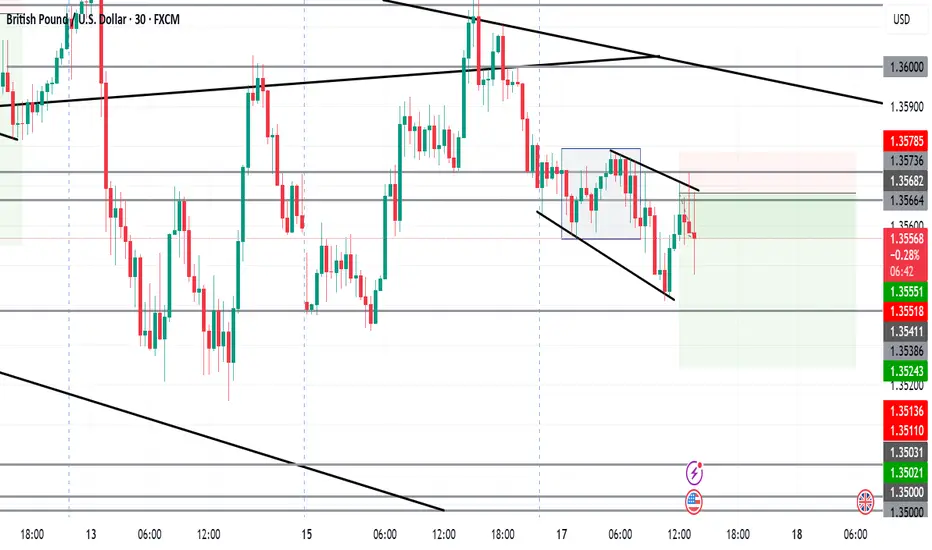
GBPUSD Pre-NY + News SetupPressure to the downside ... until mid-week reversal
Snacking with this one:
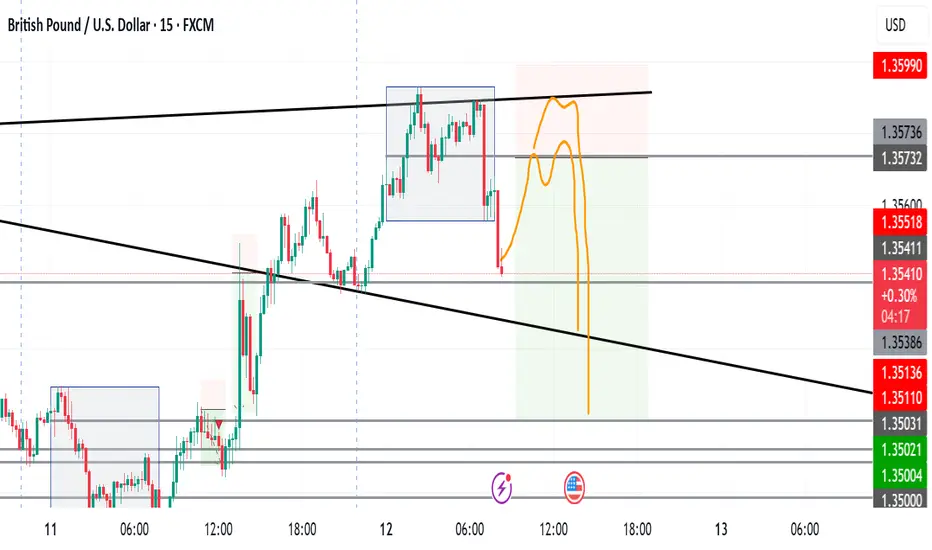
London Take 1 - GBPUSD - 12/6/2025SO this is what I see and anticipating ...more updates will follow.
PINK ZONE initially is ENTRY/KILL ZONE not entry and stoploss, screenshots after I am in the trade will update to atual short position with EP, SL & TP and my notes will elaborate.
News later at NY ...will be staying safe but looking to catch some pips
London Take 1 - 5/6/2025 - GBPUSDInitial comments ...updates will follow as usual.
London Setup for GBPUSD.

ABB India Ltd - Potential Breakout Targeting ₹9,130This analysis focuses on ABB India Ltd , where the stock is exhibiting a potential breakout from its recent consolidation phase, suggesting an upward move toward ₹9,130, which is 9.39% higher from the current level. The chart includes Fibonacci retracement levels, key trendlines, and technical indicators.
Key Highlights:
Current Price : ₹8,510.30
Fibonacci Retracement:
61.8% retracement level around ₹8,835 has been broken, which is a bullish sign.
Price is expected to reach the 100% retracement level at ₹9,130.75, indicating further upside potential.
Trendline Breakout
: The stock has broken out of a descending triangle, confirming a breakout, which is supported by increasing volume and momentum.
Technical Indicators:
RSI: Shows a gradual rise, indicating growing bullish momentum.
Moving Averages: The stock is well above its 50-day and 200-day moving averages, reinforcing the bullish trend.
Key Levels to Watch:
Resistance: ₹9,130.75 (100% Fibonacci retracement).
Support : ₹8,084 (50% Fibonacci retracement).
Conclusion:
With the breakout above the descending triangle and the stock holding above key Fibonacci levels, ABB India Ltd appears set for an upside move toward ₹9,130 . Traders should watch for sustained volume and monitor support levels in case of pullbacks.

COIN short to $150?!While we wait to see this larger triangle (in white) play out, I see an interesting potential short on Coinbase. It looks to me that despite an arguable crypto bull market, Coinbase might need to retrace and set some new bullish technical structure -- perhaps an inverse head and shoulders, or bull flag -- before moving up later this year.
Momentum indicators also suggest a bearish turn is on the horizon. I've marked my TP zone in cyan and plan to take some off the table almost immediately if we get an impulsive move down.
Important caveat: I recognize that we've been trading in a parallel channel (yellow) for about 150 days, which might imply a bounce. In the medium term, I also think NASDAQ:COIN is likely to break this white triangle bullishly, rallying with a broader move up in the crypto markets.

EURUSD TRADE IDEA 30/11/2023In this video, I the possibility for a continuation upwards on eurusd. I also talked about the things I will like to see the market do before I will be looking for entry positions for a long trade. I also talked about the possibility for the price to continue downwards since it's coming off a weekly 61.8 fib level. I talked about what I will expect the market to do before I conclude that the direction of the price has change from an uptrend to a downtrend. I'm sure you will enjoy this video so please give me a boost and also follow me.

EURUSD ANALSYSIS FOR 29/11/2023In this video, I talked about eurusd (the only pair I trade). I made a full break down from the weekly timeframe all the way down to the daily timeframe. I talked about what the market had done and what I expect the market to do over the next few hours. I also talked about the levels I'm going to be watching out for before I take a trade on the pair. I'm sure you're going to enjoy this video so do not forget to give me a boost, and follow.

EURUSD FORECAST 21/11/2023In this video, as I usually do, I did a full multi-timeframe analysis on eurusd. I talked about the levels of structures I was looking out for and how I expected the price to react to these levels. I also talked about what I'll do if the price behaves in certain ways.

EURUSD ANALYSIS UPDATE 21/NOV/2023Now, it's obvious that the ascending channel resistance I talked about on the 4h timeframe this morning seems to be holding. You can see how the price is rejecting the resistance and has closed lower than the 1.09500 level. Also, a counter trendline I drew has been broken to the downside which acts as added confluence for a possible continuation downwards. This means there's a very high chance that the price will retest that level as resistance and continue downwards.

EURUSD FORECAST 21/NOV/2023In this video, I did a full breakdown of eurusd, showing the important levels of structure in the market, and how I intend to trade today. I also talked about what I will expect to see before I take a trade and what I'll see that will make me not to take a trade.
If you like this kind of video, Please follow me and give me a boost.

EURUSD TRADING IDEA FOR 17/NOV/2023I'm sorry for sniffing loudly like that. I'm still recovering from catarrh, cough and other upper respiratory tract infection related sickness.
I made a full breakdown of this pair, analyzing what I expect to happen on this pair. If you liked the video, please follow me and give me a boost.

EURUSD ANAYLYSIS 16/11/2023I'm sorry I'm unable to make a video today. I'm currently down with ear pain, catarrh, cough and sore throat, and they're killing my voice.
For today, I'm not expecting much. The price appears to be rejecting the weekly 50% fib level I have been talking about. This means there's a possibility for a move downwards today too.
On the 4h timeframe, the price looks like it's respecting the ascending channel I added to the chart in yesterday's video. This is in alignment with the weekly fib level rejection. It also supports a move lower.
From the 1h timeframe, We can see that the price is already creating lower lows and lower highs which signifies a down trend. This simply means all the relevant timeframes are in alignment for a move downwards, so I'll be looking for shorting opportunities on this pair today. However, we already know that it's not wise to just take a trade from anywhere so the big question is what level will I be looking out for. I will be looking out for the 1.08500 level. That is the nearest psychological level to the price and it is currently trading below that level.
What I will be doing now is just to wait for the price to get to the 1.08500 level. When it gets there, I will expect to see the price show me an entry reason to this pair. If the price does that, I'll take a short trade. But if the price just breaks higher and keeps moving, then there's no trading opportunity. Always apply proper risk management when trading.

EURUSD Trade Idea for 15/NOV/2023In this video, I did a full breakdown from the weekly timeframe down to the 1h timeframe. I talked about what I'll be expecting from the market today and I also talked about why I might not trade today.
If you liked the video, please give me a boost and also follow me. Do have yourself a lovely day.

Pepe coming back down 0.0000014244Based upon the 15 min timeframe, looks like Pepe is coming down, back to 0.000014224, multiple layers of confluence, I entered my short at 0.00000170400, hope everyone had a blessed a weekend, lets get this money

Bitcoin Short projection, on the 15 minute time frameI expect bitcoin to start dropping from the 29,300 zone, this should allow bitcoin to fall back into the right ear of the pattern and allow the projection to continue as planned, measured move to the downside $ 27,335..stay tuned

EURCHF EURCHF - Trade set up
A break to either direction adding confluence to 4hr time frame 50 EMA support - 200 EMA 1hr next Support. Could be head and shoulders, too early to say as we do need break to further down side if it is and if not break above 1.00400 areas and re-test of recent highs would be your TP area.
Another day, another great trading opportunities.
Key tip: Follow your own trade plan
Trade Journal

Long EJEURJPY
LONG ON EJ As we can see strength coming in on EURO currency. Risk reward is 1:1 lets see how this plays out.

NIO Buy SetupNYSE:NIO Signal
Entry - $10
Target - $27
Invalidation - $2
Risk to reward ratio - 2.13
Technical confirmations
Gap between $9 and $11 where unfilled orders have to filled.
Price once rejected $10 level and then broke it. We think that $10 level could act as a potential support.
We have a 0.886 Fib retracement level at $9
Fundamental confirmations
Why should price reach Entry level?
Because of the lockdown in Shanghai businesses are getting logistics problems.
COVID-19 lockdown and China political situation with Russia influence foreign investors to sell their stocks.
NYSE:NIO is in the list of Chinese YTD share performance sectors that are vulnerable to COVID lockdowns
Why should price reach Target level?
Debt to equity ratio: <1 (Stable company)
Has a stable cashflow
According to Nasdaq, CNBC long-term price goal - $33

SLPUSDT Long ScenarioPrice was making a big moves recently and we can identify Elliot Wave pattern. It looks like price is about to finish wave 3 and should make a correction now towards demand zone. Also that zone combines with 0.5 FIb level so I think the price might bounce there. What do you think about SLP?

AUDUSD Short ScenarioThe price reached a supply zone and we can see that it bounced from that zone meaning that the selling pressure might start. I would recommend to search for selling opportunities on the lower timeframes. If you want to to sell now the risk to reward ratio is 4.3.

SLPUSDT Long ScenarioYesterday SLP broke out of descending channel also breaking the triangle. We have the first impulse upwards and it makes sense now to wait for a correction and enter the market before the second impulse. I would expect a bounce between 0.618 and 0.786 Fib zones. Also in that area market would retest the descending channel and triangle. Market made a liquidity zone forming equal highs so that would be my target. I would put invalidation level below the "e" of triangle.
What do you think about this one? :)
