AUDNZD - Bearish Breakout with 1:3 Setup on 4HrTaking a look at the 4h timeframe, we can see price action broke and held below the ascending trendline.
For me this indicates potential topping action. This pair is also heavily overbought on the daily timeframe so a correction at this point shouldn't be too much of a surprise.
Cooper prices also continue to get slammed which may contribute to some Aussie weakness.
Further more, we don't have any further major economic reports on the docket this week for either NZD or AUD which may cause this pair to correct. The Australian dollar does tend to have a correlation as a Risk-On currency with US equities. Today in the US session we saw both the Dow and SPX lose some of it's bullish momentum.
Trade Safe!
Tradeplan

XAUUSD - Pushing Through Resistance ConfluenceTaking a look at the 1 hour timeframe, price action is currently attempting to hold above the resistance confluence area. Should price action hold above at the end of this hourly candle, I would expect to see further upside towards my bullish target

GBPUSD - Waiting for price to climb back upOn the daily timeframe, price action printed a strong bearish engulfing pattern and now I'm just waiting for a sniper shot entry. This means prices need to climb back up to my desired entry area for me to consider short selling this pair.
I have alerts in place - now just need to be patient and wait.
Trade Safe

Trade Plan - Start Scaling in ShortsTaking a look at the daily timeframe, RSI is in the overbought territory as we approach a descending level of resistance.
For this reason, the trade strategy here is to "Scale In" on the sell and fade this pair as it climbs here. Whenever using atechnique like this, I prefer not to use a stop loss and scale with little volume.
If you like this trade setup/strategy, be sure to like, comment and share.
Trade Safe

EURGBP Trade Setup following ECB Interest Rate Decision.Taking a look at the daily tf, price action closed above the last candle where we saw strong rejection following a retest of the descending support.
Today the ECB also left interest rates unchanged at 4.25%.
Even though this is a low risk to reward setup, I believe it has a good chance of becoming a winning trade.

Simple Long Scalp 1:2.5 Risk to RewardJust a simple scalp with a tight stop loss. If stopped out, on the next trade I plan to double my lot sizes.
See entry, exit and target levels on screen.

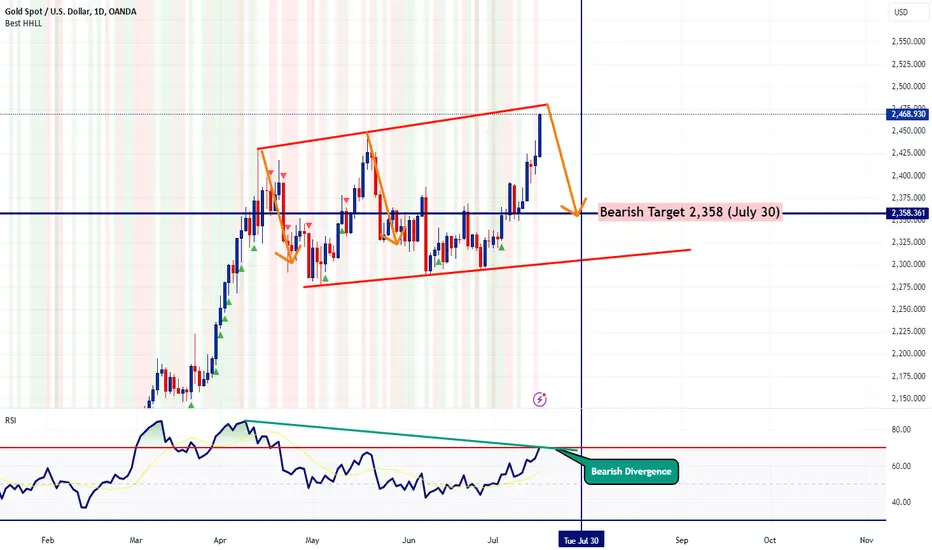
XAUUSD Approaching Ascending ResistanceTaking a look at the daily timeframe, price action is approaching the ascending resistance around 2380. I believe based on previous price movements, this trendline should hold as we head into the next FOMC meeting at the end of the month.
GBPNZD - Potential Perfect StormTaking a look at RSI on the 1 hour timeframe, it's obvious we are getting some bearish divergence after a strong week long rally.
This strong bullish price action was attributed to the RBNZ interest rate decesion last week where interest rates were left unchanges at 5.50%
However, later today we get the latest CPI data from New Zealand followed by UK's CPI data a few hours later. Could this be a potential perfect storm where New Zealand will show a surprise to the upside followed by a surprise to the downside with the UK?
If that happens, I would expect this ascending support trendline to break opening the doors for a reversal.
Time will tell but early clues are beginning to develop on the 1 hour timeframe with RSI.
That's it - That's all
Trade Safe.

XAUUSD - Top Down AnalysisStarting with the weekly timeframe price action is currently testing the 50% retracement level from last week's swing high. This is known a common pivot point.
Taking a look at the daily chart below, price action remains elevated above the 2350 psychological support level. RSI also holds strong above 50.
Lastly on the 4 hour timeframe, the technical backdrop is similar to the daily.
== Fundamental Overview ==
Markets are pricing in a 77% probability of a rate cut by the Fed in September, per the FedWatch Tool from the CME Group. We anticipate another cut by December.
The headline Nonfarm Payrolls (NFP) climbed by 206,000 in June, surpassing the market forecast for a 190,000 gain; but, April and May readings were dramatically lowered down by a combined 111,000. This resulted in a disappointing US labor market data on Friday, which confirmed a Fed rate decrease in September. As anticipated, average hourly earnings increased 3.9% annually, reaching a record low since the second quarter of 2021.
The US dollar and the yield on Treasury bonds could suffer as a result of Fed Chair Powell's remarks, which could support dovish Fed forecasts and push the price of gold to all-time highs beyond $2,400. Powell testifies before the Senate Banking Committee for two days, starting later on Tuesday and concluding on Wednesday before the House Financial Services Committee.
In addition, a number of other Fed policymakers are probably going to speak on Tuesday, which may influence gold price movement in the midst of a US schedule devoid of data.
Fears over China's gold demand and profit-taking caused the price of gold to fall on Monday. After gold failed at the $2,400 mark, traders turned to profit-taking, and some moved ahead of Powell's testimony and this week's US inflation data.
China possessed 72.80 million troy ounces of gold at the end of June, according to figures released by the People's Bank of China (PBOC) on Sunday. This amount remained constant from the end of May. The PBOC did not add gold to its reserves for the second consecutive month.

Cable Likely to CorrectTaking a look at simple price action on the 1 hour timeframe, we can clearly see the divergence with RSI. RSI also quickly snapped back below 70.
I now have a bearish target at 1.2765 for a 1:4 Risk to Reward
Trade Safe

BTCUSD - Now Trades Above Descending ResistanceBitcoin regained some of it's loses on Friday following the US jobs report which points to a slowly cooling economy. As of writing this report, BTC is now trading above the 1 hour descending level of resistance. The question I have now is will this pair pullback up to 60k?

BTCUSD - Trade PlaybookSecond BTCUSD trade about to reach it's target. I'm now waiting for more directional clues but I suspect that we might get a bounce off of the descending level of resistance so I'll be monitoring that.

1:3 Risk to Reward BTCUSDOn the 5, 15, 30 and 1 hour timeframe, BTCUSD is showing signs of bottoming action with price action. RSI is also confirming as we head into the NFP. Should NFP disappoint analysts forecasts, I believe Bitcoin will reverse to the upside.
My trade idea on screen is a 1:3 risk to reward setup.
That's it - That's all
Trade Safe

BTCUSD - Potential Bottoming Action In my previous video I mentioned I was waiting for a strong bullish candle on the 15 min timeframe. I was alerted about that candle, and my short is closed.
== Previous Video ==
Now, on the 15, 30 and 1 hour timeframe we are getting clues of bottoming action so I am interested in getting in on a long trade here. I'm also adding room to add an extra long position if we go a bit lower.
That's it - That's all
Trade Safe

BTCUSD - How to Maximize Your ShortToday I'm sharing with you guys a special indicator that I use which is not available to the general public but if you want access to it, just send me a DM.
Let me know if you like this indicator that I'm using. Feel free to leave comments below.

EURUSD Resisted at 1.08 HandleWaiting for a pullback from the 1.08 to consider going long. EURUSD spiked today following weaker than expected ADP from the US.
What I plotted on the chart is kinda of what I'm expecting to see with EURUSD in the next week or so. With that said, I'll only be looking for long setups until we reach my final target.
That's it - That's all
Trade Safe

Simple 1:2 Short Sell SetupTaking a look at the daily timeframe, this pair seems to be losing bullish momentum. Oscillators are also confirming.
With that said, I plotted out a 1:2 Risk to Reward Setup with Stop Loss above the most recent high back in last May.
That's it - That's all
Trade Safe

Trade Plan for BTCUSDThis trade plan consists of 2 possible entries
First entry begins now on the long side at 61,897
SL: 60,768
TP: 64,407
This is a 1:3 Risk to Reward Setup
Now if we end up getting stopped out, I'll look to enter again on the long side at the 60,000 support handle with a stop loss below the lowest point onscreen and the target remaining at 64,407.
Something to consider: If stopped out on first entry, double up on the second entry.
Important Notes: To mitigrate risk, best to place an alert at the 60,000 handle rather than placing a pending buy limit order. This will allow us to monitor momentum to ensure the 60,000 area will remain supported.

Bullish Breakout on Daily TimeframeThere's been a confirmed bullish breakout from the descending channel of resistance.
This breakout could spark renewed enthusiasm to push higher towards the 50% fibonacci level that I plotted out on the chart.
The reason I'm targetting the 50% level is because it will likely coincide with the 100 SMA once we reach that level causing a confluence of resistance.
Wel Trade - Trade Safe

BTCUSD Bullish BreakoutReasons I'm bullish include:
* Strong rejection candle on the weekly timeframe
* Bullish breakout from descending channel on daily timeframe
Will we see some follow through momentum?

Loonie Strengthens Following Canadian Jobs DataFollow up video from yesterday's Loonie forecast.
See previous below

XAUUSD - Top Down AnalysisAll timeframes show gold is holding above the 200 SMA which is a strong bullish indication.
Furthermore, correlating assets such as BTC, US30 and DXY also confirm that gold is likely to continue higher.
My bullish target is around the 2400 level. At that point, we need to wait and see what happens with our fundamentals.
Trade Safe

Learn Your EDGE - Trust Your EDGEYou can learn a methodology trust the methodology and be consistent.
This weekly planning session is based on the H4 Indices, the idea is to do another major basket analysis after Tuesday trading. This analysis examined the AUD/USD, GBP/USD, USDJPY & USDCAD.
H4 Indices Portfolio Selection
BULLISH: AUD, JPY, GBP, CAD, NZD
BEARISH: USD, EUR,
-------------------------
BUY PAIRS: AUDUSD, GBPUSD, NZDUSD
SELL PAIRS: EURAUD, USDCAD, USDJPY
