🔆 Trade Plan for GRT (The Graph) 🔆🔍 Analysis:
Support Found: GRT has potentially found support at $0.333, signaling a possible reversal.
Entry Consideration: Entry at $0.333 provides an opportunity to capitalize on the anticipated reversal, with a clear support level identified.
Take Profit: Targeting the next areas of resistance at $0.419 or $0.485 to capture potential gains as GRT moves higher.
Risk Management: Implementing a stop-loss at $0.3190 helps mitigate downside risk and protect the trade from adverse price movements.
💼 Trade Plan:
Entry Strategy: Enter the trade at $0.333, acknowledging the support level and potential for reversal.
Profit Taking: Consider taking profits at the next resistance areas of $0.419 or $0.485, adapting to market conditions and price action.
Risk Management: Utilize the stop-loss at $0.3190 to manage risk and safeguard against unexpected price fluctuations.
Tradeplan

How to Trade EURUSDThe daily chart shows bearish continuation following the pullback of the 61.8% level from early March.
On screen I have two bearish targets. The first one around the 1.0650 where we may find support from the descending trendline. My final bearish target is currently set at the 1.05 handle where we had support back in October of last year.
== How to trade this pair ==
1. Wait for bullish pullbacks to scale short positions with small lots relative to your equity and aim to hold with a trailing stop.
2. If you decide to go long with this pair, I would only seek small targets.

📉📈 PYTH Support and Potential Upside! 🚀💹
📊 Analysis:
Support Zone: PYTH is compressing down to $0.905, indicating a support zone.
Building Up: Signs of building up are observed in this support area.
Laddering In: Consider laddering into positions at this level.
Next Support: If $0.905 fails, next support likely at $0.80.
📈 Trade Plan:
Entry: Initiate a trade around $0.905.
Take Profit: Target set at $1.10 for potential upside.
Stop Loss: Place just below $0.78 to manage risk.
🌟 Note: Stay vigilant for any shifts in market dynamics and adjust strategies accordingly! 🌐🚀 #PYTH #Support #TradePlan 📊📈

Gaps and How Markets Move In Contraction and ExpansionThere are several ways to trade gaps but first, there should be a solid understanding of what Gaps are and how they show up. Markets aren't that hard to read if we have some simple ways to see them that adhere to the principles of movement.
All markets move in contraction and expansion. A Gap is the sudden supply/demand imbalance that comes out of the contraction and shows up as the expansion. These expansions can even be used to measure how far the next expansion will go.
Start with a simple bar chart and erase everything else off the chart. Look and simply see the dense areas of contraction (Range). Then see the expansion (Gap), followed by another contraction.
Look for same-size contractions and expansion and you will start to see how organized price flow can be. It's no different than swings in that minor contractions and expansions make up the major contractions and expansions.
Shane

EURUSD - Likely to ConsolidateTo start the week, this pair continues to consolidate above the 1.08 handle amid mixed market sentiment from last week.
On the 15 min timeframe I placed two areas of interest (aoi) with horizontal lines. Should price action reach either of those lines within the next 2 trading sessions, I'll take look to see if there's a low risk trade.
Continued talks of lowering interest rates this year could weigh on the US dollar. This Friday is a holiday, (Good Friday) however we do have the month's end PCE report which may cause this pair to continue it's sideways motion.

🔗 Chainlink (LINK): Consolidating at Support! 📊🔄📉 Current Situation:
LINK is consolidating at a support level.
Opportunity identified for a long trade.
📈 Trade Plan:
Entry: Ladder into a long spot trade in the $17.50 - $19.00 support area.
Take Profit: Target the next resistance areas at $21.00 - $23.00 or $26.00 - $28.00.
Stop Loss: Set just below $16.00 to manage potential downside risk.
🔄 Strategy:
Utilize laddering to enter positions strategically.
Monitor price action for confirmation of upward movement.
Manage risk by adhering to stop loss levels.
📊 Note: Keep an eye on LINK's price dynamics and adjust the trade plan accordingly based on market conditions! #LINK #TradePlan #SupportAndResistance 📈🔗

A Bad Trade Plan Is Better Than No Trade PlanTraders often talk about the need to be patient but to be patient, we must know what we are being patient for. That is why we have a trade plan and know ahead of time exactly where to enter, where to place a stop, where to exit, and how much size to put on.
In this post I continue with our trade planning exercise of 30 planned trades by making a trade plan for LEN. Keep in mind that the exercise is all about learning consistency and discipline and not about the method or whether the trade wins or loses.
In the video, I speak of not being worried about losing all 30 trades in a row. It's not that I have steel nerves, it's that i have planned ahead of time for 30 losses with my position size.
Shane

Defining Target for Risk Reward: Maybe you shouldn't?The trade plan is broken up into parts. We have an objective and consistent entry, stop, and exit plan. Here I will be talking about the exit plan and setting targets that will give you a particular risk/reward ratio. There are no absolutes when it comes to what risk/reward you should be aiming for, a lot has to do with how you handle risk and loss and your overall understanding of markets.
Defining the stop (risk) is relatively easy compared to defining the target (reward). Mostly you need a clean set of statistics on an objective method. This will give you an average distance that the swing will run in relation to your method. The reward part of the equation is a function of how far your stop is to your entry.
There is no one-size-fits-all when it comes to trading. For many, it may be best not to set a target, but instead use something simple and objective like a moving average to exit the trade. This way, you get what the market gives you while incorporating consistency and objectivity into your exit plan. Keep it simple, objective, and consistent, and learn as you go. In the video, I make something up on the spot that may give you some ideas. I use a 20ema as a profit stop only after price has made a new high. It's simple, principle-based, and it's objective.
No matter what your method, knowing where you are in the swing cycle will help in defining entry, stop, and target, and this will directly influence the risk/reward ratio.
Shane

🚀 SEI Price Discovery and Upside Potential! 📈💹📊 Analysis:
Price Discovery: SEI is in "price discovery" mode, testing the $0.77 - $0.83 support area.
Laddering In: Planning to add to the position in this support area.
Upside Potential: Anticipating further upside over the next few weeks.
📈 Trade Plan:
Ladder In: Between $0.77 - $0.83.
Targets: Aiming for targets at $0.96 - $1.00.
Stop Loss: Set just below the white support line, slightly below $0.70.
🌐 Note: Keep a close eye on market dynamics and adjust strategies accordingly! 🚀📊 #SEI #PriceDiscovery #TradePlan 📉📈

Ascending Triangle Points to Bullish ContinuationIntro
BINANCE:BTCUSDT gearing up for a significant move today, and I'm here to break down the potential price action. Over the weekend, BTC moved interestingly, closing the CME gap and aligning with the CME's close price as we stepped into Monday. With this setup, we're eyeing an imminent breakout.
Weekend Wrap-up and the CME Gap:
The weekend saw Bitcoin hovering below the CME gap, but as predicted, it pulled back to around the $52,160 mark by Monday. This retest sets us up for the next leg.
Ascending Triangle Formation:
On the charts, Bitcoin is carving out an ascending triangle, a classic continuation pattern hinting at a bullish outcome. Given the trend's bullish nature, I'm eyeing an upward move, with immediate targets set around $54,000. Should a bearish scenario unfold, which seems less likely now, support at $50,000 will be crucial.
ETF Flows and Market Reaction:
The Bitcoin ETF market dynamics play a pivotal role. Although ETF flow data is typically available the next day, I'll be the first to update on Twitter. These inflows can trigger the breakout, so stay tuned.
Liquidation Heatmap Update:
A staggering $1.2 billion in Bitcoin short positions has accumulated above the current price level. A break above $53,000 could trigger a massive squeeze, potentially propelling BTC towards and beyond $54,000.
Funding Rates and Market Sentiment:
High funding rates indicate a market leaning towards long positions, a sign of bullish sentiment. Though it also suggests caution as markets could be getting overextended. But in bull markets, this is common.
Technical Milestones:
Bitcoin's weekly close has confirmed above the critical 0.618 Fibonacci level, a bullish signal historically leading to robust bull markets. The next resistance to watch is between $57.5k to $58,000, my target for the next potential pullback.
Ethereum's Outlook and the Upcoming ETF:
COINBASE:ETHUSD is also worth your attention as its Spot ETF looms, set to debut in about 95 days. With a lower market cap than Bitcoin, inflows could have a more pronounced impact, making ETH a compelling trade in the coming months.
Remember, whether you're trading on the spot or futures, stay updated, and don't overextend your positions. Bitcoin is showing all the signs of a bull run, but as always, the markets can surprise us.

Context and Learning To Change With ChangeOne of the hardest things for traders, or anyone for that matter, is to adapt to change. Mostly we get stuck when things change, which makes trading difficult since the very nature of markets is change. This is where the cliché 'going with the flow' originates, but simply understanding the cliché isn't enough; we must internalize and practice it and get it in our bones.
In this post, I will outline a trade plan for RNG. This is a part of our '30 Planned Trades' series, where we plan every aspect of the trade ahead of time and then execute what we have planned.
One aspect of a trade plan is the method or setup. Setups don’t happen in a vacuum, there is a context that determines the meaning of the content. I’m going to approach context very simply here as the thing that decides if the market is going up or down.
I often read things about how I should follow the trend or go with the flow or don’t fight the market, but exactly what trend or flow should I follow? It’s too abstract, so I’m going to fix a cycle to follow and learn to let go and change when it changes.
In the video, I show the basics of a simple practice you can try, using a rolling 100-bar cycle to determine if we are looking for long setups, short setups, or in a transitional or neutral phase. I not only want to be precise and consistent in my Trade Plans, I want to be consistent in my methods.
By adhering to a fixed cycle and adapting with changes, I avoid the need to guess or predict market directions, maintaining balance in my approach. Think about this: If you charge your mind with the impossible task of predicting a market when markets are unpredictable, you will end up a nervous wreck and then wonder why your trading is so emotional.
I encourage you to try this practice. Since it keeps you from constantly looking to the left of the chart or at higher time frames for more information, it will likely push you out of your comfort zone into the unknown, which is a good start.
Shane

Nothing Works, Either The Trader Works or Doesn't WorkThis post is a trade plan of IOT. Making a consistent trade plan helps to structure ourselves as traders. This give us some control in the ever-changing uncontrollable environment of markets. At first, it may seem tedious to do all this work, but that is only because our mind resists any kind of structure. The title of this post is saying to quit chasing after the perfect method and spend some time setting our own foundations.
Implementing a focused consistent method is like a framework that you can learn from and even design new methods from within that framework. The key is the focus and consistently in what we do.
In the video, I also talk about the components and process of a swing and how I use them to design my methods. Don't think in terms of technical analysis, think about it in terms of structuring simple buyers and sellers to see who is in control at any given time.
The end of the video gets cut off a bit because i tend to babble too much and run out of time but there will be more as I go through the 30 trades exercise.
Shane

Market Structure: Seeing In SwingsMarket Structure is simply making distinctions in price flow. its putting structure around what looks like chaos so that we have a way to measure and orient ourselves to any market in any timeframe. When I look at a market, I want to see objectively in swings.
Swings are the common thread that weaves through all markets and timeframes, providing a clear indication of who is in control at any given moment. They consist of distinct components and follow a process, forming the foundation of my trading strategies and setups.
Market Structure Definitions:
Confirmed Swing High/Low: A new high confirms a
swing low and a new low confirms a swing high.
Relative:
Major Swing: The largest reaction leg in your frame.
Minor Swing: the next largest reaction leg.
Balanced/Relative Swing: Same size reaction legs.
Expanded Swing: Reaction leg larger than previous reaction leg.
Components of a Swing:
Impulse Leg: The leg that takes out a previous high or low.
Reaction Leg: The retracement or pullback after the impulse leg.
Impulse Leg Shelf: a small range at the end of an impulse leg
Reaction Leg Shelf: A small range at the bottom of a reaction leg

NZDCAD - Hoping for CAD WeaknessSo I actually expect to see CAD strength following the Bank of Canada Interest Rate Decision on Wednesday, however it would be nice to see some weakness heading into the week.
For that reason, I'm not looking to go short just yet, but on my chart I have a small up arrow then down arrow. That's what I'm hoping will happen. If not and I miss the trade... oh well...
That's it - That's all
Trade Safe!

USDCAD Trade Idea with BOC This WednesdayI don't usually trade any central bank meeting but my technicals in this case are really suggesting some further downside pressure with this pair.
Technical Indications Include:
Evening Star Formation with the last 4 candles on daily
RSI Below 50
Fundamentals Include:
Inflation cooling off
Oil showing signs of a bottom
Equity market may spark additional risk-on sentiment which supports commodity currencies.

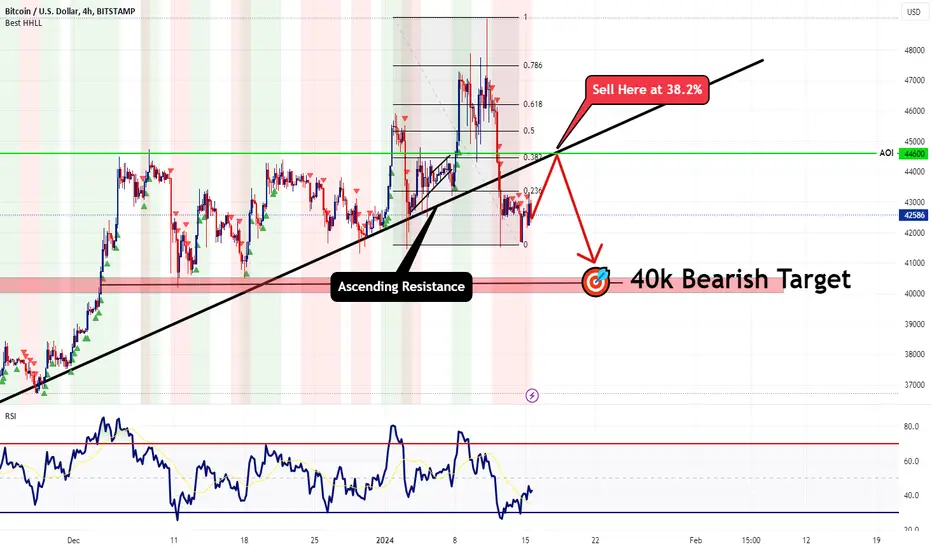
BTCUSD - Daily + Weekly ViewFirst thing I notice when looking at the daily chart, is the divergence with RSI and price action. Then I can also see we had a breakout below the ascending support.
Now when I take a look at the weekly chart, this is what I see.
The weekly timeframe definitely shows that the bullish momentum has stalled out. Indications of that include; RSI held below 70 along with a relatively strong bearish rejection candle.
This leaves me to now believe there is a chance of a correction perhaps down towards the 37k handle as pointed out on the chart.
For all of the above mentioned reasons, it doesn't make sense for me to hold my long positions and I'm looking for shorting opportunities.
That's it - That's all
Trade Safe

AUDUSD 5:1 R2R Trade IdeaWith everything going on, I'm looking to enter at 0.6585 with a stop loss just below the last 4hr candle's low. I do have a target set at 0.6678 giving this trade idea a 5:1 risk-2-reward.
Reasons why I like this trade include:
1. Economic Calendar forecasts this week are for negative US data
2. Technically on the 4hr, RSI closed above 50 following a hammer + bullish engulfing.
3. Last week equity market closed for the week at all time highs once again. I believe we may see some further bullish strength this week in equities which could add some strength to the risk-on currency pairs such as the AUD, CAD, & NZD .

Don't Miss This US30 ShortClear topping action is beginning to develop with RSI confirming as bearish momentum is strengthening.
With that said, I'm expecting a stock market correction after such a solid year of performance. Unless US30 makes additional fresh highs, I'm shorting as I expect to see profit taking happening in the days ahead.
That's it - That's all
Trade Safe

Waiting for a retest of ascending resistanceShould price action present itself with a retest of the ascending resistance I'll look for an entry to sell short.
Additionally I'm looking for a least a bullish pullback of at least 38.2 to consider my entry. You can note my fib levels on the screen.
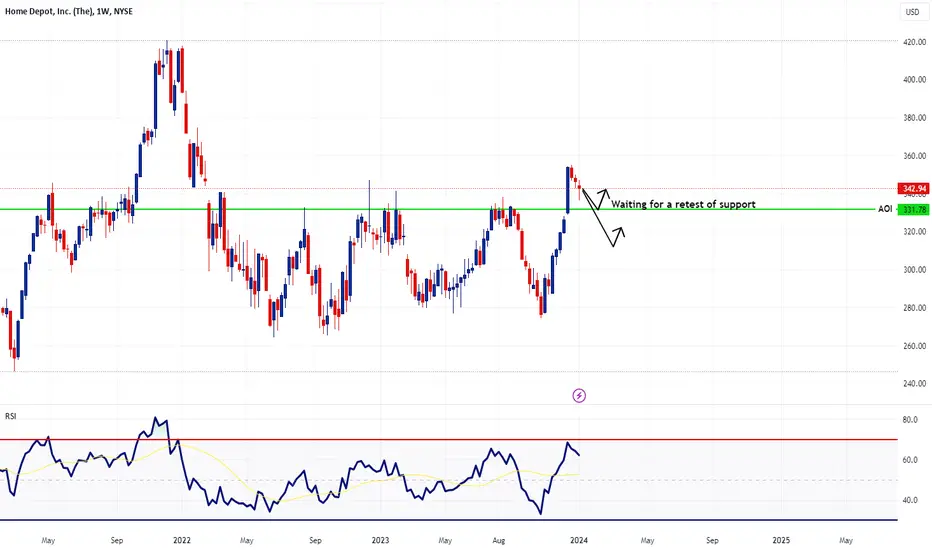
HD - Waiting for Retest of SupportWeekly timeframe shows that this stock is likely to pullback to my level of support highlighted on the chart.
I need that level to be tested before deciding on what to do with this stock. If we reach that level, I'll assess market conditions and momentum to determine if it's a low risk entry. There might be a chance of further declines as shown with my second arrow.
Weekly Chart Signal Trade idea- Multi-time frame AUDUSD Jan 04th 2024
1. The weekly swing is bearish on the weekly time frame. (See green 1 for strong market structure)
A. I expect price to move through my risk management strategy to move from 1 to the 2 on the weekly timeframe
2. Price is currently in the equilibrium between the weekly high strong (see green 3 & 4 for reference)
Price is more likely to move from strong market structure to weaker structure. This is how I based my phases of the market.
3. Price is currently in C.4 supply zone and is trending bullish for the Change of Trend (CHoCH)
4. Trade Ideas (Investor trade plan)
A. I could short trade with a risk entry at the short trade at Black 5
B. I Could also go to a lower time frame and wait for a confirmation entry for a higher probability trade

Multi-time frame 15m Trade Entry Management I am waiting for a conformation entry on the 15m Chart from my 4h chart multi time frame analysis. Its a b plus set up if I wait for more confluences

Multi-time Frame Analysis of GBPUSD Jan 4th 2023 - Daily Chart Analysis
1. The Daily swing range is from 1 & 2
(See Blue 1 & 2 for reference)
My prediction will move from 1 than to 2 but that is in a long term horizon
2. Current price action is between the D-Ibos high weak & the 4h-Swing High Weak.
3. Price has mitigated the equilibrium of the daily swing range
4. The trades off the supply and demand zones are lower probability tend to be lower probability
5. Price entered the daily phase B (see blue 3 for reference) and had a reaction causing a push down back to the EQ of the daily low strong (See 4 for reference)
6. Price is currently in the daily C.4 demand zone.
A. Price is bearish on the daily and 4h in between the daily high weak and daily low strong. If price switches to bullish by breaking the daily internal break of structure than I will look for longs off demand zone generated from the break.
B. If price breaks the daily low strong (blue 4 for reference) than I will switch to bearish set-ups (A.1)
