XAUUSD - Potential Bearish BreakoutTaking a look at the 1 hour timeframe, price action with Gold beginning to look quite bearish. Seems like all major assets are selling off today and all the value is getting pushed back into the greenback.
Tradeplan

Bullish Breakout - 2:1 R2ROn the 1hour timeframe we have a bullish breakout.
The USD is the strongest and the CHF is the weakest as the NA session begins.

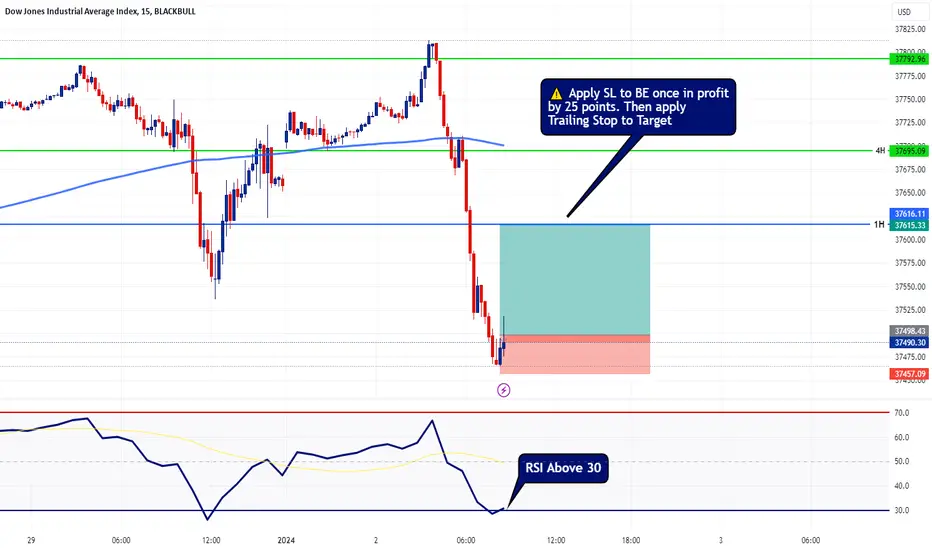
US30 Simple 3:1 ScalpRSI on the 15 min timeframe is now back above 30 suggesting we may see a short-term bottom. With that said, I mapped out a 3.62:1 R2R setup.
Important note when taking my trading recommendations is to always move SL to breakeven once in profit by 25 points with the US30 and then apply a trailing SL to the target.
This helps manage to manage risk in the event price-action doesn't reach the desired target.
Feel free to send me a DM if you need assistance.
== COMMENT == LIKE == SHARE ==
BTCUSD - H&S 15min Simple double confirmation sell setup.
Confirmations Include
1: H&S formation on 15min
2. RSI dropping below 70 on 1hour

AU200 3:1 R2R Sell SetupFirst thing to note is that we have a bearish breakout below the ascending trendline on the 1hour timeframe. Additional RSI is suggesting selling pressure with the bearish divergence.
== Game Plan ==
Wait for a pullback as outlined on the chart to enter a sell targeting a 3:1 risk to reward.

ETCUSD - 1:1 R2R But Likely to Turn ProfitThis is just a 1:1 R2R setup, however I believe this setup has greater likelihood of turning profit before getting stopped out.

DASHUSD - Waiting for AOIJust waiting for price action to arrive at my aoi level to reassess for a potential short sell position.

BTCUSD - 1:1 - But Odds are in FavorThis is a 1:1 sell setup but this trade is more likely to win. I'm using 2 bearish confirmations to decide on this sell trade.
1.) Break below the ascending support
2.) Bearish Strength with RSI

AUDCHF - Trade PlanTaking into account today's strength with the Swiss Franc, I'm expecting further bearish continuation with this pair. But before going short, I would like to see a pullback roughly to the 50% retracement area of today's bearish candle.
Should price action pullback to my area of interest (AOI) I'll go short with stops above yesterday's high with targets down towards the 0.57 handle.

GBPAUD - 3:1 R2R Trade Plan Today's daily candle closed slightly above yesterday's high while maintaining RSI divergence. With that said, I do believe we may see a bounce from these lows.
Trade Idea: Stops below yesterday's low with targets around the 50-61.8% retracement area of this most recent bearish leg.

EURUSD - RSI Divergence with Bullish BreakoutDaily timeframe, PA broke above 2 levels of resistance last week and now looks to stall out with RSI providing information on lack of bullish momentum.
For now, I'm waiting to see my small green line on the chart get tested where I have an alert. Will PA break back below support which was previous resistance and will we test the 50% pullback area (small green line) to then add to the bullish continuation?
Time will tell, for now I just need PA to test the small green line for my next assessment on what to do or how to trade this.
That's it - That's all
Trade Safe

BTCUSD Likely to Trend Higher in 2024All green lines on the chart are equal in length. I'm using the last green line as a projection tool which estimates BTCUSD above 50k around the first week in January.
Should BTC pullback to 42k, that in my view would be an excellent area to enter with stops around 39k.
== Simply in Summary ==
Long at 42k with TP at 50k and SL at 39k would be a simple 3:1 R2R setup.
That's it - That's all
Merry Christmas and Happy New Year!

EURGBP - Long AoL (Areas of Interest)Considering the fact that this pair is trading above the 200 SMA on both the daily and 4 hour timeframes, I'm looking for buy entry areas in this ascending channel formation.
On the chart I pointed out several areas which basically are along the ascending trendlines. If at any point I receive an alert of price action tagging one of these trendlines, I'll look for a potential long entry.
Now of course I can't expect to always be right and hopefully this isn't one of those setups where I'm wrong, so for that reason if PA decides to break and hold below the lowest ascending TL, I'll exit and book my loss.
That's it - That's all
Merry Christmas!

EURCAD - Revised Trade PlanEURCAD continues to trade within a wedge formation.
I'm waiting for either wedge support or resistance to break. I have my alerts set for when this will happen. Upon receiving one of the alerts, I'll then look for an entry point.
I'm not one to jump in on trade the moment we get a breakout. I've learnt my lessons the hard way many times in the past with that approach. So rather than entering on the breakout, I'll get my alert notification and then will look for a pullback roughly around a 50% retracement of the bullish and bearish impulse. I tried to illustrate this idea on the chart.
Now obviously I'm not expecting price-action to move exactly as illustrated but what I chalked up is a rough idea of what I'm expecting to happen.
Hope this all makes sense and is easy to understand.
That's it - That's all
Trade Safe

EURAUD - Trade PlanFAIL TO PLAN - PLAN TO FAIL
So this trade plan is fairly simple.
Rules to Follow
1. First and foremost, we need a break and hold above the descending trendline
2. Second, if or once we get the bullish breakout, we need price-action to pull back approx 50% of the bullish breakout impulse. This setup doesn't need a full pullback to support, which is currently triangle descending resistance.
3. Enter a small enough lot size to allow an additional equal or slightly larger lot to be executed again on the long side if price-action happens to go against the trade by 100 pips.
On the chart, I left a comment in yellow showing where I plan to add a second long entry.
If all out fails and price action breaks above the descending trendline and then decides to close back below this trendline that I'm referring to, I'll exit the trade and book a loss.
That's it - That's all
Trade Safe!

EURCAD - Waiting for Wedge BreakoutTaking a look at the 4h chart, price-action remains confined in a wedge formation. RSI is suggesting we might get a bullish breakout as this is now the third signal of a break above 50 in this current wedge.
The 50% Fib Retracement level is also something important to note as the most recent large impulse was an impulse to the upside. See chart below.
I do believe that we might push higher but of course, something significant needs to happen first for price-action to break out of this wedge.

GBPAUD - Good Chance We'll See Support HereTaking a look at the daily timeframe, price-action is currently supported by the Natural Consistency Flow. At the same time we also have divergence with RSI hinting at a potential short-term bottom.
Personally I need to see price-action now make a daily higher high (closing above the last candle). Once we get that third confirmation, I would be inclined to going long with this pair.
That's it - That's all
Trade Safe!

EURCHF - At All Time Lows!EURCHF is back down to all time lows. I'm not just waiting for a bullish breakout to the upside to go long with this pair.

USDCAD - Bullish Divergence Heading into PCETaking a look at the 1 hour timeframe, we have some clear bullish divergence with RSI and price-action. Whenever we get a setup like this, price-action does tend to bottom out and is likely to push higher.
The question now is "Will PCE come in better than expected?" As of right now, the economic calendar forecasts for weaker than previous figures. This may leave room for a surprise to the upside and thus in fact bottom out USDCAD at least on the 1 hour timeframe.

XAUUSD - Waiting for 4hr Wedge to BreakTaking a look at the 4 hour chart above, we can see price action is trading within a wedge. I'm now just waiting for a breakout whether it's above or below. My intuition tells me, a breakdown to the downside is more likely with the bearish divergence clue were getting with RSI.
Should we get a bearish breakout, I'll wait for a retest of the wedge support which will turn resistance to then target the 200 SMA which might line up with the 61.8% Fib pullback level.

S&P500 Sells Off Hard Heading Into the CloseNot sure the culprit for this sell off but needless to say, whatever it was might spark further selling pressure in the sessions ahead.
Look out for some minor topping action. Might be able to find some decent short sells around these all time highs.
Trade Safe!

NZDUSD - Potential Short Setup4hr chart is very similar to the USDCAD setup that I just posted. Basically waiting for this 4hr candle to close out, then will look for a pullback to the upside with pending sell limit orders in place to enter on the sell side and target the level I mentioned on the chart.
That's it - That's all
Trade Safe!

USDCAD - Potential Long 4HrTaking a look at the 4hr chart, we have several technical indications that we may begin to see some short-term bottoming action.
1. RSI showing strong bullish divergence.
2. Strong Bullish Engulfing Candle.
With that said, I think if we get a dip within the next several candles, that may present itself with a decent low risk long entry to the upside.
That's it - That's all
Trade Safe
