EURNZD - Super Simple LongVery likely this pair will bottom and pullback to the 200 SMA
That's it! Keep it simple.
Trade Safe
Tradeplan

USDMXN - Daily Outlook - Strategy DevelopmentJust a simple trade idea to diversify with a small long lot amongst other pairs.
Worst case... it drops to the ascending support and then just add another small long lot. Best to trade this idea with other pairs and close out all positions as a basket.
Trade Safe

GBPJPY - Weekly OutlookFor those trading Yen crosses, I'm sure you all witness the extreme selloff across the board with yen pairs.
Taking a look at GBPJPY on the weekly timeframe, price action is still holding onto a strong weekly bearish candle formation. There is possibility of a bullish retracement but I think it's best to wait and see how this weekly candle closes out. If we don't get much of a bullish pullback, I would suspect further pressure back down towards the ascending trendline. If that trendline breaks, look out for further downside as illustrated on the chart.
Trade Safe!

BTCUSD - Weekly OutlookTaking a look at the weekly chart, price action is tagging the ascending resistance while RSI is well overbought. My intuition tells me we may see a bit of a pullback here before we break the ascending trendline and reach the next critical level of resistance

Supply and Demand Daily Trade PlanRSI momentum has broken above 60, BULLS are in control for now. Looking for a pull back into Demand (Green) and exit trade at Weak Supply zone (First Red)
Trade is looking to be a 1:4 Risk to Reward.

GBPJPY - Trade PlanTaking a look a 4 hour chart, price action closed strong to the downside on Friday.
I'm not waiting for a bit of a bullish pullback to enter in on some short sells to the downside.
Keep it simple.
I placed a black line at each level I will be adding sells with my final target down at 180.
That's it - That's all
Trade Safe!

ES and SPX Trade Plan 10.13.23The primary level yesterday plan was 4430-4450 zone which was expected to be resistance for longer time frames as well as for the intraday session.
We could barely do any trading above this level and we traded down into 4400 even before the cash session opened for business. 4400-4410 has even an important level for past few sessions and I expected some support to come in here which was indeed the case as we saw about a 20 dollar rally from this level.
Eventually this level broke down, support became resistance and we traded down into 4350 in afternoon.
Scenarios for tomorrow
While I liked the action at 4430 as a longer term bear, I did not like the bounce from 4350.
For tomorrow’s session, both 4380 and 4350 could be important levels.....
Trade safe and Stay Frosty!
For more info on today Plan link below .

Today's TSLA levels, zones, and tradeplan chart.Enjoy, as always watch NASDAQ:QQQ AMEX:SPY before entries.

GOOG Entry, Volume, Target, StopEntry: with price above 134.08
Volume: with volume greater than 27M
Target: 143.16 area (this is an area, no guarantee it reaches this price, but you should be selling on the way up)
Stop: Depending on your risk tolerance; Based on an entry of 134.08, 131.40 gets you 2/1 Reward to Risk Ratio.
This LONG swing trade idea is not trade advice and is strictly based on my ideas and technical analysis. No due diligence or fundamental analysis was performed while evaluating this trade idea. Do not take this trade based on my idea, do not follow anyone blindly, do your own analysis and due diligence. I am not a professional trader.

Watching AMZN break of 139.64 for continuationThe headline chart is a 15 min chart, but it's easier to see what's really happening on the 5 min chart where it broke a wedge downwards and remains to reject entry back into the trend:
I'll be watching for breakdown entry under 139.64 only if it retests it and confirms resistance. I would be looking for 138ish.
Already played NASDAQ:AMD for +20% today. Continued to +50% on strength.
Welcome to follow for more insights.
Of course, this move is cancelled if it breaks 139.98 and becomes support. Thanks for reading.

India - Stock Ride the Revival of Reality - Kolte Patil - Trade NSE:KOLTEPATIL
INDIA Company is in real estate business (Residential & Commercial) with dominant presence in the Pune and growing presence in Mumbai and Bengaluru.
Koltie patil
Company markets its projects under two brands:
'Kolte-Patil’ (addressing the mid-income segment)
‘24K’ (addressing the premium luxury segment).
Market Presence
Co. has delivered more than 20 Million Sq. Ft. of area across Pune, Bengaluru and Mumbai.
New Launches
Launches planned across
all 3 cities of presence –Pune, Mumbai &
Bengaluru with saleable area of ~7.2 msf
Aggregate topline potential of over ~Rs. 5,700 crore
Project Portfolio Q-1 FY 2021-22
29.38 million sq. ft. (MSF) project portfolio -
Under execution - 3.22 MSF
Approval - 10.36 MSF
Land bank - 15.80 MSF
Tie Ups under Capital Light and DM Model and expected Revenue and Profits
FY 21
Signed three new projects with a
combined saleable area of ~2.2 msf in
Pune (Baner, Moshi, Wagholi) under
capital light models. Expected Total
Topline of ~Rs. 1,500 crore and KPDL
PBT of ~Rs. 220 crore
Three redevelopment
projects with a combined saleable
area of ~0.52 msf in Mumbai (Evara,
Verve, Vaayu). Expected Topline of
over Rs. 1,000 crore
FY 22
Signed two new projects with a combined
saleable area of ~1.3 msf in Pune (Hinjewadi,
Tathawade) under DM model. Expected DM
fees of ~Rs. 80 crore
Three redevelopment projects with a combined saleable area of ~0.3 msf in Mumbai (Sukh Niwas, Golden Pebbles,
Jeevan Sudha). Expected Topline of ~ Rs. 700
crore
Bought Back Stake from ICICI
KPDL entered into a share purchase agreement to buy-out the 50% stake held by 2 funds managed by ICICI Venture Funds Management Company Limited in the flagship Life Republic township project. The buy-out consideration was of Rs. 210 Crore and it is paid fully.
Project Funding and Partners
1) Kohlberg-Kravis Roberts (KKR) committed INR 193 Crore in the R1 sector of Life Republic, Pune.
2) Company entered into a Rs 120 Crore agreement with an affiliate of J.P. Morgan Asset Management for its redevelopment project Jay-Vijay Society in Vile Parle (E), Mumbai.
Residential Development Platform
The Co. announced creation of a residential development platform with Planet Smart City, to develop 15,000 housing units. It will focus primarily on development of aspirational housing projects in Pune, Mumbai and Bengaluru.
CEO appointment
Mr. Gopal Sarda resigned from the post of Group CEO of the Company on 10 June 2021 and Mr. Yashvardhan Patil’s was appointed as Group CEO of Kolte-Patil Developers Limited (KPDL) w.e.f June 12, 2021.
Awards
Company received The Economic Times - Brand of the Year Award in 2019
Brand Excellence in Real Estate Sector

Nifty50 Intraday Levels TradePlan Analysis Aug 08Black Line zones - Resistances
R1 - 19617-19639
R2 - 19723-19795
R3 - 19805-19822
R4 - 19842-19876
Green line zones - Demand
S1 - 19593-19574
S2 - 19555-19510
S3 - 19595-19462
S4 - 19350-19295
Analysis:-
Nifty is in a process of forming a retracement , Lower High for the Downtrend formed. But if it moves strong above 19684-19733 which is the 78.6% to 88.6% retracement levels of the previous major swing, which also coincides with the Gap supply zone and out of the falling channel that has formed, then there are high probabilities that the market trend would change to uptrend.
Trade Plan:-
If the Market opens flat,
1) Would look for any rejection at the Trendline and initiate shorts till the demand levels such as today's day low, Friday's day low based on price action and setup confirmation.
2) Can also look for reversal trades at the demand zones marked post consolidation beyond 10:15 AM.
3) One can initiate longs if the trendline breakout happens post-consolidation beyond 60-75 minutes of market opening.
If the Market opens gap up,
1) Will look to short the market at the mentioned supply zones and run till the gap filling happens or till the Trendline support or the marked demand zones based on Technical setup confirmations.
2) One can initiate longs if the trendline breakout happens post-consolidation beyond 60-75 minutes of market opening.
3) Can go long once the gap filling is complete based on Technical setups.
If the Market opens gap down,
1) Will go short if today's or Friday's low is broken.
2) Will go long if gap is at demand levels marked with CONSOLIDATION and setup confirmation. Would look to run till Trendline/Gap resistances.
Happy trading! Please do comment for suggestions.
Please do check for Demand zones below 19200.

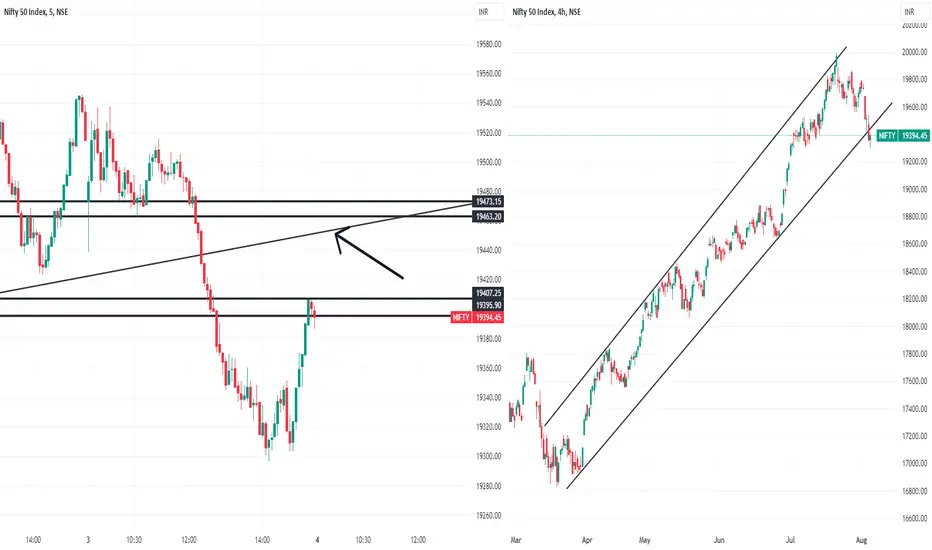
Nifty Analysis and Trade Plan for August 4Market Analysis –
Overall structure – Downtrend/Bearish, although buying is happening at the lower levels, yet to reach the final targets of this down wave that has begun. Targets as per M pattern breakdown, descending triangle breakdown – 19235.
The market has clearly broken the M pattern and descending triangle support, took a retest at 19545 zone, and proceeded to break the previous swing low thereby confirming the downtrend.
Also Nifty has broken the long-running channel support.
Shorts –
When breaks PDL in a sharp move / consolidation move.
When price gets rejected from TL resistance/ 463-472 zone/PDC zone, sharp down move or consolidation move with setup confirmation.
Longs –
If price takes support at PDL , entry only after consolidation breakout, no sharp entries, if sharp moves, then ignore.
Resistance zones are marked in the chart. For support zones kindly refer
People who are not interested in depth probabilities and relevant trade actions list,please ignore the below.
In detail Probabilities -
The market opens gap down – within today’s low range –
Price may take support at today’s low and move to today’s close or till 19463-478 zone or trendline retest. Can look for long only if price consolidates, multiple times take support at the same zone before moving up.
Or
Price may consolidate and move down breaking today’s low. Can consider entry based on consolidation breakdown or even sharp down move breaking today’s low based on setup confirmation.
Or
Price may move up to fill the gap or even higher and the eventually come down, would prefer to trade shorts only based on setup confirmation at PDC/TL resistance zone/PDL.
The market opens flat --
Price may move up till max 19463-478 zone or trendline zone and come back again till today’s close and consolidate there before any further down move. Could probably look for short opportunities in the mentioned resistance zones – Can consider consolidation or even sharp down move with setup confirmation.
Or
Price may move down till today’s low and consolidate further before any further down move. Could probably look for short opportunities post price compression/consolidation when today’s low is broken.
Or
Price may move down and take support at today’s low and move to today’s close or till 19463-478 zone or trendline zone. Can look for long opportunities only based on Price action at the lowest range if it happens with a consolidation.
The market opens gap up --
Price may plausibly get sold off till today’s close and then consolidate and move down further. May be worth looking for short opportunities at least till today’s close and then further based on PA, sharp/ immediate entries also, based on any setup confirmation.
Happy trading!
QQQ Entry, Volume, Target, Stop
Entry: with price above 387.98
Volume: with volume greater than 54M
Target: 398.92 area (this is an area, no guarantee it reaches this price, but you should be selling on the way up)
Stop: Depending on your risk tolerance; Based on an entry of 387.99, 382.52 gets you 2/1 Reward to Risk Ratio.
This LONG swing trade idea is not trade advice and is strictly based on my ideas and technical analysis. No due diligence or fundamental analysis was performed while evaluating this trade idea. Do not take this trade based on my idea, do not follow anyone blindly, do your own analysis and due diligence. I am not a professional trader.

$DXY - Keep an 👀TVC:DXY CAPITALCOM:DXY
TVC:DXY - Keep an 👀
Currently we are within the range: Lows: 100.820 Highs: 103.150
Pattern: Wedge
We are at an very interesting area when it comes to dollar! Keep your eyes wide open a break above 103 areas, we could easily go towards 105 handle. However, if we are to close below the range of 100 areas then bears are still in control. A great break out trade idea!
Keep in mind those trendlines going down.
Trade Journal

GBP - 1.24 Lower Next?!GBP - 1.24 Next?! CME:6B1! FX:GBPUSD
GBPUSD - 1.24 Next!
We've had a great run, I'd still be buying longer term dips on GBP - However, for now I feel a pull back is due and this is great opportunity for us traders to take opportunities of the bull and bear side!
Overall pattern, wedge - We've broken to down side the first area of interest to me is 1.24/ 1.23 high areas and the next would be 1.22 areas! If we are to close above 1.25 i'd be re thinking this plan...
Trade Journal
(Not Financial Advice)


NQ - Interesting area!NQ - Interesting area! CME_MINI:NQ1! GLOBALPRIME:NAS100
Another key resistance area
Highs: 13248.75
Lows:12957.00
Currently we are still within the ranges even though we've had CPI print we did escalate higher, but couldn't go above key resistance of: 13230 areas we could need break higher above that resistance to go towards levels of 13347.00. However, if we are to break below the lows I expect 12800 areas to be key support that could be reached!
Pay attention!
Trade Journal

F - FORD MOTORSNYSE:F Price maintian its horizantal support since FEB21
TRADE PLAN 1) BUY: AROUND 11.50/10.88
SL: CLOSING BELOW 10.50
TP: 14.25/14.50 (23%)
TRADE PLAN 2)BUY: WHEN THE PRICE CLOSE ABOVE 14.50
SL: CLOSE BELOW 14
TP1:16.83 (16%)
TP2:17.87 (22%)

USTECH100CFD 31 MARCH 2023 (NASDAQ)Findings:
1) Dow Theory Previous HH broke possibly will make new HH.
2) Cup and Handle breakout neckline breached.
3) Bullish Flag Formation Hight point breached.
4) History: In correction phase never goes sides ways, always makes V shape recovery in Daily Time Frame.
Analysis:
Strong Buy Call, Buy on Dips
Trade Plan:
ENTRY 13002
STOPLOSS 12460
TARGET 1 13430
TARGET 2 13850

GBPUSD TRADE IDEA / DAY TRADE / LONG (UK - RISK EVENT)This is trade idea for GBPUSD Day Trade Trade
-Buy in Order Block Area TF5M Near Sell Side Liquidity (SSLQ) of asian session with range 1.22674 - 1.22614 according to the confirmation that will occur.
-This trade for Event UK Retail Sales news.
-Risk Reward 1:3

#ES_F Thursday 1.26.23 Overview Review: Last night Globex opened and drove under 4030-25 trapping supply over which started our move overnight move. Yesterday we had signs that inventory is still low and someone is buying, Globex was used to drop the bid under Previous day low which helped get us under 94-89 and our T2 Low Support which made more people sell out into the buying under 3976-71. Once selling has stopped the inventory was short and our supply was back over 4030-25, today showed us that there is still size covering and wanting that supply. 4076-71 was look below and fail, once we got back over T2 Low and 3994-89 position was below us.
Overview: Interested to see what we will do in Globex tonight, we still have supply that is coming out from above this 4042 area and now our buyers are under 4025 and under 4012-08. If we break under 4030-25 there might be a chance to visit 4012-08 or close to it, if we wont see a full test or break under it that will show strength going into RTH but it might be a tricky day as we might be trying to get as many sellers shaken out before making another run at bigger Supply area. as long as we are holding over 4000-4012 area there is a good chance to make another attempt higher to 4046-42 // 4061-56 which would be our T2 High and maybe get close to 4084-77. Ideally we don't go there tonight first but instead come down lower and consolidate. If we do get over 4061 at whatever point that is not the best area to add because that is an area of bigger supply and things can come to an end quick. Area to be careful at.
If we do break under 4012-08 - 4000 those will be first red flags and break and hold under 95-89 would be a big warning might change things to the downside pretty quick.
Levels to Watch: 3994-89 // 4012-08 // 4035-25 // 4046-42 // 4061-56 // 408477

Fibonacci Retracement on NiftyNSE:NIFTY
Fibonacci Retracement plotted on NSE:NIFTY suggests that triple bottom has been confirmed on
50% fib level around 17,792.
Trade plan has been shared with Risk / Reward ration of 1:2
Entry : 18,082
Exit : 18,710
SL : 17,776
Good Luck !!
