Tesla Trade Breakdown: The Power of Structure, Liquidity & ...🔍 Why This Trade Was Taken
🔹 Channel Structure + Liquidity Trap
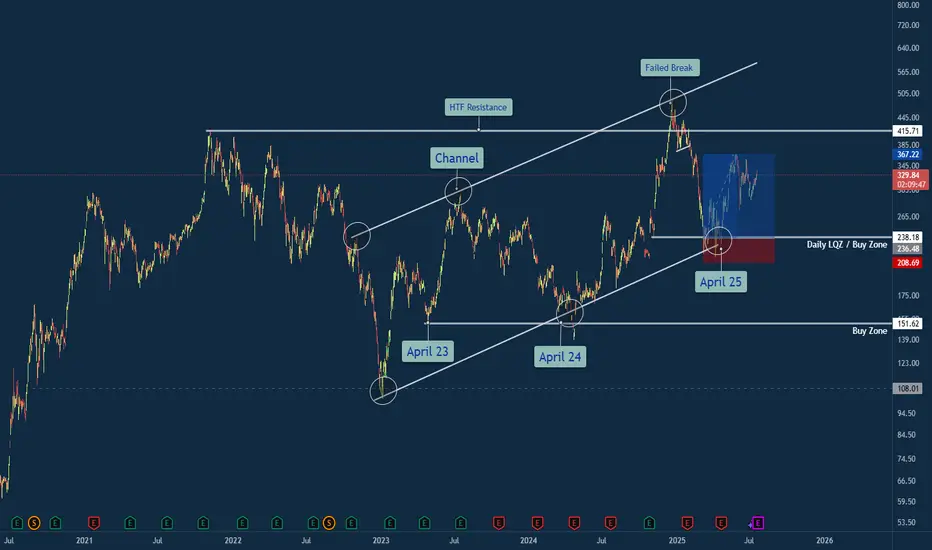
Price rejected from a long-standing higher time frame resistance channel, making a false breakout above $500 — a classic sign of exhaustion. What followed was a sharp retracement into the lower bounds of the macro channel, aligning with my Daily LQZ (Liquidity Zone).
🔹 Buy Zone Confidence: April 25
I mapped the April 25th liquidity grab as a high-probability reversal date, especially with price landing in a confluence of:
Demand Zone
Trendline Support (from April 23 & April 24 anchor points)
Volume spike + reclaim of structure
🔹 Risk/Reward Favored Asymmetry
With a clear invalidation below $208 and targets at prior supply around $330+, the R:R on this trade was ideal (over 3:1 potential).
Lessons Reinforced
🎯 Structure Always Tells a Story: The macro channel held strong — even after a failed breakout attempt.
💧 Liquidity Zones Matter: Price gravitated toward where stops live — and then reversed sharply.
🧘♂️ Patience Beats Precision: The best trades don’t chase. They wait. This was one of them.
💬 Your Turn
How did you play TSLA this year? Were you watching the same channel? Drop your insights or charts below — let’s compare notes 👇
#TSLA #Tesla #SwingTrade #PriceAction #LiquidityZone #FailedBreakout #TechnicalAnalysis #TradingView #TradeRecap #ChannelSupport #SmartMoney
Traderecap
EURUSD & US30 Trade Recaps 18.07.25A long position taken on FX:EURUSD for a breakeven, slightly higher in risk due to the reasons explained in the breakdown. Followed by a long on OANDA:US30USD that resulted in a loss due to the volatility spike that came in from Trump.
Full explanation as to why I executed on these positions and the management plan with both.
Any questions you have just drop them below 👇

11.07.25 USDJPY Trade Recap + Re-Entry for +2.5%A long position taken on USDJPY for a breakeven, followed by a premature re-entry that I took a loss on. I also explain the true re-entry I should have taken for a 2.5% win.
Full explanation as to why I executed on these positions and also more details around the third position that I did not take.
Any questions you have just drop them below 👇

EURNZD Trade Recap +3% 2nd July 2025A long position taken on EURNZD for +3%. Full explanation as to why I executed on this position and also my management plan I put in place.
Any questions you have just drop them below 👇

EURAUD -0.7% Short and AUDUSD MistakeA short position taken on EURAUD for a small loss after manually closing before swaps. I have also included a breakdown of a +4% AUDUSD long I was looking at taking but a small error on my behalf that caused me to stay out of the trade. Full explanation as to why I executed on this position and made the decision to manually close at the level I did.
Any questions you have just drop them below 👇

EURUSD +3% Trade Recap 17th June 2025A short position taken on EURUSD for +3%, full explanation as to why I executed on this position and made the decision to manually close at the level I did.
Any questions you have just drop them below 👇

03.06.25 AUDUSD Trade Recap (Breakeven Manual Close)A long position taken on AUDUSD for a breakeven manual close, full explanation as to why I made this decision in the recap and my current thoughts on this pairs next move

-1% GBPAUD & +2.5% GBPCHF Trade RecapsTwo positions I took over the last 10 trading days, both 4H entries, one long and one short.
FX:GBPAUD Short -1%
FX:GBPCHF Long +2.5%
Top down analysis explained in the video and also my thought processes behind playing both entries as limit orders to maximise R:R and protect stops much better.

How I Used COT to Profit in Crude Oil I show you my process from start to finish.
How to identify:
If a market is setup for a move of some significance.
How to confirm a setup using accumulation/distribution measurements & seasonals.
Finally, how to utilize technical methods to enter into a trade.

How I Used COT to Make $2,450 in Crude Oil This WeekI show you my process from start to finish, the same process I use every week to profit from the markets.
-Fundamental Setup
-Confirmation
-Technical Entry
-Exit/Stop

GBPNZD +4.5% Win Trade RecapA FX:GBPNZD short position I took in the last trading week, resulting in a +4.5% win.
Top down analysis explained in the video and also my reasons for the lower timeframe entry in combination with the manual close decision.

Trade recap EUR/USD 06.02.2025Todays trade recap for EUR/USD in the New York session highlighting the break and retest strategy.

-1% NZDJPY & +3.4% USDJPY Trade RecapsTwo short positions I took in the last trading week.
FX:NZDJPY | -1% Loss
FX:USDJPY | +3.4% Win
Top down analysis explained in the video and also my reasons for the weighted timeframe entry in combination with the management decision.

NZDCAD Trade RecapA short position I took the beginning of last week for a breakeven. Top down analysis explained in the video and also my reasons for the weighted timeframe entry in combination with the management decision.
FX:NZDCAD - Breakeven

UK100GBP & NZDJPY Trade RecapApologies for the video cutting off at the end, I was too carried away in flow and forgot TradingView has a 20 minute maximum time limit! 😆
Any questions you have just drop them below 👇
OANDA:UK100GBP - Breakeven
FX:NZDJPY - +3.4%

trade recap. Here’s a recap of today's trading setups: I experienced one loss but had a lovely win the second time around. Patience is essential, and it's crucial to wait for the setup to unfold step by step. Whether you win or lose, always stick to the plan.

14.11.24 Morning Forecast + GBPAUD Trade RecapPairs on Watch -
FX:EURGBP
FX:EURNZD
A short overview of the instruments I am looking at for today, multi-timeframe analysis down to what I will be looking at for an entry. Enjoy!

post market analysis/Trade recap 6/28/24Market Recap:
Great technical analysis this week with my predictions in the market.
Yesterday my levels of:
5583.00 (bullish) & 5518.50 (bearish) were almost spot on.
Price went bullish to the level of:
5584.25
Price retreated back to the levels of:
5518.25
Trades Recap:
Not so solid on the trade entries as I got faked out, not seeing the gap being filled rather than an anty setup. That is okay, however soon after I also missed a real Anty setup. It could have been a much better trading day but all in all I am not upset and feeling good for next week.
Sunday I will be posting an analysis for the following week and potential levels to be looking out for. These are levels that I believe have merit and strength.

USDJPY New York Session Buy Recap 51 pipsTook successful UJ buys after price broke resistance, waited for a pullback and entered anticipating price to move up with NY volume.
Looked to target a 4hr wickfill and stops were placed below support.

EURUSD Trade Recap 11th August 2023Breakeven taken on EURUSD last Friday, very happy with the management. Full explanation in the recap.
🧠Emotional Log
---
**Pre-Trade**
I understand all the confluences within my thesis, I accept this risk as I know if it is a loss I clearly understand exactly why I took to the trade. My stop is protected and if price takes me out there is a chance it is forming something else anyway. Do not be greedy, but also do not hesitate. These are the trades I must allow myself to take.
**During Trade**
My stop is protected, allow price to do its thing. My entry is valid, and I understand structure over candlesticks. I utilised the timeframes as best I could, working from the 1H structure filtering down to the 15M without jumping in. Do not choke the trade, mini 90% rule is in play so let price do its thing.
**Post-Trade**
I understand that price created a mini scoop for a much sharper entry, however, how can we guarantee this will always happen. My entry was valid, and stop was protected, I understood the 90% rule kicking in and managed risk accordingly to price action on the 1H. Nothing more I could have done in this situation and capital was protected.

USDJPY Trade Recap 19th July 2023How am I feeling pre-trade?
I am feeling confident in my mind, I forecasted the risk entry and not allowed little things to put me off the trade. Normally I would be saying things like ‘its gone past the hook’, ‘there needs to be a nice retrace or pin bar’ but ultimately it has all of the ingredients to sell. Ascending channel, meets AT hook with a 1H retrace candle. I am happy I did not allow these past issues to overcome my decision, this is also helping with my entry criteria and structure over candlesticks.


BOIL Day Trade Recap and ReviewBOIL the 3x Leveraged ETF of natural gas futures has been highly volatile. Volatility yields high
profits if there are good entries and trade management. This past Friday BOIL was doing a
reverse split ( 20 shares become one) which I considered to be an opportunity for high profit
because a higher number of traders would have eyes on the chart.
The 15-minute chart is shown here with an anchored VWAP from 2 days earlier. At market open
price reversed a downtrend after the reverse split in the premarket. It got support from the line
one standard deviation below the mean VWAP. My first considered entry was the second green
HA candle in the reversal with a stop loss at the pivot low of the red candles. However
I passed on this entry and instead entered upon price crossing the mean VWAP. The entry
was supported by the indicators showing Z score and volatility. The entry was made more
precise by analysis on the 5-minute chart. The stop loss was set at the value of the close of the
last candle to close below VWAP. After that, trade management was routine. Every time
price went up 1% I raised the stop loss by the same amount until getting up 6% Once at that
level, I changed to a trailing stop loss of 2% so I could pay attention to other trading chores.
At the same time, I set an alert for when the price crossed to above two standard deviations
above the mean anchored VWAP. I did this because this is the overvalued overbought area
where institutional traders will set sell orders either short selling or closing profitable
trades. The resultant reversal would diminish my unrealized profits. In this case, I got
the alert and closed the position without the trailing loss. The trade resulted in a profit
of 12% without use of leverage or margin other than the leverage imbedded in BOIL inself.
