GBPCHF Double bottom formationHere we have the GBPCHF trade where it looks like a double bottom formation where I will defiantly have a cheeky buy just like 10/1 odds
Traderlifestyle

USDJPY - Is The Dollar In Trouble ? After seeing a series of higher highs and higher lows in a corrective ascending channel, we've now seen a lower high made which could potentially break structure. This was also the 3rd touch off the descending trend line around the 78.6% Fibonacci level. We then saw a break & retest of the ascending channel off the 61.8% Fibonacci level giving us the perfect entry for a sell.
I have an entry and will be looking for more retracements to enter on this pair. News may also play a role as we have the FOMC Press Conference, announcing economic projections and Federal Funds Rate, as well as the first quarterly GDP statistics. These are volatile news events so take note of the date and time. There is also plenty more data coming out for the USD so I believe we can see the Japanese Yen being treated as a safe haven.
As always, trade with risk management and have a great trading week !
Instagram: keownarcher

GBPJPY - A Potential Pump & Dump situation In Play ? Good to be back, had a slight break from the charts & articles this weekend but we coming in full force this week!
Beginning with news this week, we can expect a lot of volatility to be seen for the Pound as we continue with BREXIT votes , as well as we will be seeing data releases for the Average Earning Index first quarter, retail sales, CPI data and the official bank rate. This will only be released once the MCP Official Bank Rates votes are completed. We also see the Monetary Policy summary this week. So volatility is expected for GBP - not surprising with speculation in the air that the Brexit vote this week may not be held unless "it has prospect of success" as Theresa May struggles with the DUP & ERG.
Back to Technicals, starting on the monthly, I spotted an exciting potential head & shoulder pattern forming with the right shoulder currently being formed. Amidst the Brexit uncertainty, the GBP has gained bullish momentum seen since the flash crash which strengthened the Yen. I believe that after this impulsive movement seen in January, we are in a corrective channel as we can soon expect another impulsive movement. We fell just short of the 71% Fibonacci level which lies 15 pips shy of the monthly key.
Dropping down to the daily timeframe, we saw a nice retracement off the 61.8% Fibonacci level for a buy entry, however I don't see these upward targets of 150.600-153.250 being met as we are seeing resistance currently and selling pressure. I do however see another push higher to test 149.000-150.000 price regions .This will see large downside potential meeting the monthly key. I'll be watching for candle stick reversal patterns and a break of the ascending channel on lower timeframes, and weary of price surges higher looking for stop hunts with volatile news surrounding whether or not we will see a no deal .
We have seen higher highs and higher lows being made on the daily timeframe with a recent discrete higher high made, just 30 pips above the prior higher high. Price looks exhausted and I believe we are reaching Bears territory with the 149.250 - 149.750 price region being a strong resistance during last year and even further. Coming into 2019 reaching these highs, I believe we can see a a massive reversal with fundamental news also playing a large role. This may be a major pump & dump scenario forming.
Let me know what you think !
Instagram : keownarcher - if you need any questions answered head over here.

GBPUSD - Cable preparing for a new leg to the downsideLast night we had exciting movement from cable, seeing price bounce off a daily support/resistance region. The main catalyst being PM May's visit to Strasbourg yesterday where it was rumoured she had gained assurances from the EU. However, as of today it is evident she was unable to win over the Government & Members of Parliament, with the governments chief legal adviser giving a rather dovish statement and low liking to her BREXIT deal. A few of PM Mays own party members will reject her deal.This was a classic "Buy the rumour, sell the news" event. Members of Parliament are worried as the PM looks set to see a no deal outcome. Unless of course, the PM and her party alongside the ERG, DUP and majority of voters vote for the PM - which i highly doubt.
Back to technicals and we can see on the daily timeframe we had a couple of higher highs and higher lows. However, we have come close to a 3rd touch of the trend line due to last nights news, forming a new lower high. Fundamentals are currently respecting technicals as we've seen a rejection of the descending trend line and a ping off price ranging between the 78.6 / 88.6 Fibonacci regions. We also managed to come below the daily support/resistance marked in purple. Short term downside targets are 1.28600 and 1.27350 respectively. I expect a retracement to this purple resistance also laying in line with the 61.8 Fibonacci retracement region before seeing a leg to the downside, before creating a new lower low. This can be a great swing trade to capitalise on a no deal result before seeing a recovery of the GBP.
As always, risk management is key. Market manipulation and volatility is expected in these times of uncertainty and volatile news event times should be noted!
Thanks for reading, if you have an questions hit me up on instagram.
Instagram : keownarcher

CADCHF - Can The Bears Override The Bulls ? Okay, so not a pair I usually trade or analyse but it was requested and I humbly accepted.
So we can see bulls are in control at the moment, I see an upside move of around 80 pips before we can see a good reversal zone met. I will be looking for the descending trend line to be respected between the 71%-88.6% Fibonacci zone. This will also be a good rejection from the weekly key and we can look for bearish candle stick patterns to indicate a reversal and then our next Lower High will be confirmed. This will then be anticipating a Lower low to continue the downtrend and we can see price drop of around 250 pips. Stop losses will be just above the weekly key.
Instagram: keownarcher

NASDAQ - Where can we go next ? Good old indices.
Okay firstly, so looking at the weekly timeframe, we have a potential head & shoulders pattern forming which will allow the bears to take over the market.
Dropping down to the daily timeframe we can see we broke out of an ascending channel and currently we are retesting it. If we can close below the counter trend line, we should see downside momentum. Although the candle stick pattern, a hammer followed by a bullish engulfing, I do see this pair falling in the long term. The bullish engulfing has brought us up to and between the 78.6 and 88.6 Fibonacci levels. There is a minor resistance seen here for 5 candle wicks dating back to the 25th of February.
I will be looking for reversals from this zone between the 78.6/88.6, a 3rd touch of the descending trend line with a strong candle stick pattern indicating price action is bearish. This will then create a discrete lower high followed by a lower low. Dropping down to the 4HR timeframe, we can see a higher high followed by a higher low, then there was a break of structure creating lower lows and lower highs. Thus i am looking for confirmation to short this pair with a great risk to reward ratio.
If no opportunity for a sell is presented for us and the resistance is broken, this short analysis will be invalidated. Which, leads to my next scenario. We see a higher high or a high created followed by a higher low to form an inverse head and shoulder pattern on the 4HR timeframe, allowing us to breach the monthly resistance and go higher.
NB : Risk management is key with indices, especially with each $1 accounting for 10 pips. Trade with risk management and smash the week!
instagram : keownarcher

High probability USDCAD Long With Good R/RUSDCAD has seen Higher Highs ( HH ) and Higher Lows ( HL ) being made on the Weekly and Daily timeframes for a good while now with 1 or 2 Lower Highs / Lower Low fake outs to pull sellers in, however this pair remains bullish. An Inverse Head & Shoulder pattern can be seen on the Daily timeframe which was formed aggressively on the 1st of March. This broke a descending channel creating a HL followed by a HH, with that being said, a HL should be formed to continue our leg to the upside. I have a Minor support on the daily in purple, using the Fibonacci Tool, this sits on a 38.2% retracement zone which will likely be my entry, with a tight stop loss of 30-40 pips. I will be looking for more confirmation with a bullish candle stick pattern at these zones. However this pair can retrace further to the Monthly Key shown which would lay on another great Fibonacci retracement zone. A retracement to the downside by 60-80 pips creating a HL would be favoured for you to then go long on this pair. The DXY looks to retrace before breaching 98.00 regions so this trade looks highly probable as well as the correlation between DXY and Gold, as Gold looks to retrace to the upside before seeing long term downside targets of 1250.00/1260.00 regions.
REMEMBER : Risk management is key for all trades & Have a profitable trading week everyone !
Instagram: keownarcher

THIS IS LOOKING GOOD, I'VE BEEN WAITING...looks like we're going for a run today, volume has been healthy for the past few days

infinity trades AUD/NZDh4 indicating term invesment to the downside. We would expect some corrections around our technical target.


EURUSD Possible Long ? EURUSD has broken out of my large structure/support line but not with much surety. Looking at the latest 4hr chart and it seems bullish may have gaining strength to go nearest 1.13500 level. On the other hand The US Dollar Index, which advanced to a fresh 2019 high of 97.37, was last seen down 0.1% on the day at 96.90. Investors may also be looking to book their profits ahead of the weekend and bring in some extra selling pressure on this pair.
Fundamental--> The data published by the Eurostat on friday showed that the trade surplus in the euro area narrowed to €17 billion in December from €19 billion in November. Later in the day, European Central Bank board member Benoit Coeure said that the slowdown in the eurozone was clearly stronger and broader than expected. Coeure further added that the ECB has recently discussed the possibility of a new TLTRO to further weigh on the shared currency.
Next week is gonna be interesting. We can look for the average bullish and bearish movement on monday and figure out if its giving us the opportunity to buy..!


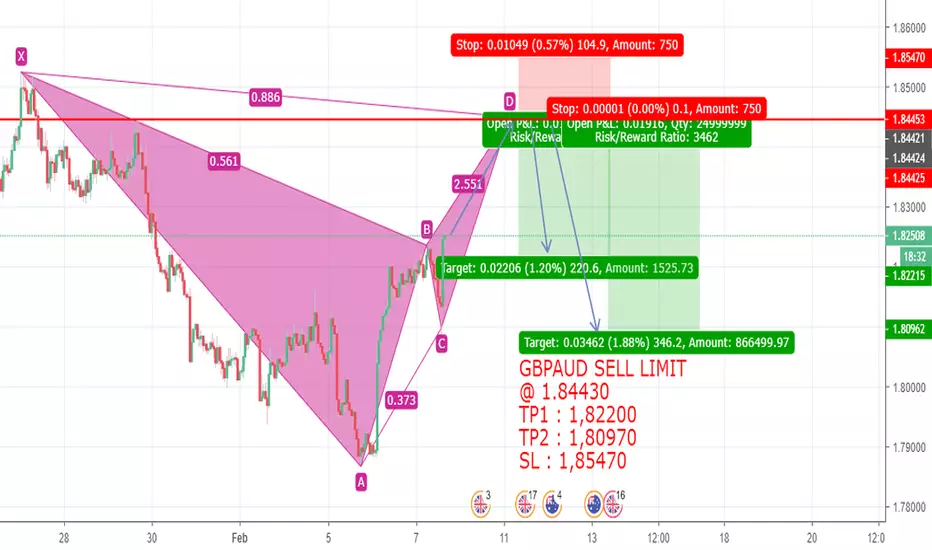
GBPAUD BEARISH BATH FORMATIONHERE gbpaud is at the last part of the bb formation , if prices pull up and get done the bearish bath formation we can short from there ....
Ethereum is a joke!! Down we go again!!SELF DEVELOPMENT/METHODOLOGY/PSYCHOLOGY
Ethereum has broken beneath support levels!! Significant drop to come!!
BITFINEX:ETHUSD is down by more than 93% over the past 12 months!!. ETHUSD has fallen through the 105 level and now we are looking for another significant drop to the 83 level, thats another 20% wow!
From my experience stay on the sidelines or short sell!!
Happy trading :)
Follow your Trading plan, remained disciplined and keep learning !!
Please Follow, Like,Comment & Follow
Thank you for your support :)
This information is not a recommendation to buy or sell. It is to be used for educational purposes only!

Inspirational Quotes that will change your life by Ben WrightSELF DEVELOPMENT/METHODOLOGY/PSYCHOLOGY
Here is a collection of inspirational trading/investing quotes that i live by;
1. “investing in yourself will be the best investment you make in your life” – Warren Buffet
2. “Trade small because that’s when you are as bad as you are ever going to be. Learn from your mistakes.”-Richard Dennis
1. “The goal of a successful trader is to make the best trade money is secondary” – Alexander Elder
2. “ Everybody gets what they want out of the market” – Ed Seykota
3. “Time is your friend: impulse is your enemy” – Jack Bogle
4. “Don’t focus on making money: focus on protecting what you have” – Paul Tudor Jones
5. “There is only one side to the stock market: and it is not the bull side or the bear side, but the right side” – Jesse Lauriston Livermore
6. “The best traders have no ego. You have to swallow your pride and get out of the losses” – Tom Baldwin
7. “ An investment in knowledge pays the best interest” – Benjamin Franklin
8. “ The key to making money in stocks is not to get scared out of them” – Peter Lynch
What are your favourites?
Happy trading :)
Follow your Trading plan, remained disciplined and keep learning !!

NU continuation.. As explained on the previous ' Publish' you can see the clear fractal pattern influencing the bullish continuation even on the lower time frames allowing for a nice hedge into the second macro position. We will have a powerful third touch here after completing the full 0-1 extension and now we will be seeking the .333 for the exhaustion phase allowing for a nice bullish momentum move. So much confluence with those Fibonacci levels. Will be awaiting clear confirmation.

USD/CAD 4H SHORT - SELL THE CORRECTIVE WAVEHey guys,
Decided to share my trading ideas.
The LONG SQUEEZE is done, hence we want to go SHORT around 200 MA on 4H chart.
1. We see volume decreasing going into key 1.34 level, so psychologically traders are more likely to take their profits.
2. Daily candles are not trending - the structure is mathematically incorrect.
3. 200 MA plays the big part on 4H chart approaching end of the week.
My ENTRY is: 1.3365
Looking for a 120-140 Pip move down.
Check me out on: www.forexandtravel.com

Possible Short Position AUD/USDSELF DEVELOPMENT/METHODOLOGY/PSYCHOLOGY
Chart time frame - H4
Timeframe - 1-2 Days
Actions on -
A – Activating Event
Currency Pair creating a Double Top .
B – Beliefs
Market will be rejected at @0.722 level and move towards the first Target 1 level @ 0.715
FX:AUDUSD
Trade Management
Entered @ Still waiting for confirmation.
Stop Loss @ Still waiting for confirmation.
Target 1 @ 0.715
Risk/Reward @ 2:1
Happy trading. Will let you know closer to the time if or when executed:)
Follow your Trading plan, remain disciplined and keep learning !!
Please Follow, Like,Comment & Follow
Thank you for your support :)
This information is not a recommendation to buy or sell. It is to be used for educational purposes only!

XRPUSD Short term SHORT XRP hit target earlier with pure precision. At my TP price - Price picked up pending liquidity and sell stops at that level and rejected. Also extra confluence with the .79 FIB level. A reasonable short term trade for XRP Is 0.32231.
Strive for Precision!
Youtube - JTG FX

Waltonchain Channel Breakout!!!WTC/BTC is currently breaking bullish out of its channel going back to mid November with big volume. I'm looking for consolidation right now with low sell volume and then continuation higher. There have been some alts doing this same thing recently and rallying up to their October levels. If this continues to rally, I will take profit around 0.0005 btc. Trade at your own risk.


