GBPCAD The UK economy is gradually stabilizingA recent survey by market research firm Ipsos found that two-thirds of Canadian respondents have given up on plans to own a home. Additionally, three-quarters believe that buying a home is a privilege for the wealthy. And 71% said the real estate crisis is still ongoing.
"The dream of homeownership is becoming a nightmare for an entire generation of Canadians," said Sean Simpson, vice president at Ipsos. The Ipsos survey surveyed Canadians of all ages, including those who already own a home. Sean Simpson said the results reflect Canada's attitude that homeownership is becoming increasingly unaffordable, especially for young people.
Federal government data also suggests younger Canadians may be leaving the housing market. According to a Statistics Canada report last week, outstanding mortgage debt is
Traderlifestyle

Daily Update Analysis on Nasdaq Futures Hello everyone. i have done my daily analysis of the Nasdaq futures and my take on the price action. i have discussed a lot of things regarding the daily and weekly time frame. i have also shared my personal game plan and shared my strategies and recommendation for the intraday levels. Hope this helps.

CADCHF CANADA's inflation is decreasing slightlyThe Canadian Dollar fell against the majority of G10 currencies following the release of data that showed inflation in Canada was slowing faster than economists expected.
Canadian CPI inflation rose 3.8% year-on-year in September, said Statistics Canada, which makes for a sharp decrease from 4.0% in August and was below expectations for a reading of 4.0%. The month-on-month change stood at -0.1%, which was below expectations for 0.1% and 0.4% recorded in August.
Meanwhile, Core CPI was down 0.1% m/m in August (2.8% y/y), while the trimmed CPI measure was at 3.7% y/y, below the 3.8% expected by markets and 3.9% previously.

CADJPY Recovery of currency exchange after inflationBanks and financial institutions buy and sell currencies with each other - these large institutions are the 'market' and the rate they trade at is the 'market rate'. The difference between the amount being bought and sold is the spread, which is essentially the difference between the buy and sell price.
However, when currency is sold by banks to retail customers, the spread increases significantly and the profit from the transaction is therefore significantly larger.
Therefore, when we focus on money transfer fees when sending money abroad, we often ignore the biggest cost: exchange rate differences.

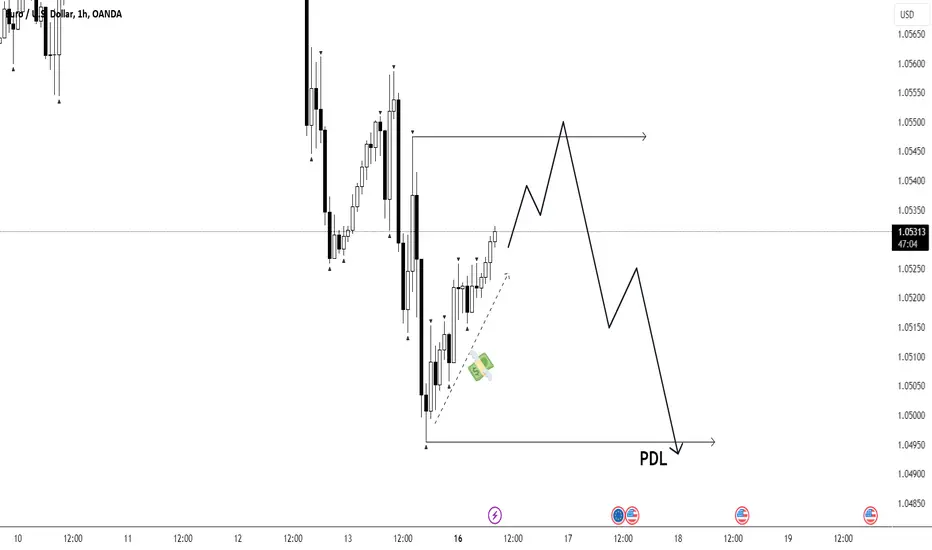
EURUSD#EURUSD
We definitely have a strong short context confirmation on all timeframes, as well as the absence of working with liquidity below
Target is PDL - the question of timing
BTC will probably decreaseBitcoin's (BTC) short-term recovery faces a key hurdle just above $27,000. The leading asset's sharp reversal from $28,200 has resulted in a 5% loss in value.

UFP Industries (UFPI) Surpasses Market ReturnsUFP Industries (UFPI) closed at $101.32, marking a +0.67% move from the previous day. This change outpaced the S&P 500's 0.63% gain on the day. Meanwhile, the Dow experienced a rise of 0.59%, and the technology-dominated Nasdaq saw an increase of 0.39%.
Coming into today, shares of the wood and materials provider for the construction industry had lost 0.76% in the past month. In that same time, the Construction sector lost 6.52%, while the S&P 500 lost 3.39%.

Gold opportunity On NFPGold is waiting for NFP to come as its consolidating under 1931 to 1820 level and we can see a potential to either side but possibly gold will fall to 1800 level that all buy orders will be settled under 1820 level and to run the market , market makers need the money and they will try hit SL of maximum traders under these levels so we will be seeing a potential downwards move that gold is not in any clear direction
We will consider gold on bullish side when it will break above 1931 level and put our order other wise our confluance is all set for sell
That the price is hovering under these levels the 2nd confluence is price is trading under 200EMA and no sign of revesal

KSE 100 index sell side tradeAs KSE 100 index is moving towards it H4 supply and will return immediately from there if we get any rejection on level we will be shorting
The confluance for sell baised is on H4 break of structure as higher low was broke and move back upward and we will return from supply level

Market Update - September 29 2023
Bipartisan Group in Congress urges spot Bitcoin ETF approval as SEC punts: Bitcoin saw a mid-week bump as a bipartisan group of Congressmembers urged SEC chair Gensler to immediately approve a Bitcoin ETF. The SEC delayed a number of spot ETF application decisions as a US government shutdown looms. By the end of the week, bitcoin was trending higher, sitting above FWB:27K USD.
MicroStrategy adds to its bitcoin coffers with purchases totalling ~$150 million: MicroStrategy, one of the largest bitcoin holders, bought 5,445 bitcoins for ~$147.3 million USD, at an average price around $27,053 USD. The purchases were made between August 1 and September 24. The company said it was considering buying even more.
Leading NFT brand Pudgy Penguins to sell toys at Walmart: Pudgy Toys collection will be available in 2,000 Walmart stores across America. Each toy comes with a QR code, which once scanned gives the user access to the online virtual Pudgy World.
Curve had a solid week as its founder closed out debt positions on Aave: Curve (CRV) rallied this week, trading up 17%, after Curve founder Michael Egorov paid off his entire debt position on the DeFi lending protocol Aave.
➡️ Read more here


EURUSD1D short context + 1h short context confirmation
My target hasnt changed - PWL
If we will make a fractal i will open short possition

How to trade TRover of 80% market is TR so we have to know how to trade it.
sign of TR
shadows, tails, overlap, confusing
weak legs
Multiple Returns
when TR start? after BO a trend line
now how we can trade this monster?
you have to put your orders after a top or bottom.
because hunting is normal in this area.
now let's go on chart!!!

How to trade Liquidity Sweeps 🌊 Trading liquidity sweeps 🌊 and identifying fake liquidity grabs 🕵️♂️ can be valuable skills for traders. These strategies involve capitalizing on market inefficiencies and understanding how institutional traders and algorithms influence price movements. In this guide, we'll explore what liquidity sweeps and fake liquidity grabs are and how to trade them effectively.
Understanding Liquidity Sweeps:
A liquidity sweep occurs when a trader executes a large market order that "sweeps" through the order book, clearing out available liquidity at various price levels. These sweeps often signal strong buying or selling interest, potentially leading to significant price moves.
Identifying Fake Liquidity Grabs:
Fake liquidity grabs 🎭 are market manipulation techniques used to deceive traders. Market makers or large players might place large orders on the order book to give the illusion of significant interest at a specific price level. However, they often cancel these orders before they get executed, leading to sudden reversals in price.
Trading Liquidity Sweeps:
Monitor Order Flow: Keep an eye on order flow and trade volume to identify sudden surges in trading activity. Liquidity sweeps are often accompanied by spikes in volume.
Identify Key Levels: Look for important support or resistance levels where liquidity sweeps are likely to occur. These levels can be based on technical analysis, such as previous highs or lows.
Entry and Stop-loss: Enter a trade when you spot a liquidity sweep that confirms your bias. Set stop-loss orders to manage risk in case the market moves against you.
Take Profits: Take profits when the market reacts as expected, but be prepared for quick price reversals. Liquidity sweeps can be followed by retracements.
Trading Fake Liquidity Grabs:
Be Cautious: Approach price moves driven by apparent liquidity grabs with caution. These moves can be short-lived.
Confirm Price Action: Wait for confirmation of the direction after the fake liquidity grab. Look for signs that real market sentiment is driving the price.
Risk Management: Place stop-loss orders to protect your capital in case the market reverses quickly. Avoid chasing the initial price move.
Use Additional Indicators: Combine your analysis with other technical indicators or market sentiment tools to increase your confidence in your trading decisions.
Conclusion:
Trading liquidity sweeps and fake liquidity grabs can offer opportunities for profit, but they also come with risks. It's essential to have a clear strategy, strict risk management rules, and the ability to adapt to rapidly changing market conditions. As with any trading strategy, practice and experience will help refine your skills in identifying and capitalizing on these market dynamics. 🚀📈🌊


EURUSD 1D
Hello, everyone! I suggest analyzing three potential scenarios for the development of events on the #EURUSD pair using the higher timeframe.
1 (marked in black on the chart) - Currently, we are in the imbalance zone of the 1D timeframe. Potentially, the price may clear the imbalance and continue moving downwards, possibly making new lows.
2 (marked in red on the chart) - Based on confirmed order flow, we might see the price in the 1.08 zone for liquidity removal, with the potential for a downward move, similar to previous instances marked in red.
3 (marked in green on the chart) - This scenario could become valid if the price reaches and consolidates above the 1.08 level. In this case, the previous order flow would act as continuous liquidity.
Have a great day, everyone!

EURUSD IDEASo the next trade i will took if it goes as planned is short on eurusd,as we see price is touching 0.5 fib retracment,i always put fib on a daily tf.Overall trend is bearish.
Wait for some kind of a confirmation to enter a short position like a bearish eng,or a pinbar to see that bears are serious about pushing the price down.Happy trading everyone!
entry around 1.06820
sl-1.07040
tp-1.05300

nasdaq is sellhi every one
nasdaq is uniq sell setup by smc and orderflow
please comment you idea for me

EURUSDHello everyone, today's review is on the Euro-Dollar pair. The higher timeframe still remains bearish. In New York, we have a lot of news that will likely remove liquidity above, confirming the order flow. The strong liquidity zone remains at the equal highs of the Asian session.
I plan to continue working on the short side after liq sweep

EURUSD#EURUSD
Hello everyone! The price is moving within the expected movement I outlined since yesterday. We have successfully covered the imbalance zone on the 1D timeframe. The logical next target will be the PWL (prev. week low) I plan to work with order flow until we reach the subsequent lows indicated on the chart.

EURUSDHello everyone, Euro-Dollar pair review. At the moment, we have two possible scenarios. The first one, highlighted in red, involves confirming the order flow by breaking the Asian high, after which we'll continue the decline towards the PWL. The second scenario, marked in black, is to break the current order flow to cover the imbalance zone on the daily timeframe.
The daily timeframe remains strongly bearish.


