UK100 BREAKTHROUGH AND RETEST THE RESISTANCEThe FTSE 100 index is well placed to extend its recent run higher ahead of the Bank of England’s decision on UK interest rates next Thursday. Once seen as almost certain, a rate hike has become less likely because of the spread of the coronavirus Omicron variant.
That’s positive for UK stocks even though the Government has already responded by tightening the pandemic rules in England. Masks will now have to be worn in most indoor public places and employees have been told to work from home if they can.
The UK FTSE 100 index traded lower on Monday and touch and retest the broken resistance line from December 6th of the downtrend formed from drawn from the high of November 12th. That said, the slide was paused near the 7220.00 level, still above the prior downside resistance line. As long as the index is trading and stopped on that level and in combination with that the traders sentiment is net long, it would be interesting to see how the price will react in the following days.
In order to start examining whether the outlook has darkened further, the experts would like to see a clear dip below 7180.00, support marked by the inside swing, and 61.8Fibo correction. The price will already be below the aforementioned downside line and the bears may get encouraged to push the action towards. If they are not willing to stop there, then we could see them pushing towards the low around 7115.00 or lower to 38.2Fibo correction around 7050.00 or lower to the strong support and psychological level around 7000.00.
On the upside, the experts would like to see a clear rebound back from the current levels before start examining whether the bulls have gained full control again. This will take the index above the upside line and could aim for the 7370.00 or 7397.00 zones. Another break, above 7397, could see scope for extensions towards the peak of February 21st, 2020, at around 7460.
Looking at our oscillator indicators we have to notice that MACD and RSI are very close to the oversold zone but also noted big short volume bars at the end of the year.
Risk Disclosure: Trading Foreign Exchange (Forex) and Contracts of Difference (CFD's) carry a high-risk level. By registering and signing up, any client affirms their understanding of their own personal accountability for all transactions performed within their account and recognizes the risks associated with trading on such markets and such sites. Furthermore, one understands that the company carries zero influence over transactions, needs, and trading signals. Therefore, it cannot be held liable nor guarantee any profits or losses.
Traders

BTC_USDT,WrongThe blue area is a resistance area and according to the behavior shown by the price, it should once again test the area of $ 42,000 to $ 44,000.
So for now, the move is negative for us in the short term

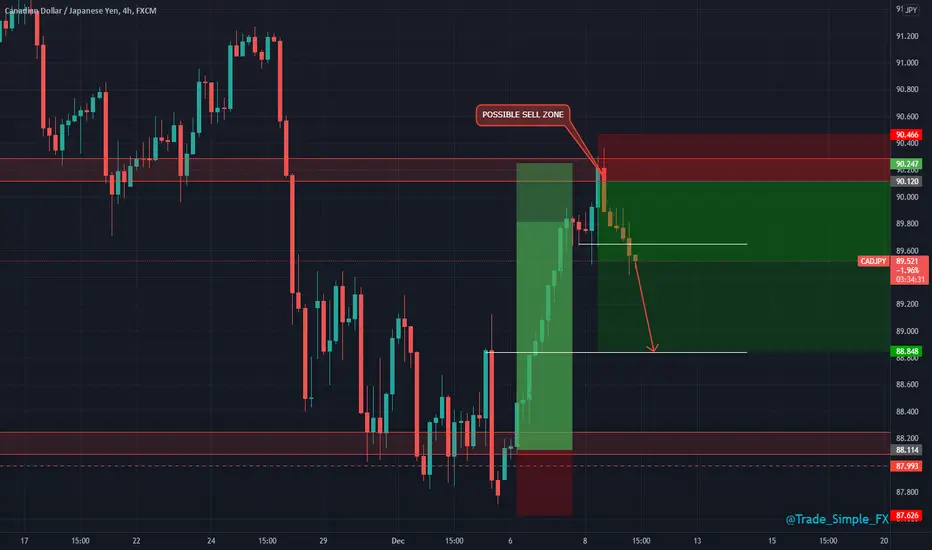
CADJPY H4 - Short SetupCADJPY H4
Snapshot of next anticipated move for this trading pair, seeing some really nice corrective selling pressure from our marked zone, hopefully we correct down to at least 800 price with the same momentum.
DXY Bullish movementKindly what am looking now for DXY is to continue bullish till we tap that first weekly LQ level and another confirmation no break in structure to both HTF 1D and 1W

1INCH trap idealet's try to be the trap some traders on 1INCH,
we could try to enter below the last two relative lows where lots of traders have their stops.
In that spot we are facing also a pretty cool demand zone so I am expecting some serious reaction,
the risk-reward 1:5 is nice and it's worth a try

S&P500 D1 - Long Investment DCAS&P 500 D1
Fresh highs set here on S&P yesterday too before US stock market close. Significant gains and performance. The DCA instruments for new stock/index fund investors. The go to!
If you're looking to invest your first $100, this is something I'd consider looking at!

GBPJPY H4 - Short SetupGBPJPY H4
Much bigger dump than expected, evident YEN strength over the eastern session, outperforming and correcting against the AUD too. Additionally, USDJPY looked to be seeing an upside break and retest before being upset by this YEN surge.

NIFTYBANK ANALYSIS ART.....BANKNIFTY MONTHLY TF >WG PT< LOOKING....FOR SHORT AND LONG
FOLLOW MY ANALYSIS
AS UH WISH BHURR.....
follow unfollow as uh wish bhurr,,,

AUDJPY | Short trade idea agains trendAUDJPY has bullish bias now in D1 and seems to go a correction. While many traders said "you must trade with the trend", and hinder to trade against a trend.
But, I have a trade counter trend if you like if you wanna ride this correction movement in D1. What you have to make sure is the intraday trend is supporting your trade and we use Ichimoku by this time. So, here is the deal. If price can breakout support 84.884, then we can going to short with target 82.065. Sounds good?
Beware of the risk by the way.
Happy trading.

Gold (XAUUSD) | Trade IdeasSince Mid June 2021, Gold move sideways between 1721.66-1834.2. And for traders who still wanna trade this gold now, I give you some trade ideas like in the chart. You have remind yourself that Gold now under bearish bias. The chance is price can drag down again around 1834.2, so be careful when market already near or around that level.
Good luck then.

EURUSD | Intra Day Shorts?EURUSD shorts that unfolded earlier today around 1.16587, It presented as a clear trade setup (H&S) as most of us know about this pattern but very few understand the technicals behind it and how it should be traded, I personally didn't take this trade as i was not trading during this time and mostly focus on (London Open) but thought I'll share this anyways and hopefully it might help someone here in their (Trading Journey) so back to the technicals... Entry level would be off the right shoulder that's lined up with our 61.80% fibonacci level and stops can be placed above previous candle closure and 78.50% fibonacci level, any price break above this will indicate a trend reversal and to manage our trade, we would want to be stopped out before the massive move happens. So stops would need to be placed above this level and traded at 1% risk or lower, I personally take all my trades at 0.25% risk regardless how right i am with trading, my main focus in trading is capital protection and it should be yours too. Exit levels on this will be the -23.00 | -61.80% fibonacci.
This is one of many profitable setups that can be traded, however - my best advice is to find one setup and stick with that daily, weekly.
I will start posting more content and trade idea's here later this week.
I'm enjoying it.
Kind Regards.

BTCUSD D1 - Long SetupBTCUSD D1
On fire, good week and weekend for BTC and other cryptos. Threatening to set new ATH's as we approach our top end resistance price of $63k.
Awaiting a break and retest before entries for both investing and trading.
We could see some rejections here back down to $50k, this would justify a more healthy correction from the rally starting from $40k, but lets see what happens.

SQ double bottom?This is a very classic setup on SQ. Buying off daily 200 on a double bottom. And in the last 3 bars it was a perfect breakout. Nice close today. Nice increasing volume on the long bearish dip in Oct 4th meaning people are trapped. Nice 1.4 risk/reward ratio.
But the experienced trader inside me is yelling and saying I should buy the stop of this classic setup. What do you think I will do :wink:?

GBPUSD- BULLISH AND BEARISH SETUPGBPUSD
Orderflow- Bearish
- Price retracing for deep pullback to grab some internal liquidity structure with a Bull bias for short term BUY
- Market manipulation
Price left with imbalance in price disagreement with buyers this brings back the setup for the Bears to take charge of the market again
If you find my setup useful please do like and follow

AUDCHFAUDCHF looking forward to drop with AC while we are still in a strong down trend ... i will wait for two hr confirmation when confirmed trade will be called

USDWTI H4 - Long SetupUSDWTI H4
Something we were following last week, took a couple of short positions on this pair for 1R and 1.3R before being stopped at entry/profit.
We have now started to see an upside breakout of both S/R and trend sequence. A bit more of a convincing breakout and subsequent retest could offer us long entries.

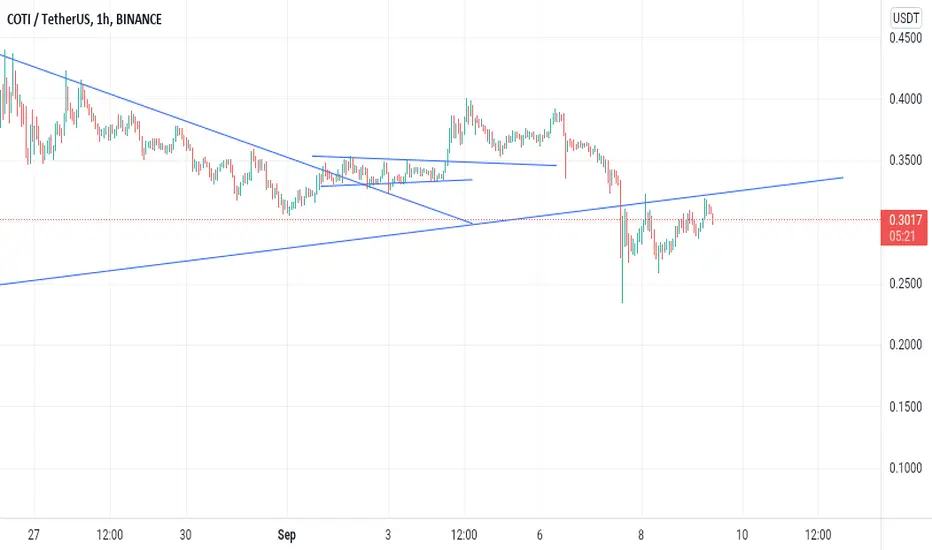
Coti analysis by vicWe are still in a bearish phase because of the bearish spike btc made so bears might show faces on this and any REJECTION from the bull we will go down and vice versa
Like
Share follow up and comment
Note➡️➡️➡️ People that says my analysis aren't correct yàa it might not be correct but as we all know No ONE IS Perfect when it comes to the market
Thumbs up if you like the idea or found it mildly interesting
It's Not a trading Advice
Note always check out your own research before opening any position take note
Bitcoin crashed.!!!!! The bull Market support band should hold.Hello Traders,
It was quite a shock yesterday but you shouldn't have been worried if you are following my chart properly. As for those who are new trust me, believe me when i tell you something important that no one would. You don't have to fear anything. Don't get scared of this slight pullback. Look at the bright side you weren't fallen from $64k but just mere $52k with 20% correction. Absolutely normal. You could have easily recovered the profits if you had a backup money which you should always have regardless of the bull or bear run.
So now arises an important question. Where to from here?????????
Fundamental Analysis :
If history has been any indication then we are right on track and we must carry our journey forward. But you have to know its september. Crazy things must happen this month and we have got three major dates for you.
!. On 13th-14th september depending on your timezone we have CPI data coming. A very important if you must know. (April 15) A high CPI is good because crypto loves inflation
2. On 21st-22nd september we have annual meeting of FED's. Some say we might get an idea about taper from there. If taper happens this year then you cant stop this rocket from going to the moon
3. We also should mark those dates when options are expiring. One such is on september 21 and one on last week of september. Do keep that in mind.
Technical analysis :
1. Charts are looking bad tbh but we have good news. No new shorts right now.
2. Fear is back in the market which is good opportunity to fill your bags.
3. Now we must hold bull market support band around 42-43k if we don't then maybe bears smell blood and will attack right away. Even i will join their party XD
4. 42.5k, 36k, 35k 31k, some major resistance to watch out if we break to downside.
Or at the end we all are in a bull trap in the mercy of institutions, financial cartel, big banks, IMF etc
Till then do not trade. Just accumulate with no leverage
Happy trading my bears and bulls
Regards
Dante. An artist of crypto.!!!

RVNUSDT - End of Cup HandleRVNUSDT - End of Cup Handle
RVN could be about to break through towards higher levels, what do you think?
Support has held and bounce off a few times, could we see 0.3?
Thanks,
TraderPaps

ASIAN PAINTS - Strong support!!.618 Fibonnaci level or 2960 is a crucial support for the stock.
Also, it is respecting the 50 EMA.
Less likely to breach.


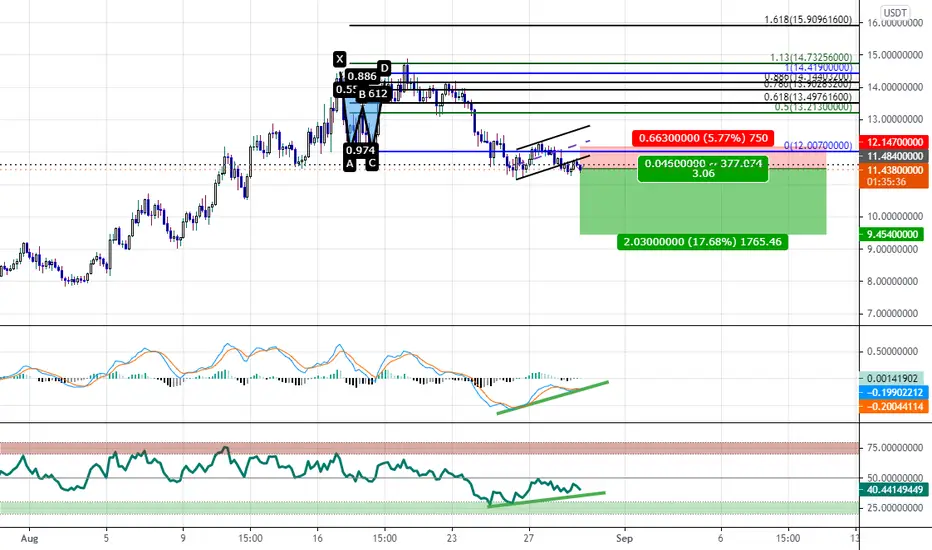
It Looks Like A Double Bottom But Very Likely Could Be A TrapI was looking at this earlier as a potential double bottom with bullish divergence and was looking to take a position after the sessions opened but after a few hours of waiting and letting the trading of this asset go on during the sessions i have not seen anything that would signal immediate bullishness.
I think that this "Double Bottom" Has potential to trap many bulls and instead send the price down to around $9.
The signal i will be using to enter short is once the MACD breaks the trendline and crosses bearishly i think we will see a nice move down to the $9s
Short term buy : ES1! / Emini / SPY500Price tried to break lower but got reversed & broke higher.
This has trapped a bunch of seller.
When they exit, it'll create a bullish trade idea.
We can trade along!
