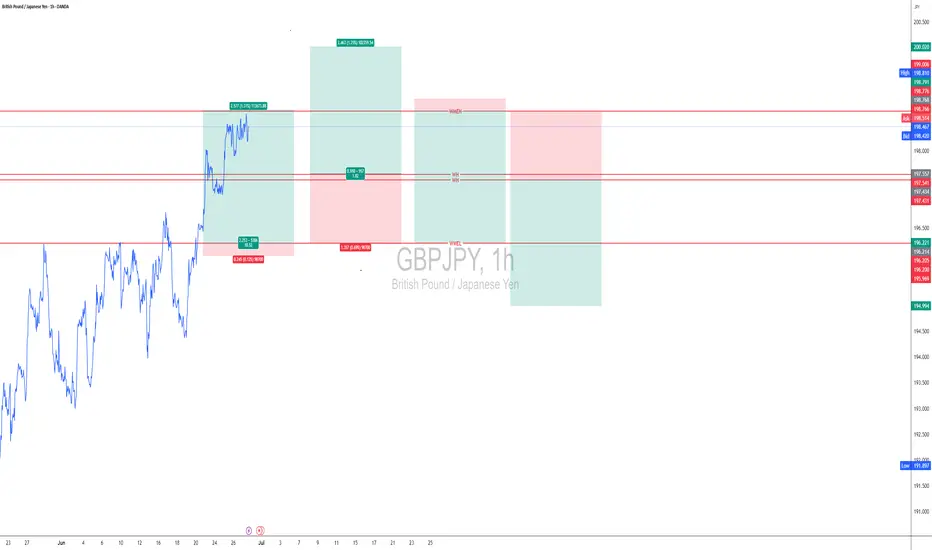
ANALYSIS FOR THE UP COMING DAYS AND WEEK FOR GBPJPY -GJ
Trading involves speculation and probabilities, making market direction predictions challenging. Mastering a strategy that works for you is crucial. Currently, I focus on my strategy to consistently profit.
Here's my analysis for the upcoming days: WH and WL levels indicate market direction. If the price closes above WH by Tuesday, expect an upward trend; if below WL, expect a downward trend.
For trading decisions, enter at WMEL or WMEH levels, or trade between them if you prefer and experienced. Always manage your risk carefully.
Don’t worry about the names, these are the names I have given my strategy:
Week High-WH
Week Low- WL
Week High Margin of Error High - WMEH
Week High Margin of Error Low – WMEl
197.5414432 WH
197.4305568 WL
196.2045568 WMEL
198.7674432 WMEH
Tradersmind
Gold's Game: Bouncing Back from Key LevelsLet’s talk about Gold for a sec.
I mentioned before that this level would be attractive for Gold because there’s liquidity and a local minimum that traders all over the world are eyeing and will be trading around. And that’s pretty much what happened.
But then Gold dipped lower and 'knocked' on another level of accumulated liquidity—what some folks call the 'triangle,' or whatever works for you. It knocked and then bounced back up, leaving those bears who got stuck in short positions in a bit of a tough spot.
So, bottom line, the sentiment is bullish for now, but it’s more like a 'borderline' bullish vibe, to be honest..

Live Trading Recap: USD/JPY Correction Phase TradeThis is a live execution of USD/JPY trade, demonstrating how to successfully execute a counter-trend strategy. This trade was all about understanding the market phases and recognizing the trend reversal at the right moment.
To pull off a counter-trend trade, you need more than just technical skills—you need a solid grasp of trading psychology. Staying patient, trusting your analysis, and managing emotions during market swings are key to making informed decisions.
Watch the video to see how I combined these elements to turn this trade into a win. Let me know your thoughts in the comments!

Trade Execution Setup Aug 4I have possibly captured all inputs for the trades taken. Please feel free to comment for any clarifications/suggestions.
1 & 2 in chart indicates 2 trading opportunities with their analysis.
Trade Opportunity 1 -
The market gap-up happened. so as per the trade plan, I was looking to short at the marked levels in the Trade Plan, but as there was no entry signal as per my trade setup, I ignored, and waited.
Observed a beautiful price compression breakout. Entered an ATM strike price at the compression breakout, but small SL was taken as the price did not move as expected.
Waited for the next trade opportunity.
Trade Opportunity 2 -
The market showed continuous signs of fatigue which were evident through the price action in 15 min,5 min, and 75 min.
1)15 min Candles were all Hammers, Shooting stars for about 1H+.
2)75 min showed rejection at 50% Fib level of Previous swing high. 5 min TF
3) 5 min showed a triple top sort of formation.
Hence eyed a PE ATM strike and entered a quick scalp based on 1 min Price compression/Triangle pattern breakout, 1:1.5 RR.
So was able to end the day at 5% ROI.

BUY Now 800 Pip move begins.. to 0.99768Very simple.. the bottom is formed and as soon as you begin to see a pull back toward a naked harmonic price goes straight to it. To cover it the price must return to 0.99768. All harmonic get filled 100% of the time.. 100% to it's target. Just a matter of when and it is usually soon on the chart. I am in right here at second bottom. 0.91711 Let's go!! Show em how real trading is done!

The Different Types Of Trading StrategiesHello everyone, as we all know the market action discounts everything :)
_________________________________Make sure to Like and Follow if you like the idea_________________________________
In today’s video, we are going to be talking about The Different Types Of Trading Strategies, We are going to compare them to each other and look at their characteristics.
Characteristics include 1) Time Duration, Type of Chart, Trade Targets & Risks, Frequency of Trades, Entry and Exit Time.
There are 4 types of trading styles :
Most people fall in the first 3
1) Scalping
2) Day trading
3) Swing trading
4) Position trading (Refers to holding a certain position over a very long time frame like a number of years, I think this type of trade is more of an investment than trading but technically it's still trading so I had to mention it ).
So Let Us Start...
1) Scalping
Time Duration is between a few seconds and a number of minutes
The Analysis is done on 1,2 and 5 minutes charts
Small targets considering the very short trade duration
High frequency of trades because of the small risk on each trade
Scalpers need to know exactly when to enter and when to exit a trade because a small mistake can have a huge impact on the trade
2) Day trading
Time Duration from 15 min to a number of hours
The analysis is done on 30 min, 1 hour, and 4-hour charts
These trades have a larger target than Scalping
Day Traders have a lower trade frequency than scalpers and its usually between 2-10 trades per week
Day Traders doesn’t have to be so precise with entry and exits like in Scalping because being late for a trade on a daily basis won't have that much of an impact on the trade.
3) Swing trading
Time Duration typically last from a day to a couple of months
The Analysis is done daily, weekly & monthly charts
Because of the time frame, Targets usually are way larger than day trading or scalping
Low frequency in trades, Usually between 2-15 trades per month
Entry and exits here don’t have a big impact because the targets are so big
So now you ask yourself how do I know which type of trader am I?
And it comes down to 2 main factors :
Personality: You could be someone who likes to hold trades and profit big so swing trading is for you, Or you could be someone who doesn’t like to hold trades over a day period so scalping or day trading could be for you.
Lifestyle: So you may not have the time to always watch the market and how it's moving, so scalping and day trading are not for you, but for swing trading, u only have to check the market once a day so it's the better option for you.
Don’t feel like you need to decide what type of trader you are, you should try all of them and see for yourself what are you comfortable with after all there is no right answer.
I hope that I was able to help you understand The Different Types of Traders better and if you have any more questions don't hesitate to ask.
Hit that like if you found this helpful and check out my other video about the Moving Average, Stochastic oscillator, The Dow Jones Theory, How To Trade Breakouts, The RSI, The MACD, and The Bollinger Bands, links will be bellow


ALGOUSDTLets do the first prediction!
I believe in time retracement, cause of chart moves by 2 obvious parameters.
Price touch the pick in 155days and retrace for 82 days. This means that by the lower time, price could retrace and make another bottom. But that is not all things that we have see.
Price retrace more than 78% of it self.
If we wanna have a conclusion by these retrace, we have to say that the power of sellers are more than buyers and every rise of price is a chance for sell position.
Support us by like and follow if you liked our posts.


Descending triangle Maybe?Waiting for this to drop around 142.567 to buy the descending triangle that seems to be forming.
Entry 142.567
TP:142.847
Quote of the day:"Patience is not simply the ability to wait - it's how we behave while we're waiting."
Trader Essentials from Amazon
1. amzn.to -Tylenol Extra Strength Rapid Release (LOL)
2. amzn.to -Encyclopedia of Chart Patterns
3. amzn.to -Apple MacBook Pro
4. amzn.to -OLLY Goodbye Stress Gummy,


FTR AUD ShortMultiple entry points on audusd this morning with the fail to return candle stick pattern (highlighted in yellow circle)
Nice downward momentum coming off a double top paired with dollar push today

XRP/USD Buy Target - TradersmindXRPUSD
• Fibo confirmation (Green zone)
• Lower High confirmation
• TP 1 = -27.2% and TP 2 = -61.8%
Good luck, and Have a great trade everyone :)
@tradersmind

Best Buy Zone for TRX/USD - Tradersmind• Black line = D1 S/R ; Lime line = H4 S/R ( Minor )/
• Buy on our Fib 50% - 78.6% zone, REMEMBER Buy after candlestick confirmation !
• This will be 'LONG' investment
Have a great trade & Have a nice day
@tradersmind

ETH/USD Best Buy Zone - Tradersmind• Double bottom confirm %78.6 fib (green zone)
• BUY after price confirmation / Pull-back or candle don't break
Have a great trade & Have a nice day
@tradersmind

BTC/USD Perspective D1• 78.6% touched (green zone)
• 78.6% break will lead BTC/USD to $7500 -> $5800 area (blue zone)
• IF the candle bounce up, our nearest target will be $10 942 and $12 661
Have a great trade & Have a nice day everyone
@tradersmind

ETC/BTC Perspective H4ETC/BTC time to buy,
Fibo touch 78.6% technically this is the best price for entry ETC/BTC
use TP 1 = last high (fib 0%) and TP 2 = -27.2%
Have a great trade and Have a nice day

BTCUSD Perspective H4• Descending TL break & Fib 50% = UPtrend start (new rally)
• 78.6% break = say hi to $8800-$9400 zone support
Have a great trade & Have a nice day !
@tradersmind

XLM/BTC Perspective H4Ideas as shown
• Buy between fib 50% - 78.6% and use the TP target fib 0% - (-27.2%) - (-61.8%)
Have a great trade and Have a nice day
@tradermind

XRP/BTC H4 Perspective• Ripple's price dip down to confusion of korean government plans for ban crypto or not. (techically the price slump down because of the retracement).
• Long entries base on H4 S/R (yellow zone) and D1 Support (Blue Zone)
• Whether the price will bounce from H4 or D1 zone, we will doing this entry and take the chance
• Descending TL break will lead the price to 0.00021 again
• Overall my bias : LONG
Have a great trade & Have a nice day

ETCBTC D1 Perspective• Double Bot yellow box.
• Higher Low perform
• Fibo entry zone touch 50% - 78.6%
• descending TL break will leads the price to 0% and -27.2% as our Target point.
My bias : LONG
Have a great day & trades everyone !
@tradersmind
