Higher low formation in LT Stock can show move if it break 2137, target can be 2163
And if breaks below 2106 than it can again go to 2086
Tradesetup

CATCH THE NEXT SWING ON GBPUSD HEY TRADERS:
In this analysis for GBPUSD, we see price approaching the third touch
which has the highest possible reversal, take note two touches is also valid for a setup completion.
my expectation for now i need to see likely a third touch to the double top line
or a bearish impulse reversal (shift in momentum) a break of trendline followed by a bearish continuation correction
thanks for reading
TRADE SAFE AND STAY SAFE USE A PROPER RISK MANAGEMENT

EUR/USD - Bearish PennantA bearish pennant is forming at 15min time frame after we saw EUR/USD drop yesterday nearly 1% after rallying to the 1.09000 resistance level, Can it go back to below 1.06000 where it was a week ago and then eventually reaching the support level near 1.05500 - 1.05000.

$BTC - Are you ready? $BTC - Are you ready?
BTC is breaking out! Let's see if we stay elevated at these levels we could be going back towards 30k areas!
However, 20k & 25k are key resistance area. Pattern wise we are bullish as long as we are above 18.5k
Enjoy,
Trade Journal

📉Bitcoin scenarios/up or down?📈BINANCE:BTCUSDT
COINBASE:BTCUSD
Bitcoin analytical series S01E08
Hello traders, don't forget to risk-free your positions.
Long targets ----> Green lines.
Short targets ----> red line & yellow lines.
Please share ideas and leave a comment,
Let me know what's your idea.
CrazyS✌

We now wait for NFP!We now wait for the NFP!
Here we have the silver chart in-front of us!
We are currently within the range of lows: 19.800 highs: 20.450, Pattern: Triangle/ Bear flag
If we are to go above key resistance area and above 50EMA + TL resistance I expect first target to be 20.750 areas and then 200 EMA areas which is around next resistance zone of 21.400. However, we are to decline with a strong NFP, I expect 19.500/400 to be your target areas.
Regarding NFP checking the other data as well, see the differential of it and is it at a vast numeric change.
Trade Journal

My current BTC/USD swing trade Idea.
BTC most of the pas month consolidated, took out Nov 2020 Sellside. its 50/50 at the moment, got to see what M candle does when closing. Neutral for now.

DON'T MISS THE NEXT PHASE ON NZDCADHey everyone,
In this analysis, my bias is still valid to catch another swing up (buys). We need more bullish continuation correction.
WHAT AM I EXPECTING?
Bullish rally
HOW DO WE ENTER:
risky entry on a rejection candle.
Reduce entry on a break of trendline with a bullish sharp impulse.
TRADE INVALIDATION:
A bearish impulse followed by a bearish continuation correction
Thanks for reading
AS ALWAYS TRADE SAFE AND STAY SAFE!!!

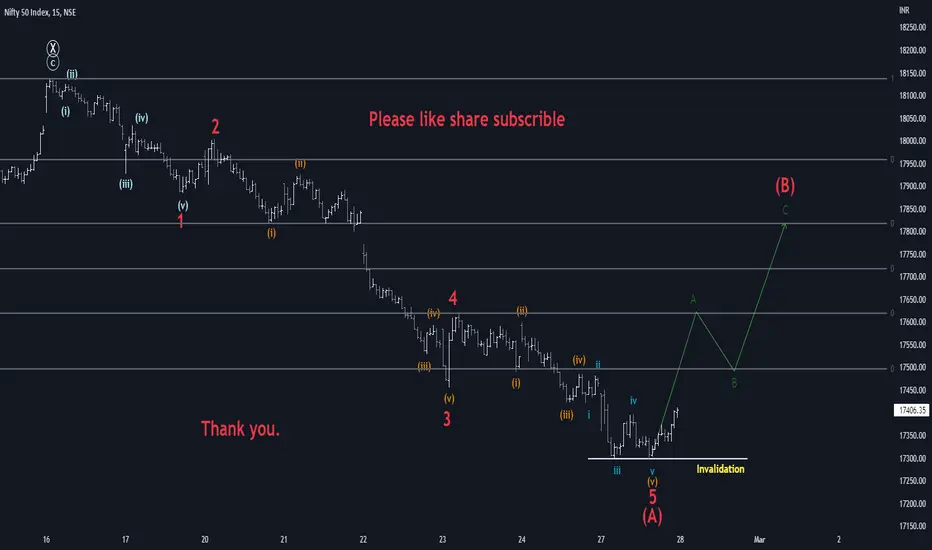
NIFTY 50 Elliott wave viewHey guys ...!
Today have counted NIFTY waves from the top of 18137 recent high.
The waves of different degrees are labled on the chart.
The video is on you tube for your reference.
pls like share and subscribe.
Thank you.
Keep your eye on invalidation level also.
EURUSD EURUSD
It is so clean! These are my favourite kind of set ups, it has been a choppy week but you wait till next week V day! We in for big treat CPI For US! Now Jobs have been great all is well in US it seems, lets see if this continues!
Technically if we go below 50 EMA expect 200 EMA as your TP - I am short it's a positive swap as well - that's another great thing about holding euro short.
Highs: 1.08180
Lows: 1.06680
Break of lows: 1.05470 target areas
Break of highs: 1.09190 target areas
It's really as simple as that, there's two ways you can play this put a small % position in and let it run, add alerts in and orders! Whatever suits your trading plan.
Have a great weekend
Trade Journal - There will be a FX week ahead video coming out this week!! Stay tuned.

BTC potential downside after liquidity grabBINANCE:BTCUSDT
Create FOMO of bull market, trap traders
liquidity grab then a push downwards.

Bitcoin Fib Levels and Prediction📰 Bitcoin played out like we expected, heading up to point (A). It did pump more than we thought it would though. Now it has retraced back down to a
settling level we like.
📉 From here we feel a drop back down to the golden pocket is more likely, than a pop back up to near 25k.
📥 We have entered a SHORT at $24,630 BTC

GBPUSDGBPUSD
We do have BOE..We are currently stuck within range of H: 1.24435 L: 1.22610. It's a break to either direction if we break the lows then I do expect 1.21440 areas. A break above the highs of range I expect 1.26350.
It's a wait and see with GBP but I feel most of the time these are the best set ups a break out checking if its a clean close etc. Based on whatever rules you have within your own trade plan.
Trade Journal

GBPNZD GBPNZD - Just an idea!
Technical view:
Beautiful channel/ Trendline down now concentrate on that. Now yes could be pattern wise a cup & handle pattern - but it hasn't broken out yet ... Look at the price and the wicks of the candles on knowing who's in control. Above and out of this channel bulls can gain control towards 200 EMA. However, if we break below the range we are in expect us to retest the recent lows of 1.89250/100 areas.
Keep it as simple as possible with the great R/R trade ideas.
Key tip: Don't forget to follow your own trade plan that's what really matters.
Have a great day ahead,
Trade Journal

Bitcoin Hammers ceremony in 4HHi friends.
I see about 4 hammers on a strength Trendline and i think price
will go to the upper band i have shown on my chart.
If the price surpass this 24000 resistance level
after a pullback to this level , we will see a huge increase in BTC in coming days.
Dont forget we are in a 4H time frame and this trendline is very important.
In addition this hammers shape in an important support level (22500) too.
after price reach this path i draw in my chart we should look it again to update our
analysis.
so if you enter a trade dont forget to set your SL below this support level and choose the upper
line for your TP.(I show it on my chart and its R/R is 2.6 its good i think! )
Hope you enjoy this analysis.
share me your opinion
I will be happy.
Thanks for reading my idea
Love you all

EURUSD Possible TradesGoodday traders,
Price showed me strong Bearish momentum last week.
Im looking for price to retrace in the beginning off the week to fill more Shorts mid term.
For today if price retraces in the NY session i will be looking for a possible Long to take out BSL.
The Long POI is under a current bullish swing, so im expecting people that are long to place there SL under the structure,
and with it a chance for the market to take out the buy stops and new people trying to long on a obvious zone.
Note that it can also hold the bullish swing and continue higher from there.
The zone im playing my longs is untested 5min imbalance,
creating a probability that there would be still long orders waiting to be filled.
I will watch price for potential short entries if it will reach the short OB above.
Can be a setup for tomorrow.
No financial advice.
Dave


Will the $TNX find some support at these higher yields?$TNX :: 10-year treasury looks like it could potentially sustain at this level for some time and potentially continue it's grind higher. The macro environment is looking increasingly bearish for stocks as the days go by.

us30 quick short I just want to get a small short noting its hitting a support zone a marked, I feel like it may go down at least half way to fill out that gap by the big candle stick

AUDUSD buy zoneBuy option with 80% probability of a rebound to the price zone 0.6920/00. Based on Supply and Demand daily and h4 tf zones. In addition, the price will be based on up trendline and Weekly camarilla pivots. I don't think this place will be a trend change point, but more like a rebound where you can earn around 100 pips. I will be buying, when the price enters the zone.

GBPNZD - Just an idea!GBPNZD - Just an idea!
It's a break above 200 EMA expect 1.618 as target areas!
It's important this week regarding fundamentals to take into consideration as we have many CB's!
If we stay above these levels, the bulls are in control. However, if we were to break below the areas of 1.90400 areas then bears may gain control.
Key tip: Most of the time, it's really best to ignore the noise.
Have a great week ahead,
Trade Journal

QQQ Cup & Handle Set-UpQQQ looks bullish, classic C&H on micro time frame - Volume matches pattern
4:1 Profit potential. TQQQ for 3xLeverage= 18%-20% possible profit / 4-5% possible losses
***Be Careful -Negative CPI data on Thursday will cancel any bullish moves - lots of volatility & market manipulation to finish this week
Everyone is so Bearish right now.. this is the contrarian move... watch out for the composite man or woman
Proper entry: wait for break above resistance with large buying volume - *set your stop losses
