Bitcoin Scalping Signal for Day Trading🖥️ We have determined there is a 70% chance Bitcoin will Fall from our current entry point.
📉 SHORT BTC - Entry Price : $23,825 📉
💵 Length of trade: we are expecting BTC to hit a $200 scalp, with a high end of $700 and a minimum expectation of $125.
We Think there might be a Bounce at $23,650.
🕰️ Duration of trade: we are expecting this to occur within 2 hours of this signal, with a maximum duration of 7.5 hours .
we feel this trade could be a quick drop down, then retrace , so set take profits.
❗📰📈 Bitcoin Hit 23,000 on BitMex Friday, and only on BitMex. This might be a premonition for what could happen today, be mindful of this.
Tradesetups

Week 1 Win Loss Breakdown for all SignalsThis is a breakdown of our Signals from week 1.
We produced 10 Signals (All Profitable) , 3 Late Entries (2 Profitable, 1 Loss), and 1 Opinion Piece

Bitcoin Scalping Signal for Day Trading🖥️ We have determined there is a 65% chance Bitcoin will Fall from our current entry point.
📉 SHORT BTC - Entry Price : $23,900 📉
💵 Length of trade: we are expecting BTC to hit a $250 scalp, with a high end of $500, and a minimum expectation of $150.
🕰️ Duration of trade: we are expecting this to occur within 5 hours of this signal, with a maximum duration of 9 hours - this might be a longer
occurring trade.
📊📈 IF European 🌍 and Asian 🌏 Markets Come out Strong; it might Cancel out this Scalp

Bitcoin Scalping Signal for Day Trading🖥️ We have determined there is a 65% chance Bitcoin will Fall from our current entry point.
📉 Short BTC - Entry Price : $22,775 📉
💵 Length of trade: we are expecting BTC to hit a $250 scalp, with a high end of $600, and a minimum expectation of $175. We Feel it have a strong chance to Re-Test 22k
🕰️ Duration of trade: we are expecting the minimum target to occur within 2.5 hours, with a maximum duration of 7.5 hours .

GBPUSD Impasse. Since last week Thursday, we've seen a total fall in Bullish momentum for the USD. This has given rise to a quick recovery for the GBP. Also in addition to recent Fundamentals, the GBP hold a stronger position against the USD. But GBP will have to break through the 1.2040 resistance area to make a confident bullish run.

Daily analysis and trade setups on NASDAQ 20220719Blue levels C, D, E in play today
#GandalfLine 12230
Buy zones: 11990, 11925, 11680, 11570
Sell zones: 12060, 12100, 12170, 12230

SOS Great buying oppurtuintysos looks to be giving one of the best buying opportunity atm
if we break the down trend and hit the first target you could make a great return

lINK FALLING WEDGELINK is looking great down here to accumulate
great risk reward here and could see a big move up soon

Accumalate ltcltc is looking great down here to accumulate
great risk reward here and could see a big move up soon

iota looking good hereiota looking like its found support here
accumalating iota while we are down here
could see a nice move up soon

NEO looking greataccumalating neo at these levels, great risk reward here
could see a big move up soon

Fil 2 week OutlookHello traders,
Here is a chart on FIl, Possibly one you have yet to see with such old price action. Yet, this as all the rest of the charts become very clear once you zoom out.
Green lines below are supports and areas of interest for buying opportunities. I have changed the support below to pink that we do not want to see the price cross below.
Red ray lines above are resistance and the white lines are targets for price action if the price breaks above the white trend lines holding the price action currently.
Savvy

xlm looking goodaccumalating xlm down here
looking good if we can break the down trend could see a big move up

Swing & positional trading opportunities for next week (4th Apr)During the week ending 1-4-22, Nifty hit a high of 17703 which is a great recovery from the lows of 15671 hit in the month of March 2022. A 1,000+ points recovery within a short period of time indicates that the overall market sentiment is bullish and should the global situations improve, Nifty may well be on its way to cross to 18000 and thereafter the retest of 18604 which is the All Time High.
This may sound simple and easy and it may well end up being so if the FIIs keep ending each day as the Net Buyers. The recent recovery has been possible only account of either FIIs not selling as aggressively as before or they ending the day as Net Buyers.
For now, the indices look good for creating long positions. However, on a sector or a stock level, the situation may be quite different as the risk-reward that was quite favorable when Nifty was below 17000 and even 16000 is no longer going to be as painful as it was.

Bitcoin is this the moment we have been waiting for?Hello Traders,
As we all have been waiting amongst bearish news upon bearish news, we can see that the structure of bitcoin has been showing some bullish signs. After many Alt coins have jumped some points it is more likely than not that bitcoin will follow shortly behind. If you look at BTC.D you will see that it is falling and makes a lot of sense that the alts are running as bitcoin is still in a sideways range.
So lets dig into the chart, the first area that will need to be beat is between $44,462 and $46,220, if this is won by the bulls here will most likely come and retest this same area as support. After testing this area I would expect a bullish movement up to the $54k area. If in fact we have a pullback to the lower range of the ascending triangle we seem to be in there is always the possibility that we head down and need to always have a plan for either way regardless of the likely scenario being an upward move. As you can see on the chart I have put these three likely scenarios here drawn out. The main bullish factor I have been looking at which I did not place on this chart as to give you all a better look at the structure is the impending MACD indicator cross up and major bullish news starting to come in across the board for the whole space.
I hope this has helped identify some areas and you like the idea. Feel free to leave questions and comments below!
Have a green week folks!
Tell me what you think about some of the private ideas I have linked below.
Savvy

usd/cad shortlooking for usd/cad to continue this down trend to Previous low as i also wouldnt be surprised if we create a Lower low here as well
Diclaimer -information shared is for educational purposes and demo purposes only!

USDJPY SHORT (3000 pips move).HELLOOOO PIPPIN PEEPS!!! I'm back with another high probability trade. Looking at around 3000 pips. Trade with care. Risk management is KEY.

Monero (XMR) Does history really repeat itself?Hello Traders,
Today we are analyzing Monero . After doing a deep dive and zooming in and our of different time resolutions I have found some very interesting similarities to the previous run on XMR. The First point to note is the bottom of each run seemed end in a similar way to each other. Some what of a cup and handle pattern on the monthly time frame pictured here by the green paint brush stoke at the bottom of each run. The Second run obviously endured the Black Swan Event of Covid shooting a wick to lower levels and adding tons of fiat injected into the economy driving the prices back up quicker yet, the structure stayed very similar. After the neckline of this structure was broken we went on a parabolic run in both instances as well. Only pulling back to test the top of the prior structure neckline.
So this leads us to the current situation that we are in now here. The price action has broken the neckline once again and being powered by Fiat injection has made a few different moves yet again, still echoing the past run. Now that the price is heading back down toward the neckline I see a possible two scenarios coming into play as you can see by the green and red arrows that I have placed on the chart. Regardless of which plays out, looking at this has made me gain some confidence on the next few moves I am deciding to make. I hope this research I have done helps you do the same. Keep in mind it is important for you to do your own research as well as I am not a financial advisor and these are just my own opinions based on my research.
I hope you all have a green week and I will see you next analysis!
Savvy

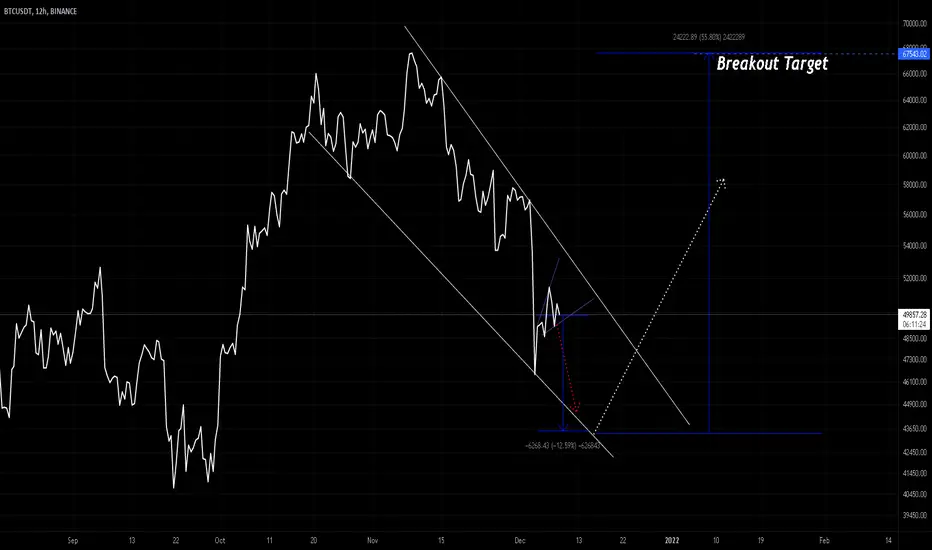
Thoughts on Bitcoin's likely direction (down then up)
Looking at Bitcoin currently, we can see a local ascending broadening wedge after that recent downswing. This is pointing to some further downside to complete a likely falling wedge on the 12hr chart.
Likely scenario we see play out is downside to test ~43.5k then start a rally around Christmas'-NewYears towards 68k to try and set a new ATH
See previous Ideas posted on Bitcoin for further thoughts & breakdowns on BTC & it's future PA.
Likely 10% down followed by a slow 50+% move, will update as PA is available.
INDEX:ETHUSD COINBASE:ETHUSD BINANCE:ETHUSD BINANCE:ETHBTC COINBASE:ETHBTC INDEX:BTCUSD BITSTAMP:BTCUSD COINBASE:BTCUSD BINANCE:BTCUSD BINANCE:BTCUSDT COINBASE:BTCUSDT
Blackrock at key supportAs you can see, the price has respected the 200sma (blue) since the break from Covid lows.
Risk-reward-ratio presented is interesting as you will figure out if you are right or wrong pretty quickly; especially since the Bollinger bands have been contracting as we have consolidated.
Trade setup:
Target around $1000 for profit-exit.
Loss-protection exit 1-2% under the 200sma.
Fundamental Analysis '
- The $TNX (interest rates) has broken out which is positive for financial institutions.
- There is a cyclical tilt to the market as high valuation companies in the technology sector are hit hard.
* Note: Earnings are starting at the end of next week for the financial sector.

Luna 15mn Reviewif its break the box as a support and resistance and conform a second candle above it or below it then Enter LONG/Short... Happy Trading Guys...

BTC targets and potential pullback areas. Hello Traders,
Here is my quick idea on Bitcoin. I see BTC in a bullish pattern, a falling wedge which it has broken out of and retested the top on a daily time resolution. The other targets are based on a flag pattern and a cup and handle that BTC has potentially presented.
Again, just a quick idea that I saw and wanted to throw out there.
Have a GREEN week folks!
SAVVY

USD/JPY Short Analysis 11/25/21 In this analysis I look at the US dollar against the Japanese Yen. Currently I have a bullish bias on this pair and we have also seen a recent low for the USD against the JPY which means it is key time for buying in. We see a key retracement period going on currently meaning price will fall to the liquidity area I have marked on the chart then will most likely print bullish candles. . Using them in confluence is a visual aid for people that have a hard time grasping certain concepts.
