ETH USDT: Buy Trade setup @ 3150Hello everyone, hope you are doing well.
Welcome to another trade setup as a part of "Aglogains - Daily Trade Series".
On the 1H timeframe we also see a three wick rejection, the price tried to break bellow 3090 3 times and failed to sustain the move.
My entry is on the 1H timeframe, after I observed a double bottom with a bullish confirmation.
Entry - 3150
Stop-loss - 3090 (60 points)
Take profit - 3230 (80 points)
1:1.33 RISK TO REWARD
Will keep you posted on the progress. Happy trading.
Tradesetups


AUDUSD > Support and Resistance > GO UP!Hi friends,
We are having an amazing trading week.
This is my analysis on AUDUSD.

EBAY - 14.18% Potential ProfitGood risk / reward ratio on this trade.
Ascending Triangle breakout.
Betting on momentum to keep going past the news release of eBay releasing Bag Autenthicating service that could help the marketplace to tap into the second-hand luxury industry.
- Target Entry: $65.51
- Target Stop Loss: $63.81
- Target Exit: $75.08
- Risk / Reward Ratio: 5.63
About me
- Note that I tend to adjust stop losses in order to secure profits early and preserve capital. This means that the target price is going to be achieved as long as there are no strong pullbacks that trigger my new adjusted stop loss
- When I see that the market is opening too high/low, I wait for 30 min from the opening bell before placing my order. This is to avoid that initial spikes / drops get me into a position and get me out right after.

Trade Set up Tomorrow's market could be sideways, you can do scalp for quick gains in conditions as described below:
1) Go short if the market opens flat or a little gap down and trendline breaks and gives 15 min closing below 33838.35.. Keep a target of 150 points from the level. It can go up to 33506 but that target is most probably against the psychology of the market. Hence saying to book early.
2) Go long if 15 min candle closes above the trendline and again takes support on it otherwise it will be a fake breakout, in case of taking support at the trendline after breakout take half of the quantity in your appetite and add more if 30 min candle closes above 34142.85. Keep a target of 34287 then 34360 then 34760.
In case of huge gap up or down-sell calls and put as per the levels marked.

CVS - 6.18% Profit Potential - Ascending TriangleCareful - I will wait for earnings before placing this order.
Ascending Triangle formed after a 6-month correction and a recent run. Betting on last month's momentum run.
Good risk-reward ratio and target set at a potential formation of a 6-month resistance line.
- Target Entry: $77.80
- Target Stop Loss: $75.91
- Target Exit: $82.51
- Risk / Reward Ratio: 2.49
About me
- Note that I tend to adjust stop losses in order to secure profits early and preserve capital. This means that the target price is going to be achieved as long as there are no strong pullbacks that trigger my new adjusted stop loss

EWC - 6.17% Profit Potential Swing Trade Setup - PennantBullish Pennant formed after a steady bull run.
I have not identified a clear technical target, however, I love the risk/reward ratio on this trade and I still feel this is an opportunity to pursue.
- Target Entry: $36.83
- Target Stop Loss: $36.50
- Target Exit: $39.00
- Risk / Reward Ratio: 6.58
About me
- Note that I tend to adjust stop losses in order to secure profits early and preserve capital. This means that the target price is going to be achieved as long as there are no strong pullbacks that trigger my new adjusted stop loss

DFEN - 14.69% Profit Potential Swing Trade Setup - TriangleAscending Triangle formed after a period of correction. The run should resume and price to hit the resistance line.
Keeping the Stop Loss very tight. Consider lowering it to $22.81 if you don't have much risk exposure in your current trading portfolio.
- Target Entry: $23.50
- Target Stop Loss: $23.20
- Target Exit: $26.90
- Risk / Reward Ratio: 11.33
About me
- Note that I tend to adjust stop losses in order to secure profits early and preserve capital. This means that the target price is going to be achieved as long as there are no strong pullbacks that trigger my new adjusted stop loss

NTR - 7.85% Profit Potential - Ascending TriangleNTR is a fairly volatile stock. Keep this in mind when you trade it. The risk can be higher.
While an Ascending Triangle has clearly formed, the price hasn't confirmed the support line yet. However, the risk exposure is minimal and it might be worth a shot.
- Target Entry: $59.11
- Target Stop Loss: $58.18
- Target Exit: $63.66
- Risk / Reward Ratio: 4.89
About me
- Note that I tend to adjust stop losses in order to secure profits early and preserve capital. This means that the target price is going to be achieved as long as there are no strong pullbacks that trigger my new adjusted stop loss

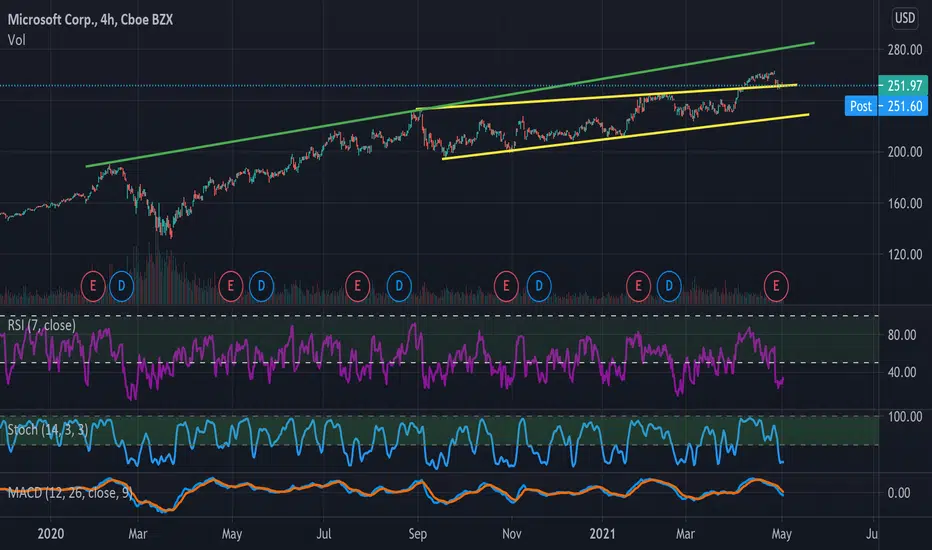
MSFT - 10.43% Profit Potential - Bullish PennantBullish Pennant formed after a modest 9-month rally.
Great risk-reward ratio and target set at a potential formation of a 1-year resistance line.
- Target Entry $252.04
- Target Stop Loss $246.36
- Target Exit 279.40
About me
- Note that I tend to adjust stop losses in order to secure profits early and preserve capital. This means that the target price is going to be achieved as long as there are no strong pullbacks that trigger my new adjusted stop loss
BK - 7.90% Potential Profit - Bullish PennantThe level of confidence in this trade is moderate. While I like this setup, I am not fully convinced about the target price.
Bullish pennant formed after a 6-month bull run, betting on momentum keeping going.
- Target Entry: $50.32
- Target Stop Loss: $49.34
- Target Exit: $54.22
- Risk / Reward Ratio: 3.98
About me
- Note that I tend to adjust stop losses in order to secure profits early and preserve capital. This means that the target price is going to be achieved as long as there are no strong pullbacks that trigger my new adjusted stop loss

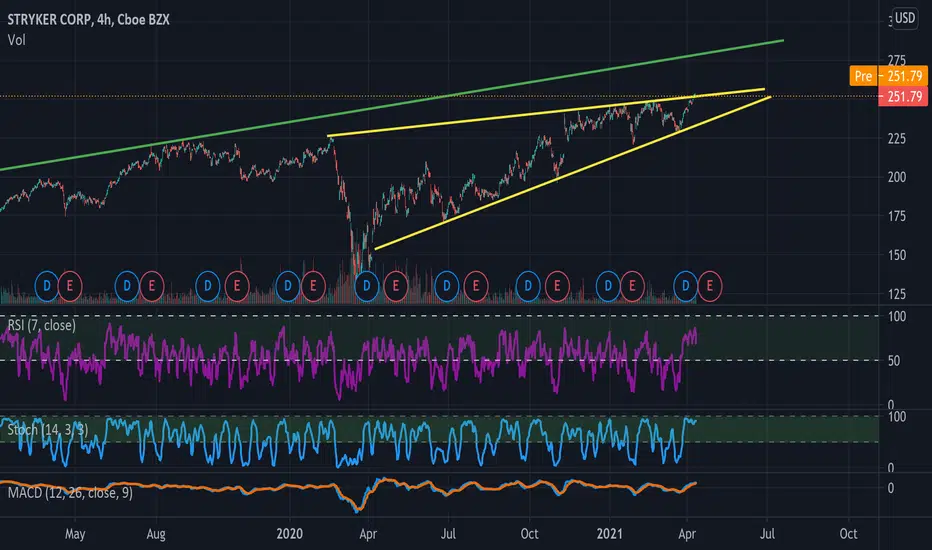
SYK - 8.74% Profit Potential - Bullish PennantBullish Pennant formed on a 1-year bull run.
Great risk-reward ratio and target set at a potential formation of a 3-year resistance line.
- Target Entry $251.97
- Target Stop Loss $246.26
- Target Exit $280.85
About me
- Note that I tend to adjust stop losses in order to secure profits early and preserve capital. This means that the target price is going to be achieved as long as there are no strong pullbacks that trigger my new adjusted stop loss
GBPUSD BuyReverse Head and Shoulders formation on GBPUSD. I expect a Bullish Continuation till the 1.4200 level

Amazon Is replacing The Amazon *LongAmazon prints a fresh ATH and making HL , Trading within a Nice channel that has been respected since July 2020.....3 time we have rejected a breakout opportunity which was anticipated .
I see Amazon breaking ATH over the course of the coming months when earnings are announced 29 April ...approximately 77 days time .... Amazon has smashed the past 3 estimates obviously due to the Virus and Lockdowns etc and i anticipate that Amazon does it again in the coming few months ....for entry i have Highlighted the orange box which should act as a strong support and a nice entry .

View37081.60 is the level. Sustaining below it will cause 300-400 point downward movement. Keep eye on 36900 pe 18 Feb or safe can short future'.

USDCAD Critical Pointin this instrument we are having 2 scenarios
1. Long which we can target our bearish's wave Fibonacci retracement levels as we can see there exist a bullish divergence between price and MACD (Green), we have a resistance zone too, which we can have some consolidation or a sharp break trough...
2. Short scenario is also very much possible as we are in a bearish channel so we can have the same trend continued up to our previous support levels
or
we can have both
first short to the support and then long up to the Ultimate long TP
please let us know how do you think it may happen???

View32629 is now support ..if price sustains above . Day high will be broken . You can buy future for 100- 150 points upmove . Safe can sell otm puts .

FAST - 5.14% Potential Profit - Ascending Triangle BreakoutAscending Triangle formed after a 3-month correction. Multiple new support confirmation over the past 4 days.
I am fairly optimistic on this trade, as I particularly like the chart and the risk/reward ratio. This means that I will allocate more capital than usual. We have a target price, however, I wouldn't be surprised if it would go above that.
- Target Entry $50.53
- Target Stop Loss $49.93
- Target Exit $53.00
About me
- P/L Oct-Dec Trading Suspended | September +49.18% | August +232.32% | No Trades without Analysis
- Note that I tend to adjust stop losses in order to secure profits early and preserve capital. This means that the target price is going to be achieved as long as there are no strong pullbacks that trigger my new adjusted stop loss

HOLX - 18.87% Potential Profit - Bullish PennantBullish Pennant formed after a 9-month run. Multiple new support confirmation over the past few days.
I am being quite conservative with the Stop Loss. You can place it to $76.59 if your appetite for risk is higher.
- Target Entry $80.50
- Target Stop Loss $79.22
- Target Exit $94.00
About me
- P/L September +49.18% | August: +232.32% | No Trades without Analysis
- Note that I tend to adjust stop losses in order to secure profits early and preserve capital. This means that the target price is going to be achieved as long as there are no strong pullbacks that trigger my new adjusted stop loss

ETH Potential Trade Setups 2020/12/21Daily ETH Potential Trade Setups
There are two potential trade setups that could develop and we can wait patiently to see if either setup gives us a good trade entry
Scenario 1: False Breakdown at Horizontal Support
In this first scenario, we are waiting for price to hit the horizontal support @621. We will be looking for price to close below 621 and then quickly recover above 621, creating a bear trap and a false breakdown setup. As confirmation, we want to see above average volume, especially for the candle that closes back above 621. We will also want to see MACD histogram bottoming out for us to open a long position.Should price crash below 621, be careful that markets might correct further downward and best to stay on the sidelines until markets stabilize.
Scenario 2: False Breakout at Horizontal Resistance
The second trade setup that we are waiting for is for price to go up to the horizontal resistance at 676 and for a false breakout setup. This setup is characterized by price making a higher high than 676, ideally closing beyond 676 and then followed by price closing below 676, ideally in the candle following the close above 676. As confirmation, we want to see above average volume, especially for the candle closing back below 676. We will also want to see MACD histogram topping out for us to open a short position.
Please follow for daily trading levels and potential trade setups on Bitcoin and Ethereum .

BTC Potential Trade Setups 2020/12/21Daily BTC Potential Trade Setups
Bitcoin has been trading in a range for quite some time. While there is a possibility of Bitcoin breaking out of this range and therefore making a powerful move, in this post I will be highlighting two potential trade setups should Bitcoin stay range-bound.
Scenario 1: Bounce off of Dynamic 200MAs Support
In this first scenario, we are waiting for price to hit the dynamic support found at the 200MAs @ 23500. We will be looking for bullish candlestick pattern and higher than average volume, as well as MACD histogram bottoming for confirmation before opening up a long position. Should price crash below 23500, be careful that markets might correct further downward and best to stay on the sidelines until markets stabilize.
Scenario 2: False breakout of All-time-high and breakdown
The second trade setup that we are waiting for is for price to go up to the ATH of 24300 and for a false breakout setup. This setup is characterized by price making a higher high than 24300, ideally closing beyond 24300 and then followed by price closing below 24300, ideally in the candle following the close above 24300. As confirmation, we want to see above average volume, especially for volume on the breakdown candle (the candle that closes down below 24300) to be above average. We will also want to see MACD histogram topping out for us to open a short position.
Scenario #3: Breakout
While not the 2 main setups highlighted on this chart, should price break 24300 with force, we can also wait for price to retrace back down to 24300 to open a long position, with volume, MACD histogram, and candlestick pattern confirmation.
Please follow for daily trading levels and potential trade setups on Bitcoin and Ethereum.

VIEWIf 15 min closes above 1487.90. go long for a target of 1500 at least and trail rest for 1510 -1520.

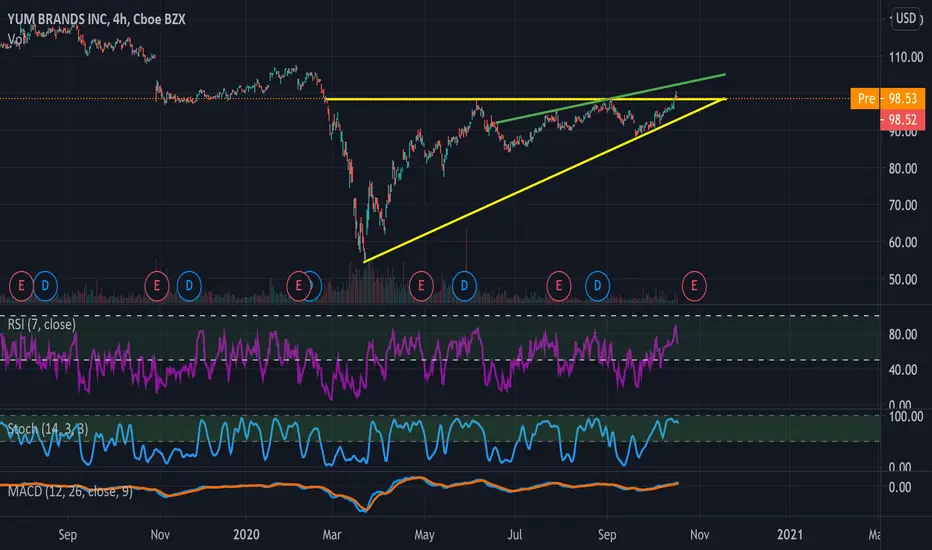
YUM - 4.02% Potential Profit - Ascending TriangleAscending triangle formed after a 5-month correction. Multiple new support confirmation over the past few days.
There is a potential to aim March's high and target a $105 price mark. However, not before we break past our original target exit below.
Despite profit potential might not seem appealing, I still feel that the risk/reward ratio is acceptable. Needless to say that the price will highly be influenced by vaccine-related news, given YUM's industry.
- Target Entry $98.79
- Target Stop Loss $97.67
- Target Exit $102.90
About me
- P/L September +49.18% | August: +232.32% | No Trades without Analysis
- Note that I tend to adjust stop losses in order to secure profits early and preserve capital. This means that the target price is going to be achieved as long as there are no strong pullbacks that trigger my new adjusted stop loss