Short Movement Expected on FTSE China A504H CHART EXPLANATION:
The Ascending Trendline has been broken after the failed breakout of the Daily Triangle. As we explained on the Daily Chart below, the targets are the Bottom of the Triangle and the Support Zone at 12000, however, we need to be careful with the middle support zone at 13350.
DAILY CHART:
Tradewar

ORBEX: DXY, SXP Affected by US-Sino TradeWar ReescalationIn today's #marketinsights video recording I analyse the US Index and S&P 500
What affects #DXY and #SPX:
- China cancels a visit to US farms
- Trump says no need for trade deal before 2020 elections, in response to Chinese cancelation
- US President also says won't do a partial deal, only complete deal
- Fed rate cut
- Dovish banks
Stavros Tousios
Head of Investment Research
Orbex
This analysis is provided as general market commentary and does not constitute investment advice

All clear for bulls or Bull trap. OANDA:XAUUSD has broken out of the minor triangle. I will await for a possible retest of the broken trendline. Also the Major LT trendline in green can provide major support for OANDA:XAUUSD . Trade tensions boosted the Yellow metal the past Friday. This week will provide a clear picture of where we are heading.

Gold and U-form in a BULL run !Gold is defenitely in a bull run but we're coming in a rejection place where there can be a up and down side between 1479 and around 1459 per ounce. I can see that trade war tensions isn't yet over and rise up gold to a new high.
The American Fed is now pomping money and Trump send some monetary troops to Saudia.
It's possible that American Fed could buy big Gold because they printed a lot of money and that would be a trigger.
Let's have the best week and month for our investors and traders.

S&P 500 - SELL Hello Traders,
The S&P 500 has retested a broken wedge formation, there is also a head and shoulders formation, if this plays out there could be a significant drop coming for the US index. Generally speaking the head and shoulders formation will break lower than the neck line.
China has just cancelled a meeting with US farmers suggesting a trade war deal is further away than firstly anticipated.
Recession indicators are flashing red, the only thing holding the index higher is the FED rate cut last week.
We will see how this develops over the coming days.
Give the set up a like and let us know your thoughts below!
www.forexstoreau.com

GOLD: Sell Idea !?Any Optimistic news about U.S-China trade war and the price goes down and if it happens, then the bottom line of the channel will be broken. Any short position should set below the bottom line (which is the neckline of head & shoulder pattern also ) .........................................................................
GOLD : Sell Stop
Entry: 1485 / Stop Loss: 1510 / Take Profit: 1440
(Follow us -----> Instagram: @forexcamp Telegram: @forex_camp )

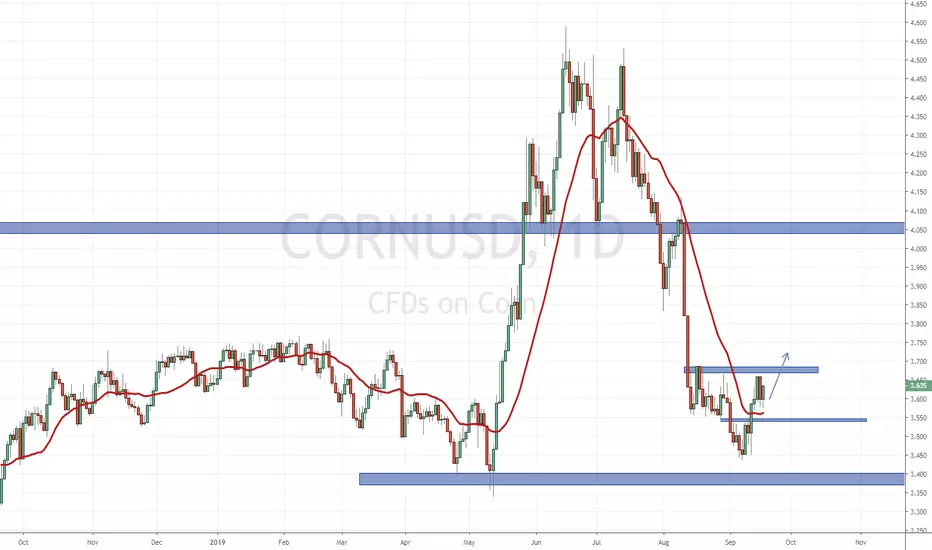
Corn to make a Head and Shoulders Pattern? Bullish Agriculture!I have been trading the agricultural commodities much more lately. On a long term approach (investing) I am bullish agricultural because I see food supplies diminishing due to weather. Just this Spring and Summer, crop yields did not produce as much as before and according to information on Martin Armstrong's blog, farmers planted crops late in the East due to a lingering winter. I expect these weather uncertainties to keep occurring.
Soil in the west is also diminishing. This can easily be remedied through things such as Zinc and other things like phosphate etc but don't want to get too scientific here.
What this means is that in the future we will likely transition to indoor/greenhouse farming.
Another bullish aspect is China. If you follow my work, I have said the only reason China would come to make a trade deal/truce is if their credit problem worsens, and if their food issue worsens. China has been hit hard with the swine flu and the army virus and the government is subsidizing food prices, especially pork. This could be a more short term/intermediate term catalyst.
Onto the charts. A good confluence for Corn. We hit a major support/flip zone at around the 3.45 zone.
You can see the downtrend with its lower highs and lower lows. They are well defined. Remember, by definition once a lower high swing is broken and we stop making new lower lows, the downtrend is now nullified. We either range or begin an uptrend.
We can see the lower high swing at 3.60 was broken and also retested. Buyers are coming on here.
On the daily we are now awaiting our first HIGHER LOW swing in a possible new uptrend which we could have here. This would make a head and shoulders pattern and the confirmed higher low swing once we break above the neckline at the 3.70 zone.
Overall this is looking good. We could see a move up to the 4.00 level.
GBPAUD - LONG ON RE-TRACEMENT TO 1.7950GBP has been showing strength on PM Johnson's approach to dealing with Brexit so far with positive sentiment from European counterparts.
AUD has shown weakness along with U.S.-CHINA trade war continuing to put downward pressure on the Australian export markets.

DXY, SPX: Hang on Fed & GeopoliticsIn today's #marketinsights video recording I analyse DXY and SXP!
Equities look bullish and the US index bearish, from a technical perspective. On the (geo)-political front their prices are and could remain being affected by:
- A somewhat dovish?! Fed
- BoE and Brexit (BoJo visits EU today for talks!)
- SA attack and expectations on reduced oil production
- Weakening Chinese data
- US-Sino tradewar optimism
On the other hand, don't forget that policy-pessimism is going to matter most?!
Stavros Tousios
Head of Investment Research
Orbex
This analysis is provided as general market commentary and does not constitute investment advice

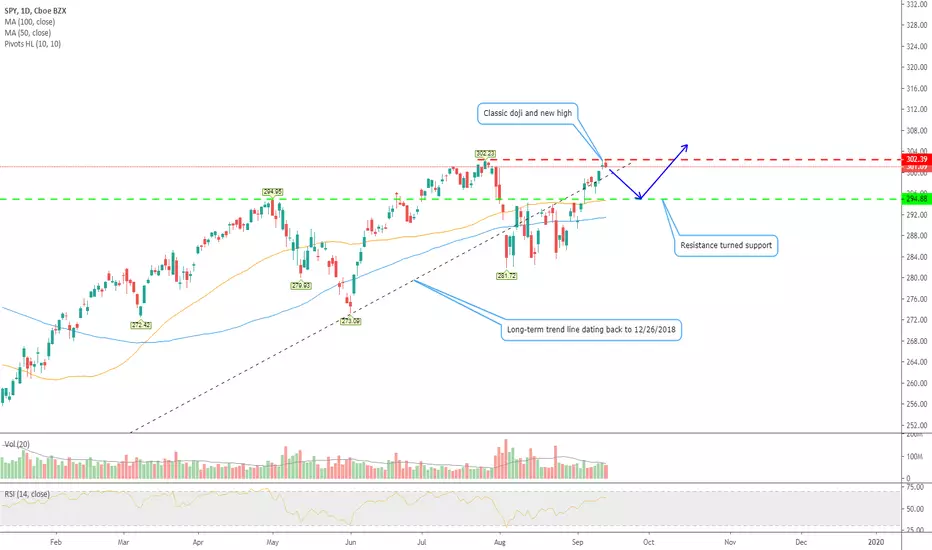
SPY - Daily - Bearish engulfing stick after dojiNotice the bearish engulfing candlestick today, after the doji yesterday? I believe that means we are going back down to retest the green line I drew in the 295 area. We just made new highs, but could not close above the highest close level set in July. I do not believe this sell-off will be anything more than simple profit taking after this nice rip up after breaking through consolidation. More or less, I think this will be just a breather ... UNLESS, negative trade war news comes out.
As always, the trade war is determining the technicals right now. If negative news comes out between now and the new round of talks in October, I think we will bust through that green line and make a move to test a double top pattern. If that happens, look out below!
I'm overall bullish based on technicals, but bearish to start next week. I positioned my account appropriately yesterday and today to survive the profit taking.
CRUDE OIL & USD Weakness Might Send LOONIE Towards 1.29500!INSTANT ENTRY AT AROUND: 1.31800 LEVEL
POSITION TYPE: SHORT
STOP LOSS: 1.34200
TAKE PROFIT: 1.29500
RR: 1:1
SHALL THERE BE ANY UPDATES I WILL UPDATE THEM IN THE THREAD. BELOW YOU CAN FIND THE EXPLANATION BEHIND THIS TRADE SETUP
The main chart shows the price confined in a upward slopping channel on the weekly TF which has been respected on multiple occasions. At the moment we could see that the weekly candle not only breached the lower end of the channel but also close below the crucial dynamic support of the weekly 50 EMA!. This suggests that the price is ready to potentially head down towards the 1.29500 level where another concrete upward trendline is presents.
Furthermore, the sanctions imposed by U.S on iran and further ongoing dispute has already made WTI price rise higher. Further tensions are to be expected in the future which would potentially make WTI jump higher. CAD is strongly correlated with OIL prices and any move in the OIL prices would move the LOONIE in the same direction. Additionally The USD weakness will likely gather pace in the coming weeks as prospect on economic slowdown and rate cut has hit the greenback very bad.
Therefore we have at the moment both technical and fundamental picture on our sides. as the days go we will see the news develop further and see the a clear picture.

XAU/USD GOLD LONG H4,D1 12.9.2019Technical standing
Gold is in strong uptrend since breaking 6 years high in mid-June. Currently gold is in correction phase. On the H4 chart, I marked my support zone from 1480 to 1498. In today`s trading sessions we could see Gold going up too 1524 and immediaetly retracing down to 1498. Now Gold is currently sitting on 1498, top of my support zone which is lined up with trendline as you can see on given example. In further days I will be waiting for a price action signal in my support area to take gold up to 1543-1555 where I marked resistance area. If resistance area will be broken I am expecting to see Gold around 1600.
Fundamental view
Next week we expect a rate cut from FED for quater basis points, which will have a big impact on gold. As things around Brexit standing now Great Britain and EU have no deal, so Great Britain could exit from EU without deal, so I believe this scenario will help push the Gold price up. The last big global event that are correlated whit Gold is US-China Trade war on tariffs. With FED rate cut, so much indecisiveness with Brexit, US-China trade war and upcoming Global economic crisis I believe Gold will continue his uptrend.

USDCNH should complete correction before another rallyThe pair took a pause before another rally and this could mean the bad news for the global trade.

Silver - Short - Further Downside PotentialWe see Silver moving lower if it doesn't consolidate and move higher from the $18.2 support level having dropped significantly over the past few days. Easing tensions in the US/China trade war and dovish central banks as well as a recovery in the stock market have led to fall in demand for safe haven assets such as Silver.

AUDUSD LONG Trade Executed! Price Aiming for 0.69500
The above link gives you a detailed explanation behind the execution of this trade.
INSTANT LONG ENTRY AT AROUND: 0.68550 LEVEL
STOP LOSS: 0.67750
TAKE PROFIT: 0.69500
RR: 1:1
TYPE: LONG/BUY
SHALL THERE BE ANY UPDATES I WILL PROVIDE THEM IN THIS THREAD. CHEERS

Oil negative outlook (both short-term and long-term)If oil exporters don't do any thing we should wait for scary prices like 30$. As long as the trade war is deepening this is most probable scenario.
Wait for the 50$, below it differently scary...

Gold posts a double-topGold has posted a double top on the longer term time frame and displayed bearish price action. We are awaiting a pullback to 1518 area before expecting a further move to the downside to at least trend line support. As the US/China trade war seems to be calming down, and therefore expect risk-off assets i.e. gold to pull back.

Another trade war cycle almost completeAfter news broke that Trump had secured another China trade meeting for early October and solid ADP numbers we broke the range we traded in for August. Non farm payrolls was a miss but not bad enough to fall back into range. Fed Chair Powell's comments shortly after the non farm payroll miss eased concerns and setup another potential rate cut in two weeks time. Assuming CPI and PPI aren't shockingly bad I except a slow grind up heading into the FoMC meeting with expectations of rate cuts off-setting any small misses on data. The market is still pricing in a cut of 50/75 bps which is once again more than what we will probably get. Another 25 bps cut seems more likely. I am biased long on a very short term basis. Only bullish until FoMC, possibly until next trade talks in Oct as my best case scenario. I think at that point we will rinse and repeat the cycle. If we look at the VIX we've been in decline all week so its good to see the put buying frenzy subside. The front end contango is looking strong so we should see VIX ETP's drop off assuming we don't get anymore data hiccups this week. Once again I am technically bullish in this very moment, but unless we get a combination of strong data, substantial rate cut relief, and a radical reversal on trade talks I think any attempt at new highs will be short lived. Last weeks data was mixed and its likely we will see that trend continue. youtu.be

XAUUSDGold, coming off a interesting key level here. Previous levels of resistance off the monthly chart. Federal Chairman speaks on lowering the alarms for a recessives period, this gives U.S markets strength and sends stocks for a rebound and the Dollar finds artificial strength. In correlation, precious metals become less appealing as a way to hedge inflation.

Is oil buying the hype around positive trade talks?A couple weeks ago I published this descending triangle. Today, I'm republishing the same triangle, but this time with some kickers...
Fundamentally, oil doesn't seem to be buying the hype surrounding all this "good" news about trade talks resuming in October. Yesterday, oil shot up right at triangle resistance, then came right back down for a bearish pin bar (even though candle stayed green). Today, the candle is red, but making a bullish pin bar. What does oil want to do?
This commodity is highly sensitive to world economic conditions, currency valuation, and regulatory issues. However, right now the China/USA trade war is affecting oil prices the most. Supply and demand!! The 2 largest economies in the world are caught up in a tit-for-tat tariff ridden trade war. This does not bode well for oil - if the 2 largest economies slow their business down with each other due to tariffs, then less oil (fuel) will be needed to transport goods... ships, trucks, trains, etc... Not too mention, there was already concerns over too much oil supply; this trade war, in theory, increases that oil supply because not as much will be needed.
I'm going to stay neutral on oil until after the next round of trade talks in October. Then I will re-evaluate.

NFP, pound growth and goldEverything develops according to the scenario described earlier - Johnson’s defeat in Parliament is an occasion for the pound growth and its purchases. However, it’s too early to relax. Yes, the pound still has the opportunity to grow for not just a hundred points, but a thousand or even more. The key threat to the pound has not disappeared yet. So you should trade cautiously.
There is every chance that the ban on exiting without a deal will acquire the status of the law, which means Johnson will not be able to do anything. Even his brother Joe denied Johnson. So the streak of setbacks for the new prime minister is going on. But Johnson's failure is the success of the pound.
US employment data from ADP surprised us. + 195 000 with a forecast +148 000. And the data surprised us because recently the US economy has been showing more and more disturbing messages such as GDP data for the second quarter, and business activity indices, some even went below 50.
So, despite yesterday's figures from ADP, we are rather sceptical about official statistics on the US labor market. In general, today's data is more important than ever. On the one hand, weak figures will confirm investors' concerns that the US economy is losing its confidence more rapidly. And on the other hand, it will become a signal fo the Fed that it is necessary to do something. That is, the fate of the rate cut may not be decided on September 18 at the FOMC meeting, but today.
Therefore the dollar may receive a double hit, from which it will not be able to recover for a long time. That is why today we recommend selling the dollar across the entire spectrum of the foreign exchange market. But we need weak NFPs for that.
As for the trade war. The US and China negotiations were postponed. Now the date sounds like “early October.” That is, the confrontation will continue in September. So do not forget to buy gold.

Gold trend shiftsIt's gonna be the third trend shift in last three months. Price has a 10% - 15% gap with its medium to long-term trend low.
Real economic situation is tough, Trade war has been exacerbated and expectations will be more and more toward more economics risk. So the long-term trend low is gonna increase and any decrease in price would be for very short-term.

Bullish breakout... normally...Under normal market conditions, this pennant break-out would be considered very bullish. If this was a normal market, I would now think this would head up to at least retest the all-time highs. However, this is not a normal market - it is news driven in my opinion.
News broke last night that China and the USA would resume talks in October. The market loved this, and futures rose sharply. But, have talks ever stopped in the last year and a half? No, they haven't. The two countries have continued negotiations this entire time... but nobody seems to be thinking of that today. This to me is proof of a news driven market. Therefore, break-outs like this one cannot be trusted. Just my opinion...
