TRADERSAI - A.I. Powered Model Trades for Today, MON 07/01Almost every major financial news media outlet predicted the outcome of a thin-on-details "truce" on further tariffs than any substantive progress towards an agreement or a resolution to the trade war. And, yet, the overnight futures action is exuberant and indicating significant gap up in S&P 500 Index on the open.
It is highly improbable that this bidding up is coming from any institutional or smart money. When mom-and-pop individual investors seem to be leading a market move, it always ends up badly for them. Our models are not buying into the current pop in the overnight index futures and are in an indeterminate state and are staying out of the markets for the day.
Don't fret over missed potential profits - first, pay attention to hedging/minimizing the potential losses! The risk-reward profile at this level does not appear to justify jumping into these turbulent and murky waters. Let the close today guide your further assessment of the market.
Good luck with your trading this week!
Tradewar

EURUSD: Short the Pullback, AgainAs the U.S. called a truce with China on the trade war, the dollar has begun to recover together with a technically oversold dollar.
EURUSD since peaking at 1.1410 has retraced close to 10 cents after the 2nd wave of bearish movement has begun early this morning.
Since the US-China trade war has temporary halted and while the market is still anticipating whether the Fed will cut rate this month or in September later this year, the dollar is most likely to recover further thus we will probably see EURUSD dip lower below 1.13.
For intraday trade, we can wait for the price to pull back from the current bearish trend and look for sell opportunity at 1.135 which is around the bottom of the previous consolidation.

Trade-war relief - July 2019Trump and Xi Ping have come to a tariff truce at G-20 this weekend.
Trump is now using Huawei (previously blacklisted, banned, etc.) as a bargaining chip, allowing TEMPORARILY, U.S. companies to continue doing business with China's Huawei.
Here is a list of Top 20 U.S. based Huawei suppliers . I believe most of them will rally this month (July 2019).
- Percentage number next to stock symbol is the revenue exposure to Huawei
Intel (INTC) - 1%
Advanced Micro Device (AMD) - 2%
Broadcom (AVGO) - 6%
Qualcomm (QCOM) - 5%
Microsoft (MSFT)
Nvidia (NVDA)
CommScope (COMM) - 2%
Texas Instruments (TXN)
Seagate Technology (STX) - 4%
Micron Technology (MU) - 2%
Qorvo (QRVO) - 11%
Flex (FLEX) - 5%
Skyworks (SWKS) - 6%
Corning (GLW) - 2%
Analog Devices (ADI) - 3%
NeoPhotonics (NPTN) - 47%
Western Digital (WDC)
Lumentum (LITE) - 11%
II-VI (IIVI) - 8%
Finisar (FNSR) - 8%
Maxim Integrated (MXIM) - 4%
Keysight Technology (KEYS) - 2%
Marvell Technology (MRVL) - 1%
Note: Trump can go back on the Huawei deal at any time.

Avnet uptrend retreat - Hammer @50smaAVT has been in a consolidation pattern since July 10th, with a bull technicals behind.
Last candle today is a hammer. Showing buyer strength when price fell to $43.6.
Technical data
Price just below SMA(50)
Price just above SMA(200)
RSI @56 trending higher
OBV confirming trending higher
Directional move index turned positive
If we can continue above the SMA(50); that would confirm the trend.
** I recommend not buying until we see Monday sentiment after Trump's meeting with Xi.
Happy trading!
dorfmanmaster

United Health breakout above trendline resistanceUNH is looking like a great buy. Not only did it break out today above a downward trendline, but it's also near the bottom of an upward-sloping parallel channel. Fundamentals look good too, with generally positive analyst ratings and a series of recent earnings beats. Healthcare is hot right now, with its low China exposure and other sectors looking overbought. UNH next reports earnings in mid-July. Until then I expect a good medium-term bull run in UNH.

EURUSD Might Attempt An Up Move to 1.14! A LONG TRADE SETUPENTRY AT AROUND: 1.12600 LEVEL
STOP LOSS: 1.12000
TAKE PROFIT: 1.14000
RR: 1:1
On technical perspective the triangle has broken out and the price has retraced for us to go LONG here. The triangle breakout confirms that EURUSD is starting to consolidate and aim towards the weekly 50 EMA. With all the rate cut news going on and the US economy slowing, it should help this PAIR reach the 1.14000 in the near future.
shall there be any updates i will update them below. cheers

BTC update and the week to comeThis an update to my previous ideas:
Bitcoin:
Bitcoin Dominace
---------
So, either way, BTC will reach all positive targets, it's only a question of which path it takes.
The short path (above green arrow trend line) or the medium path (below green arrow).
Thick red line is the decision line and I'm quite confident BTC will at least reach this level ($9000-93xx).
Positive talks or tweets however will likely be what sends BTC to .382 ($8136).
From there - support levels become
$8100
$7200
$6200
In this path, wave 3 of the larger impulse wave (blue elliot) will begin upon one of those supports with $6200 being the most likely reversal point.

Long term vision on GOLDOn the longer timeframes (1 month) gold broke the horizontal resistance based on the top of summer 2014, July 2016 and around February 2018. For now, it looks the month candle is still trading above the resistance line but, we have one trading week left before the candle closes. So to be safe, wait for one more week, and if price is above resistance line, it's a good opportunity to open a long trade. The more aggressive traders can start building up the positions now, offcourse withe stops below the resistance line. You want to keep the risk low, because it's not been said yet that it's a real break out. Options for fake break out, or stop loss hunt, are still open.
This technical long vision also perfectly comes together with the fundamentals:
" President Donald Trump said the U.S. will impose major new sanctions on Iran Monday, days after he abruptly called off a plan for airstrikes against the Islamic Republic based on the concept of proportionality after Iran shot down a U.S. Navy drone. " - source Bloomberg
" Gold (XAU/USD-spot) closed around 1399.43 in the U.S. session Friday, soared almost +0.63% on safe-haven appeal amid U.S. allegation of oil tankers attack by Iran coupled with lingering suspense about U.S.-China trade war. A full-fledged trade/cold war is positive for tariff/imported inflation and also positive for the precious metal as an “inflation hedge”. Gold is also boosted by a deluge of soft U.S. economic data and hopes for two Fed rate cuts in 2019 and one in 2020 amid an intensifying Trump trade war and the probability of an U.S./global economic slowdown. " - by Asis Ghosh on iforex

Long July CY straddle @ 22 due to subdued volatility (IVR of 4)We are entering into a near-the-money straddle on $CY by longing the July calls and puts with a strike of $22, for a $.60 debit. The breakevens are below 21.40 and above 22.60. As a long straddle, the maximum loss occurs if the stock price S is at the strike k of $22 at maturity. Taking long positions on both of these options was very cheap because the implied volatility is incredibly subdued -- with a mere IVR of 4. The current IV30 is 11.6, compared to the historical 20 day volatility of 31.6 and rolling year volatility of 34.5.
Cypress Semiconductors has agreed on a buyout offer from German chip maker Infineon Technologies for $23.85 per share. Before this deal can be completed, however, it has to be approved by regulators from both the U.S. and China. The deal is expected to close by the end of 2019 or early 2020, but heightened trade war tensions could interfere with the deal execution and final approval procedures. Cyrpess' CEO T.J. Rodgers, stated in an interview with CNBC: “Cypress makes some fairly exotic military stuff that could give CFIUS problems, and China, of course, is looking for ways to get even with us on the trade war thing.” Chinese approval of the merger is needed for the combined entity to trade there. Combined, they make the world’s number-one automotive chip maker, so losing the significant Chinese market would be catastrophic for either company. Cypress also has large exposure to China, like many others in the semiconductor space, so growing trade uncertainty is detrimental.
This straddle play benefits from movement away from the current price of roughly $22 -- which seems to be a likely consequence of brewing trade tensions.

USA vs China / TRADE WAR $USDCNH ... Cup & Handle pattern right there in the bigger picture.
We then got a rising wedge shorter term. Why? Look at the #TradeWar and it makes perfect sense. Wait for confirmations and you got a safe setup right there ! The Trade War is going on and it´s getting harder and harder every week for both the USA and China. So guess where this pair might go?
Look at the very least for a 1:1 ratio or much more.
#Forex #Trading #FX #Finance #Money #Investing

H&S *On Watch*Trade ware heating up between US and other countries now, EFA showing strong sell pressure @ 65 level.
Possible Head and Shoulders forming. Close below 62.5 confirms H&S pattern with price target @ 60 representing over 5% downward move.

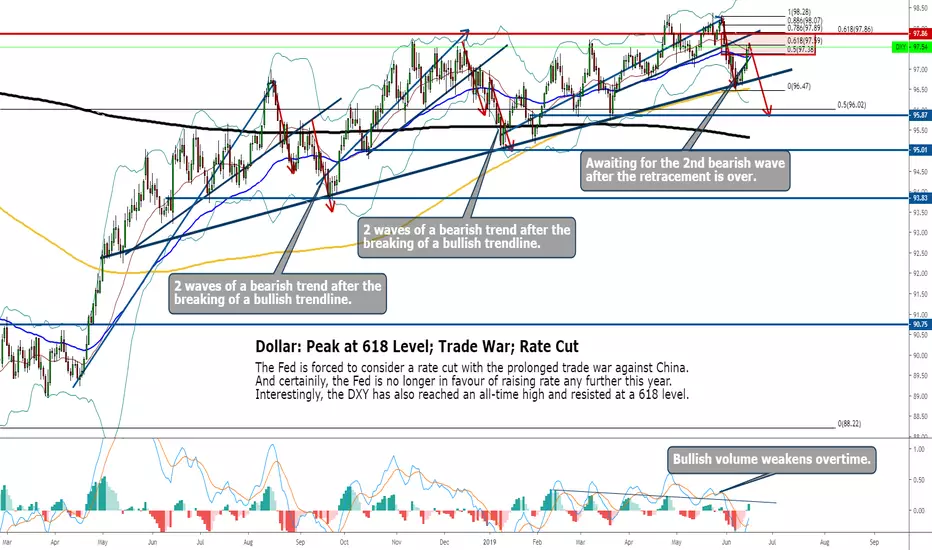
Dollar: Probably Peak; Awaiting 2nd Bearish WaveThere's very little reason now that the dollar can continue to maintain bullishly and break new high any further.
The market has given up the thoughts of any rate hike this year and instead, expecting about 2 rate cut this year.
The trade war against China has proven to bring devastating effect onto the US economy and now the Fed can no longer remain hawkish as it used to.
The dollar is also seen peaked at a 618 level, consistently rejected since late April and then the price broke a new low.
The dollar has completed the first wave of a bearish trend but the 2nd one has yet to even begin.
All eyes are now on the FOMC statement this week.
The market isn't expecting a rate cut just yet but the tone of the Fed will be extremely crucial to setting the tone of the dollar performance in the near future.
Gold: Long-Term OverviewThe mood in the market has changed drastically if we were to compare now with the beginning of 2019.
The gold has shifted into a period of consolidation as the US-China trade war took a breather.
When the trade-deal failed to pull through, it eventually led to escalating global trade risk and the US economic growth is undoubtedly affected.
The Fed hasn't been as hawkish as it were in 2018 and instead, it has turned to a dovish stance, signalling for the cutting of interest rate to sustain its economic growth which is dampened by a prolonged trade war against China.
During the period where the Fed kept raising rate in 2018, the gold saw itself losing value by a whopping 200 dollar.
Yet, the recovery started halfway through the rate hike the very moment the market has a dampening view of any further rate hike in 2019.
And just recently, the gold long position has increased drastically as the Fed has signalled the possibility of a rate cut while the dollar is also at a 2-year high, a 618 level in the weekly chart.
The dollar has peaked, the interest rate has peaked, the tension of the US-China trade war is at an all-time high, what would be the outcome of the gold price in the next few months?
If this is the direction of the current market outlook, the gold will undoubtedly rally through the last half of 2019 and into 2020.
In the meantime, we have also seen that the gold has peaked at the top of a 6-year range starting but also a sign of break above of a 3-year symmetrical triangle caused by the 5th and ongoing Elliott wave.
As seen on the chart, should the market continue to move on the track of a falling dollar, the gold price will reach 1400 in the next 2 months, 1481 by the 4th quarter and 1550 in the 1st quarter of 2020.
Note: The market is extremely volatile to market changes and any long-term view should be watched over and monitored closely for any major economic events that could lead to major changes in the market outlook and market trend.

EURCHF SHORT Swing Trade Executed! Price Aiming For 1.11700Have a look at the attached link below for the full analysis behind this trade setup:
INSTANT ENTRY: AT AROUND 1.13200 LEVEL
STOP LOSS: 1.14700
TAKE PROFIT: 1.11700
RR: 1:1
shall there be any updates i will update them here below.

YELLOW METAL Aiming For 1310 After Trendline Break. LONG TRADE!Have a look at the link below for full trade analysis behind this trade set up
INSTANT ENTRY: AT AROUND 1287.00 LEVEL
TAKE PROFIT: 1310.00
STOP LOSS: 1264.00
POSITION: BUY/LONG
RR: 1:1
The trendline was broken and now the price will likely aim at 1310.00 level where an established high is present. should the price breach that level we could opt to take this pair further LONG to next HIGHER HIGH. But for now lets just aim towards 1310 level. shall there be any updates i will provide in them below. cheers

USDJPY LONGYen pairs really took a battering last month. However, this month should see a fightback from the yen bears.
Having said this, USDJPY seems to be coming back down to the bottom of it's downtrend channel and a reversal is on the cards.
However, I would be cautious as this pair has come down very strongly forming a very bearish daily/weekly/monthly candle on the close of Friday.
I hope to see USDJPY dip further on Monday/Tuesday with signs of bulls coming in to the London/New York sessions on either day to give me confidence before going long.
Trade safe and good luck!

Will the USD/JPY test 105.00 this week?Going hand in hand with the sharp drop in US Treasury yields, which now price in a more than 95% chance of the US central bank FED cutting interest rates at least once by December 2019, the USDJPY followed and dropped below the crucial support region around 108.70.
The drop lower continued into the start of the week with the ISM Manufacturing following the US Services sector's collapse (and Canada and China's plunge), printing at a disappointing 52.1 (53.0 expected) and being its weakest since October 2016 (despite a rise in new export orders and employment).
Three of five ISM components declined, including production, inventories and supplier deliveries, and stagflation looms as prices paid rose.
In addition, the headline PMI fell to its lowest level since September 2009 as output growth eased (with output expectations crashing to the joint-lowest since records began) and new orders fell for the first time since August 2009.
What's especially noteworthy: the lowest ISM index reading during Trump's presidency was already on shakier ground even before the latest escalation of tariffs between the US and China, which definitely have the potential to pinch margins.
While the USD/JPY didn't aggressively accelerate on the downside (which indicates that most of the disappointing print was already priced in), the overall mode stays bearish.
If today's ISM Non-Manufacturing data set disappoints (in our opinion any reading below 55) too, recession fears loom again and USDJPY drops below 107.50, a stint towards 105.00, the flash crash lows from January, could be seen already in the second half of the week.
But even if we get to see a solid print, the current device seems to be 'Sell the bounce', especially if a bounce towards 109.00/20 occurs.
The mode stays bearish on a daily time-frame as long as we trade below 110.70.
Ready to start trading the live markets? Then open a free account with Admiral Markets - 8,000+ instruments to choose from, some of the market's tightest typical spreads, and the world's #1 multi-asset trading platform. admiralmarkets.com/start-trading/
Disclaimer: CFDs are complex instruments and come with a high risk of losing money rapidly due to leverage. 84% of retail investor accounts lose money when trading CFDs with this provider. You should consider whether you understand how CFDs work and whether you can afford to take the high risk of losing your money.

Chinese white paper, India in cross-hairs & Bank of Australia
China releases white paper, India in the crosshairs, Bank of Australia decision
China has maintained a paused after the US showed trade aggression, apparently, hoping to reach an agreement. Apparently, hopes were not justified. As a result, the so-called “White Paper” was born. The document, which sets out the position of China in order to negotiations with the United States on trade and economic issues. The main message is the following: China does not want a trade war with the United States, but will not avoid it if it is needed. Also, China quite clearly set forth its terms for a deal with the United States: the USA cancelling all duties on goods imported from China.
In addition, China is gradually starting to counterattack. For instance, the investigation began against FedEx Corp. the other day. Huawei accused FedEx of sending two parcels with important commercial documents to the United States. According to the results of the investigations, FedEx Corp. may fall into the list of unreliable companies.
Meanwhile, Trump is planning to open another front of the trade war - the Indian one. From June 5, the States may deprive India of the status of a country with a developing economy, which will exclude the possibility of duty-free export to the United States of more than 2,000 Indian goods.
In general, everything is bad. Morgan Stanley analysts have warned about this that further growth in trade tensions may lead to negative US economic growth as early as Q3 2019. Therefore, our recommendations are: buying safe-haven assets (gold and Japanese yen) and selling the dollar.
From the events of today, it is worth noting the Reserve Bank of Australia meeting, at which the Central Bank lowered the rate by 0.25%. This is definitely a bearish signal for the Australian dollar. Given the intensification of the trade war, while AUDUSD is below 0.70, we recommend looking for points for selling of AUDUSD on the intraday basis and the medium-term directions.
Our positions for today: we are continuing to look for points for buying of the euro and the pound against the US dollar, sales of oil and the Russian ruble, as well as buying of gold and the Japanese yen. In addition, we will buy the Canadian dollar against the US dollar.

USDJPY - Key Fibonacci Support LevelWe have seen USDJPY drop recently due to an increase in trade tensions between the US and China which has put downward pressure on the dollar and increased demand for the Yen which is a safe haven currency. Additionally, the expected rate cut in the US due to fears over the economy has put added pressure on the currency pair as the benchmark 10-year Treasury's yield is at it's lowest since September 2017 near 2%. USDJPY now sits at the Fibonnaci support level at 107.894 so we will start building a long term long position and we will be closely monitoring the currency pair as Powell Discusses Policy Strategy at the Chicago Fed Conference later today.

World war and dollar, useless bitcoin and plans for the weekDay by day the situation with a trade war is getting worse. On Friday, for example, the Mexican peso showed the strongest drop in the last seven months after the announcement of the introduction of new US duties on Mexican goods in response to the flow of illegal immigrants. It was a surprise to the markets since the agreement between the USA, Mexico and Canada did not provide for such a development of events. From June 10, duties on imports from Mexico will be 5%. But this is not the worst. If Mexico could not solve the problem of illegal immigrants, duties will gradually increase until they reach 25% by October.
Interestingly enough how the US dollar reacted to this news, which has declined significantly in the foreign exchange market against major currencies. One of the reasons for this was the revision of the market expectations of the Fed. Last week, we already noted that markets tend toward two or even three rate cuts by the end of 2019. So, after hitting Mexico, markets began to incorporate the option in which the rate would be reduced 4 (!) Times. The chance is extremely small (for now) - only 4%. But the trend is the key thing, that plays exclusively against the dollar. Our recommendation on working with the dollar for this week in the light of such events remains unchanged, we only strengthened in our desire to sell the dollar.
On Friday, Canadian GDP data was published. GDP growth was + 0.5% m / m and + 1.4% y / y when the forecast was + 0.4% m / m and + 1.2% y / y. Only events around Mexico (which call into question the fate of the USMCA, have kept it from growing but despite it, this is decently a signal in favor of buying the Canadian dollar.
Last week, the Bitcoin price rose above $ 9,000, which again grew up chatter about the prospects of its growth. We found Chainalysis Inc., information interesting, according to which only 1.3% of Bitcoin operations were carried out with the aim of serving trade and commercial activity. That says that practically ALL operations with cryptocurrency are purely speculative in its nature (90% of Bitcoin operations are exchange transactions on different exchanges). In this regard, we recall our position - any growth of Bitcoin is a reason for its sales. Current prices are the best for this.
The upcoming week promises to be difficult. Their decisions on the parameters of monetary policy will announce the Reserve Bank of Australia and the ECB, and the US will announce statistics on the labor market at the end of the week.
Our positions for today and the week as a whole are following: we will look for points for buying of the euro and the pound against the US dollar, sales of oil and the Russian ruble, as well as buying of gold and the Japanese yen. In addition, quite interesting, in our opinion, is buying of the Canadian dollar against the US dollar.

EURJPY testing critical levelThis week will be testing the uptrend line again. Trade wars still maintain JPY strength so unless some progress in negotiations happens, the pair is set to break lower. Support at the low 119. If progress is made in trade talks, hourly chart should start showing reversal patterns.

REMX (rare earth) - long opportunity once breakout happensWait till REMX breaks the descending red trendline and CMF starts heading positive. The vitals don't look great under the hood yet... but the stop is very nice just under that green multi-year support trendline.

GBPCHF: Brexit VS Endless “War” messagesBy Andria Pichidi - May 31, 2019
Sterling has hit fresh trend lows against the Dollar, Euro and Yen, among other currencies. EURGBP buying has been the latest focus of pound selling, with the cross popping upward by 20-30 pips in making a 4-month high at 0.8866. Cable carved out a fresh 5-month low at 1.2581 late yesterday, and looks set to extend this.
Given the risk of a disorderly no-deal Brexit scenario and deleterious impact the prolonged political uncertainty is having on the UK’s economy, Sterling has found itself as a natural currency to short, especially in context of a broader risk-off theme in global markets.
In the UK, there is presently a lot of jostling for position of candidates to replace Prime Minister May, who will step down at the end of next week (after President Trump’s state visit). The leadership contest will formerly commence on the week of June 10th. The new prime minister will almost certainly be either a person in favour of a hard, no-deal-if-necessary Brexit, or someone in favour only of a Brexit with a deal, such as Michael Gove, who asserts that leaving the EU without a deal on divorcing terms and outline for a future trading relationship would be irresponsible. Most likely it will be someone of the former type, Boris Johnson being the favourite, which should keep the pound’s upside potential in check.
Meanwhile, safe haven currencies remain strongly on bid, after President Trump unexpectedly announced tariffs on Mexican goods but also as China announced an “unreliable entities” list earlier today.
China looks to be digging in deeper for a protracted trade war, with state-backed radio reportedly announcing that Beijing is setting up an “unreliable entities” list comprising of foreign businesses that cut supplies to China. Beijing had promised to response to the U.S. listing of Huawei and 70 affiliates to its “Entity List,” which these companies from acquiring components and technology from US firms without government approval. China hasn’t as yet release any details of who is on its blacklist.
Hence as trade war headlines are endless, we have seen GBPCHF extending May’s drift with the another downleg, which bottomed at 1.2625 from 1.2680 .
The strong daily decline so far today along with the extension of the lower Bollinger Bands pattern and the negatively configured momentum indicators imply to the continuation of the longterm negative bias for the asset. The daily RSI is at 24 looking further to the downside, however the fact that it has crossed the oversold area suggest the possibility of consolidation in the near future. Also MACD lines have confirmed a bearish cross in the negative area.
Signs of consolidation in the near futures could be seen in the weekly chart, as the weekly candle is currently outside the Bollinger Bands, something that implies to an overextended price action.
Therefore, we might see a bit of consolidation in the near future, however the overall outlook remains bearish, with the next Support for the pair being set at 1.2530 (January 15 low) in case the asset closes today below the 1.2640 area (previously the December’s Resistance area). Resistance levels come at : 1.2757, 1.2800 and 1.2850.
Andria Pichidi
Market Analyst
Disclaimer: This material is provided as a general marketing communication for information purposes only and does not constitute an independent investment research. Nothing in this communication contains, or should be considered as containing, an investment advice or an investment recommendation or a solicitation for the purpose of buying or selling of any financial instrument. All information provided is gathered from reputable sources and any information containing an indication of past performance is not a guarantee or reliable indicator of future performance. Users acknowledge that any investment in FX and CFDs products is characterized by a certain degree of uncertainty and that any investment of this nature involves a high level of risk for which the users are solely responsible and liable. We assume no liability for any loss arising from any investment made based on the information provided in this communication. This com
