The Brightest Metal Right NowGold isn’t just shining, it’s on fire, burning through resistance levels as investors seek shelter from global chaos.
Figure 1: Gold Prices Climbing to New Highs
Gold surged past $3,000 per ounce this March, setting 16 record highs this year alone. While it took more than a decade for gold to gain 1,000 points previously, this time it took less than two years.
Figure 2: Correction in the Equities and Cryptocurrencies
In stark contrast, the S&P 500 has dropped 10% since its February peak, marking its first correction since 2023. Bitcoin has also plunged to $81,000, a 25% decline since U.S. President Donald Trump’s inauguration. The AI-driven momentum that propelled tech stocks and the broader equity market higher in 2024 appears to have faded.
Figure 3: Historical Reactions to Crisis
The correction in equities and crypto stands in sharp contrast to gold’s rally—an outcome that should come as no surprise given gold’s reputation as a safe-haven asset. Historically, financial crises and major market pullbacks have consistently triggered capital flows into gold as investors seek refuge from economic uncertainty.
This time, gold’s outperformance is driven by a “perfect storm” of prolonged geopolitical tensions, escalating trade disputes, political uncertainty under Trump’s second term, and a weakening U.S. dollar.
The CNN Business Fear & Greed Index, a widely used measure of market sentiment, has remained in the “fear” and “extreme fear” zones. This stems largely from Trump’s protectionist policies, which have sparked swift retaliation from U.S. trading partners. With new tariff headlines surfacing almost daily, the future of economic policy and inflation has become increasingly uncertain, injecting heightened volatility into global markets. This has, in turn, strengthened gold’s appeal as a hedge against instability.
Figure 4: Gold’s Demand is not Limited to Investors
According to the World Gold Council, investment demand for gold doubled year-over-year in 2024. However, central banks have been the real drivers of demand, purchasing over 1,000 tons of gold for three consecutive years; accounting for 21% of global demand in 2024.
The rising U.S. budget deficit and Trump’s "America First" policies have created additional risks for central banks holding large reserves of U.S. Treasuries. The ongoing tariff war not only undermines confidence in the U.S. as a reliable trade partner but also raises concerns about the U.S. dollar’s long-term stability as a safe-haven asset. This has accelerated the de-dollarization process, prompting many central banks to stockpile gold as a hedge against dollar exposure.
Unlike investors who may hesitate to buy gold at record highs, central banks operate based on mandates, making them less price-sensitive. They are willing to continue accumulating gold at elevated levels, reinforcing sustained demand for the precious metal.
Figure 5: A Weakening Dollar
Since most gold futures contracts are denominated in U.S. dollars, a weaker dollar makes gold relatively cheaper for non-U.S. buyers, supporting its price. This negative correlation between the two assets has been a key driver of gold’s recent surge.
The Trump administration has long argued that the U.S. dollar’s global dominance has kept it too strong for too long, hurting American manufacturers and contributing to deindustrialization. Further, a strong dollar reduces the price competitiveness of U.S. exports and has widened the trade deficit, leading the administration to pressure the Federal Reserve to cut interest rates.
While the Fed maintains its independence and data-driven approach, inflation trends continue to justify further easing. The market has already priced in three quarter-point rate cuts for this year, with expectations that the first cut could come as early as June.
Gaining Access to Gold
Historically, the London over-the-counter (OTC) market, operated by the London Bullion Market Association (LBMA), has been the largest gold trading center. Traders use the LBMA gold price as the global benchmark for gold transactions, including central bank purchases.
On the other hand, the futures market is the preferred choice for hedge funds, bullion dealers, refineries, and mints to hedge against price fluctuations. Retail investors also typically gain exposure to gold through futures contracts, most commonly via the COMEX gold futures market.
However, executing arbitrage strategies between the OTC and futures markets is capital-intensive and logistically challenging. Traditional arbitrage requires buying physical gold in the LBMA market at a lower price while simultaneously selling COMEX futures at a higher price. This involves storing, insuring, and shipping gold to COMEX-approved vaults, making it difficult to determine the fair value of the spread.
Figure 6: B3 Gold Futures Contract
A more accessible alternative is emerging: Brazil’s B3 Exchange will soon list a new gold futures contract referencing the LBMA gold price.
This new contract offers several advantages:
Easier arbitrage execution: Traders can capitalize on price discrepancies between the B3 contract and COMEX futures.
Lower capital requirements: The contract size is just one troy ounce, 1/100th of the standard COMEX contract, allowing for greater flexibility in position sizing and risk management.
Financial settlement: Both the B3 and COMEX one-ounce contracts are cash-settled, eliminating the logistical challenges of physical delivery.
Putting into Practice
Case Study 1: Arbitrage Strategy
Figure 7: Current Available Gold Futures
A comparison of the existing gold futures contracts highlights key differences in specifications, including fineness, contract size, and settlement methods. While these variations cater to the diverse needs of hedgers managing different gold inventories, they pose challenges for traders looking to establish arbitrage strategies due to mismatches in contract structures.
The introduction of B3’s new gold futures contract addresses these limitations by aligning closely with the COMEX 1-ounce gold contract. This structural similarity simplifies the process of determining fair value in spread pricing, making arbitrage strategies more feasible. The primary distinction between the two lies in their price settlement methods, which, interestingly, also forms the basis of arbitrage opportunities between futures and spot prices.
Additionally, traders can now take advantage of price discrepancies between the two LBMA daily fixing prices by utilizing the B3 Gold and TFEX Gold Online futures contracts. This expands the range of arbitrage opportunities and enhances market efficiency for gold traders.
Case Study 2: Directional Strategy
By considering all the factors – gold’s safe-haven appeal, geopolitical tensions, central banks accumulation, and a weakening dollar – we believe that this is not the end of the gold rally. An investor looking to express a bullish view on gold could do so by buying the B3 one-ounce futures contract, gaining exposure to gold’s price movements in a more accessible and cost-effective manner.
Conclusion
As global uncertainties mount, gold’s resilience remains undeniable. Whether as a hedge against inflation, a refuge from geopolitical turmoil, or a tool for strategic trading, gold continues to prove its value in times of crisis. With central banks stockpiling at record levels, the metal’s rally may still have room to run. For investors navigating today’s volatile landscape, gold is not just a safe-haven, it’s a strategic asset poised for continued strength. It is extremely timely to have new trading instruments like B3’s gold futures providing more accessible opportunities for investors.
For traders looking to enhance liquidity and capitalize on bid-ask spread, B3 also offers a market-making program. Interested participants can reach out to the exchange for further details.
Tradewars

What are Tariffs? How They Work and Why They Matter to You?For centuries, tariffs have played a crucial role in global trade, safeguarding domestic industries, shaping international relations, and influencing economic policies. While they often dominate headlines during trade wars and economic policy debates, many people still don’t fully understand what tariffs are, why they are used, and how they impact the economy.
This comprehensive guide covers:
⦿ What tariffs are and how they work
⦿ Different types of tariffs
⦿ Why governments impose tariffs
⦿ The economic, political, and social effects of tariffs.
⦿ Historical and modern examples
⦿ The debate between protectionism and free trade
⦿ Tariffs in different economic systems
⦿ The future of tariffs in a globalized world
By the end of this article, you’ll have a decent understanding of tariffs and their role in the global economy.
🤔 What Are Tariffs?
A tariff is a tax imposed by a government on imported goods and services. The primary purpose of tariffs is to increase the cost of foreign products, making domestically produced goods more attractive to consumers. This serves several economic and political functions, such as protecting domestic industries, generating government revenue, and addressing trade imbalances.
👍 How Do Tariffs Work?
A government sets a tariff rate on imported goods (e.g., 25% on foreign cars).
Importers must pay this tax when bringing goods into the country.
This increases the cost of imported goods, enhancing the competitiveness of domestic alternatives.
Domestic industries benefit from reduced foreign competition.
The government collects revenue from the tariff.
🦸♂ Who Pays the Tariff?
Importers: These businesses or individuals directly pay the tariff when they bring goods into the country. This increases their costs.
Businesses: Since importers face higher costs, businesses that rely on imported goods often pass these costs onto consumers by increasing prices.
Consumers: Ultimately, the general public bears the cost as they pay higher prices for goods affected by tariffs.
🔎 Types of Tariffs
Governments employ various tariffs depending on their economic goals and trade policies. Some of these are:
1️⃣ Ad Valorem Tariffs
An ad valorem tariff is a percentage-based tariff calculated on the value of the imported goods. The tax amount increases or decreases with the price of the product.
Example: A 10% tariff on imported TVs means a $1,000 TV incurs a $100 tariff.
Usage: Commonly used for luxury goods, automobiles, and consumer electronics.
2️⃣ Specific Tariffs
A specific tariff is a fixed fee charged per unit of imported goods, regardless of price.
Example: $3 per barrel of imported oil.
Usage: Often used for commodities like oil, wheat, and alcohol.
3️⃣ Compound Tariffs
A compound tariff includes both a percentage-based tax (Ad valorem) and a fixed fee on imports (Specific). This means importers pay a fixed fee per unit as well as a percentage of the item’s value.
Example: A 5% tax plus $2 per imported cheese wheel.
Usage: Applied to goods where both quantity and value affect the market, such as food products and industrial materials.
4️⃣ Tariff-Rate Quotas (TRQs)
A TRQ allows a limited quantity of an imported good to enter at a lower tariff rate. After the quota is reached, extra imports are taxed at a higher rate.
Example: One of the most well-known examples of a TRQ is the U.S. Sugar Tariff-Rate Quota. The United States allows a certain quantity of sugar to be imported each year at a lower tariff rate. Any sugar imports within the quota limit are subject to a low tariff (e.g., 5%).
However, once the quota is exceeded, any additional sugar imports face a much higher tariff (e.g., 20%). This system ensures that domestic sugar producers remain competitive while still allowing controlled imports to meet demand.
Another example is the European Union's TRQ on Beef Imports. The EU permits a specific amount of high-quality beef imports (e.g., from the U.S. and Canada) at a lower tariff. Once this quota is filled, any additional beef imports are taxed at a significantly higher rate. This policy helps protect EU cattle farmers while maintaining trade agreements with international suppliers.
5️⃣ Protective Tariffs
A protective tariff helps local industries by making imported goods more costly, reducing foreign competition.
Example: The U.S. imposed a 25% tariff on Chinese steel to protect domestic steel manufacturers.
Usage: Commonly used in industries facing strong foreign competition, such as steel, automotive, and textiles.
6️⃣ Revenue Tariffs
A revenue tariff is mainly designed to raise money for the government, not to shield local industries.
Example: In the 19th century, tariffs were the main source of revenue for the U.S. government before income taxes were introduced.
Usage: Often applied to goods that do not have strong domestic competition but are widely consumed, such as alcohol and tobacco.
❓ Why Do Governments Impose Tariffs?
1️⃣ Protecting Domestic Industries
Tariffs shield local businesses from cheaper foreign competitors, helping domestic industries grow.
Example: U.S. steel tariffs in 2018 benefited domestic steel manufacturers.
2️⃣ Generating Government Revenue
Before modern taxation systems, tariffs were a key source of revenue for governments.
Example: In the 1800s, tariffs accounted for 90% of U.S. federal revenue.
3️⃣ National Security Concerns
Some industries, like defense and technology, are crucial for national security, and governments impose tariffs to reduce reliance on foreign suppliers.
Example: The U.S. limits imports of rare earth minerals to ensure a domestic supply chain for defense technologies.
4️⃣ Retaliation in Trade Wars
Countries impose tariffs to address unfair trade practices or economic conflicts.
For instance, during the trade war between the United States and China, both countries imposed taxes on each other's goods
5️⃣ Preventing Dumping
Dumping occurs when a country exports goods at below-market prices to eliminate competition.
Example: The U.S. imposed tariffs on Chinese solar panels due to concerns about dumping.
⚖️ Pros and Cons of Tariffs
Pros
✅ Protects local jobs and industries
✅ Encourages domestic production
✅ Generates government revenue
✅ Enhances national security by reducing reliance on foreign goods
Cons
❌ Increases prices for consumers
❌ Can lead to trade wars and economic retaliation
❌ Encourages inefficiency in domestic industries
❌ Disrupts global supply chains
📕 Historical and Modern Examples of Tariffs
1. The Smoot-Hawley Tariff Act (1930)
The U.S. imposed tariffs on over 20k imported goods.
Result: Other countries retaliated, global trade dropped by 66%, and the Great Depression worsened.
2. Trump’s Tariffs on China (2018-2020)
The United States levied tariffs on $360 billion worth of Chinese goods.
China retaliated, affecting U.S. agriculture exports.
Result: Some U.S. industries benefited, but consumers faced higher prices.
3. The European Union’s Tariffs on U.S. Goods (2021)
The EU imposed tariffs on American whiskey, motorcycles, and jeans in response to U.S. steel tariffs.
Result: Brands like Harley-Davidson saw reduced sales in Europe.
⚙️ Tariffs vs. Free Trade: The Big Debate
The debate between tariffs and free trade is a fundamental discussion in global economics and trade policy. This debate revolves around whether governments should impose tariffs (taxes on imported goods) or embrace free trade (minimal to no restrictions on imports and exports).
◉ Free Trade (No Tariffs)
Free trade is the unrestricted movement of goods and services across borders without tariffs or other trade barriers. Advocates argue that it fosters economic efficiency and global cooperation.
✅✅ Advantages of Free Trade
Lower Prices for Consumers – Without tariffs, imported goods are cheaper, leading to more affordable products.
Increased Economic Growth – When countries trade freely, they specialize in what they do best, leading to higher productivity and economic expansion.
More Competition = Better Products – Companies must compete on quality and innovation rather than relying on government protection.
Stronger Global Relations – Open markets encourage cooperation between nations, reducing the risk of economic conflicts.
Access to More Goods and Services – Consumers enjoy a greater variety of products at lower costs.
❌❌ Disadvantages of Free Trade
Job Losses in Unprotected Industries – Domestic industries that can't compete with cheaper imports may shrink or shut down.
Dependence on Foreign Suppliers – A country may become overly reliant on other nations for essential goods (e.g., medical supplies, electronics).
Potential Trade Deficits – Countries that import more than they export may struggle with imbalances in trade.
◉ Protectionism (Using Tariffs)
Protectionism refers to economic policies that restrict imports through tariffs, quotas, or other barriers to shield domestic industries from foreign competition.
✅✅ Advantages of Tariffs
Protects Local Jobs and Industries – Domestic businesses have a better chance to compete without being undercut by cheaper imports.
Reduces Dependence on Foreign Competitors – A country can maintain its own manufacturing and production capabilities, especially in critical industries like steel, energy, and food.
Generates Government Revenue – Tariffs provide a source of income for governments, which can be reinvested in public services.
Prevents Dumping – Tariffs discourage foreign companies from flooding the market with artificially cheap goods to destroy domestic competition.
❌❌ Disadvantages of Tariffs
Higher Prices for Consumers – Since imported goods are taxed, businesses pass the extra costs to customers.
Risk of Trade Wars – When one country imposes tariffs, others retaliate, leading to economic conflicts that hurt all parties involved.
Encourages Inefficiency – Without foreign competition, domestic companies may become complacent and innovate less.
Disrupts Global Supply Chains – Many industries rely on international suppliers; tariffs can increase production costs and delays.
❇️ The Future of Tariffs in a Globalized World
As economies become more interconnected, tariffs are often seen as barriers to global trade.
Emerging industries, such as digital services, face new trade policy challenges that traditional tariffs do not cover.
With globalization, many nations favor free trade agreements (FTAs) like USMCA and the EU single market to reduce trade barriers.
Climate-related tariffs, such as carbon border taxes, may become more common as nations try to incentivize environmentally friendly trade practices.
📌 Closing Thoughts
Tariffs remain one of the most powerful - and controversial - tools in economic policy. Like a thermostat for trade, they can be adjusted to protect domestic industries, but risk overheating the economy with unintended consequences.
History shows that while tariffs can provide temporary relief for specific sectors, they often create ripple effects across the entire economy. The steel tariffs of 2018 helped some American mills reopen, but made cars and appliances more expensive for everyone.
Neither free trade nor tariffs are perfect solutions. A balanced approach, where tariffs are selectively used for strategic industries while promoting open markets in others, is often the best path.
Each country must decide based on its economic strengths and priorities. For example, developed nations might push for free trade, while developing nations use tariffs to protect growing industries.
As trade policies continue evolving, understanding tariffs gives citizens and businesses crucial insight into how globalization affects prices, jobs, and economic security. The debate isn't about whether tariffs are "good" or "bad," but rather when and how they should be used strategically.
What are your thoughts on the ongoing U.S. tariff war? Share your opinions in the comments! 📩

XAU/USD: Gold – Glittering Gains or Gilded Trap?(1/9)
Good evening, everyone! 🌙 XAU/USD: Gold – Glittering Gains or Gilded Trap?
With gold at $2,984.40, is this safe-haven star shining bright or setting up for a fall? Let’s mine the truth! 🔍
(2/9) – PRICE PERFORMANCE 📊
• Current Price: $ 2,984.40 per ounce as of Mar 14, 2025 💰
• Recent Move: Near $3,000, up from recent trends, per data 📏
• Sector Trend: Precious metals hot with trade tensions, rate cut bets 🌟
It’s a shiny ride—let’s see what’s fueling it! ⚙️
(3/9) – MARKET POSITION 📈
• Global Role: Safe-haven asset, industrial use in electronics ⏰
• Supply Dynamics: Central bank buying, mining output steady 🎯
• Trend: Geopolitical risks pushing demand, per posts on X 🚀
Firm as a rock in uncertain times! 🏦
(4/9) – KEY DEVELOPMENTS 🔑
• Trade Tensions: U.S.-China tariff threats boosting safe-haven appeal 🌍
• Rate Cuts: Fed easing bets supporting prices, per data 📋
• Market Reaction: Near record highs, showing strength 💡
Riding waves of global chaos! 🌊
(5/9) – RISKS IN FOCUS ⚡
• Economic Recovery: Could dampen safe-haven demand 🔍
• Market Sentiment: Sudden risk-on shifts might trigger a sell-off 📉
• Supply Boost: Increased mining could cap gains ❄️
It’s a glittering gamble—watch out! 🛑
(6/9) – SWOT: STRENGTHS 💪
• Safe-Haven Demand: Gold thrives in uncertainty 🥇
• Central Bank Buying: Steady support from global reserves 📊
• Green Energy: Use in renewables adds industrial demand 🔧
Got a golden edge in tough times! 🌟
(7/9) – SWOT: WEAKNESSES & OPPORTUNITIES ⚖️
• Weaknesses: High prices risk a correction if tensions ease 📉
• Opportunities: Escalating trade wars, infrastructure spending 📈
Can it break $3,000 and hold? 🤔
(8/9) – POLL TIME! 📢
Gold at $2,984.40—your take? 🗳️
• Bullish: $3,100+ soon, safe-haven rally continues 🐂
• Neutral: Steady near $3,000, risks balance out ⚖️
• Bearish: $2,800 looms, correction ahead 🐻
Chime in below! 👇
(9/9) – FINAL TAKEAWAY 🎯
Gold’s $2,984.40 price reflects safe-haven strength 📈, but it’s not cheap—volatility’s our ally. DCA-on-dips could catch a dip below $3,000 for a long-term win. Gem or bust?

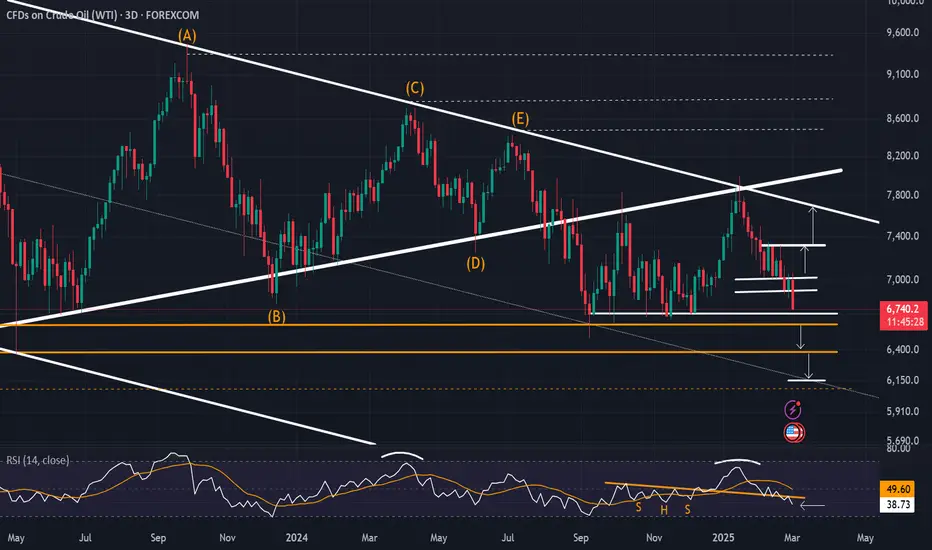
Oil Drops Below $68 Amid Trade Wars and Oversupply RisksCrude Oil drops on oversupply risks and weakening demand expectations
Key Events:
- Trade wars between the world’s largest economies heightens inflation and economic contraction risks
- OPEC plans to unwind supply cuts in April despite oversupply concerns.
- Trump - Ukraine dispute may disrupt oil's bearish trend if tensions escalate with the EU and Russia.
Key Levels:
Oil eyes a 4-year support zone ($63.80–$66), and the potential for the consolidation to extend above that zone persists.
- A close below $63.80 may extend declines to $61.50, $60, and $55 (aligning with the 0.618 Fibonacci retracement of the 2020-2022 uptrend.
- A hold above $68.80 could cap gains at $70.50, $73.50, and $75.
Upside potential on Oil is expected to remain short-lived given the bearish implications of trade wars in tandem with oil's 2022 - 2025 dominant downtrend. A clean close above 78-80 zone may reinforce longer term bullish expectations.
- Razan Hilal, CMT
DXY Holds Above 106, Currency Markets at Risk?The US Dollar Index (DXY) remains firm above the 106-mark, applying pressure on the latest currency market rebound amid escalating tariff and trade war concerns.
With the first wave of tariffs on Canada and Mexico set to take effect in early March, Trump's renewed tariff threats against the EU are further strengthening the Dollar's stance.
This has kept the EURUSD capped below 1.0530 and GBPUSD struggling at 1.27. Friday’s key inflation reports—including the German Prelim CPI and US Core PCE—are expected to introduce additional volatility risks.
🔻 Downside Scenario:
A break below 106, aligning with June 2024 highs, could expose the next support at 1.0520, coinciding with the upper boundary of the declining channel connecting lower highs from October 2023 to June 2024.
Further declines could see DXY testing 104 and 102.20, aligning with the 50% and 61.8% Fibonacci retracement levels.
🔺 Upside Scenario:
A solid close above 107.30 could reignite bullish momentum, pushing DXY towards the 2025 high of 110, potentially derailing the currency market’s 2025 rebound.
- Razan Hilal, CMT

Can Soybeans Survive the Global Trade Chessboard?In the intricate game of international trade politics, soybeans have emerged as pivotal pieces on the global economic chessboard. The soybean industry faces a critical juncture as nations like the European Union and China implement protectionist strategies in response to US policies. This article delves into how these geopolitical moves are reshaping the future of one of America's most significant agricultural exports, challenging readers to consider the resilience and adaptability required in today's volatile trade environment.
The European Union's decision to restrict US soybean imports due to the use of banned pesticides highlights a growing trend towards sustainability and consumer health in global trade. This move impacts American farmers and invites us to ponder the broader implications of agricultural practices on international commerce. As we witness these shifts, the question arises: How can the soybean industry innovate to meet global standards while maintaining its economic stronghold?
China's strategic response, which targets influential American companies like PVH Corp., adds complexity to the global trade narrative. The placement of a major U.S. brand on China's 'unreliable entity' list highlights the power dynamics involved in international commerce. This situation prompts us to consider the interconnectedness of economies and the potential for unforeseen alliances or conflicts. What strategies can businesses implement to navigate these challenging circumstances?
Ultimately, the soybean saga is more than a tale of trade disputes; it's a call to action for innovation, sustainability, and strategic foresight in the agricultural sector. As we watch this unfold, we are inspired to question not just the survival of soybeans but the very nature of global economic relationships in an era where every move on the trade chessboard can alter the game. How will the soybean industry, and indeed, international trade, evolve in response to these challenges?

Why I Believe Brent Crude Oil is Headed to $125 by 2026www.tradingview.com 1. Supply Constraints: Geopolitics & Trade Wars
One of the biggest drivers of higher oil prices is geopolitical instability and trade policy shifts. We're already seeing major disruptions that could tighten supply further:
Middle East Tensions – The ongoing conflicts in the Red Sea, Iran, and Israel continue to create uncertainty. Attacks on shipping routes and production facilities raise the cost of transporting oil and increase the risk of supply disruptions.
Russia-Ukraine War – With Russian oil facing sanctions and restrictions, global supply chains have had to adjust, making energy markets more fragile.
OPEC+ Output Cuts – OPEC has repeatedly restricted production to keep prices elevated, and there’s no indication they’ll reverse course anytime soon.
U.S.-China Trade War & Tariffs – With Trump leading in the 2024 election polls, there’s a growing possibility that tariffs on China will return. If this happens, energy trade flows could be further disrupted, and retaliatory tariffs could add to price pressures.
Strategic Petroleum Reserve (SPR) Depletion – The U.S. used a huge portion of its SPR to lower oil prices in 2022-2023, but refilling those reserves will create additional demand, pushing prices even higher.
With these factors at play, supply is becoming more constrained, making it easier for prices to rise with even small increases in demand.
2. Demand Boom: AI, Bitcoin Mining, and Agriculture
While supply is tightening, demand for energy is skyrocketing in unexpected ways.
AI Data Centers & Industrial Demand
AI computing is extremely energy-intensive, and as companies like Microsoft, Google, and Amazon continue to expand cloud computing infrastructure, demand for electricity is surging.
Many data centers still rely on fossil fuels for backup power and cooling systems, meaning oil and gas usage will continue to increase.
Bitcoin (BTC) Mining
Bitcoin mining requires massive amounts of electricity, and as BTC prices rise, mining activity expands in energy-dependent regions.
With the 2024 BTC halving, miners will have to run at full efficiency, which translates to higher global energy consumption.
Agriculture & Food Production
The world’s growing population and extreme weather events (like El Niño) are driving higher food production needs.
Fertilizer production, transportation, and machinery all require oil, meaning agricultural commodities are directly contributing to higher energy demand.
Together, these factors suggest that demand for oil is only going to increase, making it harder for supply to keep up.
3. Oil Price vs. Stock Market: The $100 Warning Zone
Historically, when oil prices get too high, the stock market struggles. Some key examples:
2008 Recession: Oil peaked at $147 per barrel, right before the financial crisis.
2018 Market Drop: When oil hit $80+, stocks sold off sharply.
2022 Inflation Shock: Oil reached $120+, leading to Fed rate hikes and market turmoil.
Why $100+ Oil is a Warning Sign for Stocks
Higher oil prices = higher inflation. This forces central banks like the Federal Reserve to keep interest rates high, making borrowing more expensive.
Energy costs impact corporate profits. Companies across multiple sectors will see shrinking profit margins as transportation and production costs rise.
Consumer spending takes a hit. Gasoline prices cut into disposable income, which weakens overall economic growth.
If Brent crude pushes above $100, expect increased market volatility and a potential selloff in equities.
4. Brent Crude Technicals: Price Targets for 2026
Current Setup
Price Holding Key Support (~$70-$74) – Brent is respecting major trendlines, signaling strong demand in this area.
Breakout Zone Around $80-$82 – If price moves above this level, it could trigger a rally to $100+.
Fibonacci Levels Align with $125 Target:
0.618 Fib retracement at $106 → First major resistance.
0.786 Fib extension at $119 → Likely next target.
1.272 Fib extension near $125 → Final upside target for 2026.
This technical setup aligns with macro fundamentals and historical oil cycles, making a move to $125 increasingly probable.
5. Investment & Trading Strategy
Long-Term Bullish Strategy
Accumulation Zone: $70-$74 (solid support).
Upside Targets: $106, $119, $125.
Stop Loss Consideration: Below $68 (invalidates thesis).
Hedging Against Market Risk
SPX Put Options / VIX Calls – If oil rises toward $100+, consider hedging against an equity downturn.
Energy Stocks (XLE, Exxon, Chevron) – These stocks tend to outperform during oil bull markets.
Gold & Commodities – Hard assets often rally when energy prices increase.
Conclusion: The Path to $125 Brent Oil
Geopolitical instability + supply cuts = higher prices.
AI, Bitcoin, and food production = rising demand.
If oil approaches $100, watch for an equities pullback.
While no forecast is perfect, all signs point to oil prices rising into 2026. If this trend plays out, investors should be prepared for higher inflation, tighter Fed policy, and increased market volatility.
Would love to hear your thoughts—do you think oil will hit $125, or are we headed lower? 🚀📊

Trump’s Trade War Risks Throwing Markets into Chaos. TARIFFic?Apparently, Trump has slapped Mexico, Canada and China with hefty tariffs. Now all these three are either already retaliating with their own levies on US goods or getting ready to do so. The complex interplay of back-and-forth tariffs risks turning friends into foes and driving up prices. All the while the end consumer is likely to cover the difference.
President Donald Trump on Saturday actually went ahead and did what he wanted to do. He launched the game of tariffs. He hit Mexico, Canada and China with hefty import duties, threatening to throw the world’s trade into a spiral of ill intentions, retaliations and higher prices for your Stanley cups and iPhones.
The looming destabilization is already coming from both ends — Canada swiftly imposed 25% levies on roughly $20 billion of US goods coming into the country on Tuesday. Another $85 billion worth of goods are getting the same treatment within the next three weeks.
China, where nearly everything you get your hands on is made, said it will “take necessary countermeasures to defend its rights and interests.”
Trump’s new order requires Canada and Mexico to pay 25% tariffs on imports to the US (with a partial carve out for Canada’s energy and oil exports — 10% levies apply there). The US President was gearing up for a 60% tariff rate on China while he was running for office but said he’s imposing a 10% tariff that will likely get higher in time.
These three countries in 2023 collectively accounted for about 40% of all US imports. That year, the US imported about $3.85 trillion worth of goods. In November 2024, the US pulled in about $351 billion worth of stuff and then sold it to Americans.
What are tariffs and who pays them?
At the basic level, tariffs are a way for an economy to protect itself from foreign competition. Through tariffs, domestic businesses are somewhat shielded from outside interference and can snatch up a bigger portion of the local market.
Tariffs are just taxes placed on products that are made overseas and then imported to the country. Here’s the kicker: the foreign companies that make these goods and then import them aren’t on the hook for paying the tariffs — American businesses are.
Tech companies like Apple AAPL , which makes about 95% of its stuff in China, or Tesla TSLA , which makes half of its cars in China, will end up paying more for their products as they come into the US. Who’s collecting that import duty? The US government.
What could happen when these tariffs get cracking?
The US consumer will most likely cover the difference. Nearly every product will be affected — from cars to baby toys to the already expensive eggs (can egg prices get even higher?)
Here’s an example: potash, the product that’s used by US farmers as fertilizer, just got 25% more expensive. That extra cost, paid by the farmers, is likely to trickle down to the end consumer so farmers could keep trucking and produce at the same rates.
What could happen to the stock market?
One thing is certain — the companies that don’t pass on the added cost to the consumer will see their corporate profits dwindle. But if they want to keep generating value for shareholders, they’ll need to pass it forward to the end user. With the first quarter now well under way, the next earnings season will be a sight to see. (Friendly reminder to keep an eye on the economic calendar for all corporate earnings and updates.)
An analysis from Barclays estimates that all S&P 500 companies could see their profits shrink by 2.8% once the tariffs get in full flow.
Perhaps a bigger, scarier fallout is possible. Inflation can perk up again. Inevitably, the higher costs across the border risk undoing what the Federal Reserve was doing to combat inflation.
Goldman Sachs came out with the forecast that the looming tariffs could have an initial knock on effect on inflation to the tune of 0.7% to the upside. Gross domestic product could drop 0.4%.
And most of all, there’s one thing investors fear the most. Rising inflation could bring back interest rate hikes. A revival in consumer prices might prompt the Federal Reserve to walk back its intentions of more interest rate cuts and lean against the economy by raising borrowing costs.
There are early signs of this already. Fed chief Jay Powell last week said the central bank is in a wait-and-see phase as Trump’s policies unfurl.
The scary tariffs already knocked the wind out of stocks and crypto. Monday morning saw one of its worst openings in years, especially for Ethereum ETHUSD . The second-largest coin fell as much as 27% from the get-go as the bullish sentiment was nowhere to be seen.
Bitcoin BTCUSD also got a slap losing 6% in its first deals to settle near $91,000 before paring back some of the drop. And stock futures were looking at steep declines with Dow futures DJI shedding as much as 700 points ahead of the opening bell in New York. The only winner was the US dollar DXY , which stands to gain popularity in a high-tariff environment.
Until now, the market has been overwhelmingly on Trump’s side. He stepped into the White House riding on the promises of a strong economy and booming business. But if he takes aim (even indirectly) at shareholders’ profits, he might end up losing the support of all those billionaire executives who worked hard to get him elected.
What do you think? Is Trump acting in the best interest of America or is he driving markets into a ditch? Share your thoughts below!

Can the Yuan Dance to a New Tune?In the intricate ballet of global finance, the Chinese yuan performs a delicate maneuver. As Donald Trump's presidency introduces new variables with potential tariff hikes, the yuan faces depreciation pressures against a strengthening U.S. dollar. This dynamic challenges Beijing's economic strategists, who must balance the benefits of a weaker currency for exports against the risks of domestic economic instability and inflation.
The People's Bank of China (PBOC) is navigating this complex scenario with a focus on maintaining currency stability rather than aggressively stimulating growth through monetary policy easing. This cautious approach reflects a broader strategy to manage expectations and market reactions in an era where geopolitical shifts could dictate economic outcomes. The PBOC's recent moves, like suspending bond purchases and issuing warnings against speculative trades, illustrate a proactive stance in controlling the yuan's descent, aiming for an orderly adjustment rather than a chaotic fall.
This situation provokes thought on the resilience and adaptability of China's economic framework. How will Beijing reconcile its growth ambitions with the currency's stability, especially under the looming shadow of U.S. trade policies? The interplay between these two economic giants will shape their bilateral relations and influence global trade patterns, investment flows, and perhaps even the future of monetary policy worldwide. As we watch this economic dance unfold, one must ponder the implications for international markets and the strategic responses from other global players.

75: China Export Analysis - Fundamental and Technical OverviewThe European Union (EU) and the United States have increased scrutiny and imposed higher tariffs on Chinese imports, particularly electric vehicles and strategic materials like gallium and germanium. These measures are designed to protect domestic industries from what are perceived as unfair trade practices and subsidies by the Chinese government.
Additionally, the EU's new Critical Raw Material Act and battery regulations aim to reduce dependency on Chinese imports and secure supply chains for critical technologies. These regulatory changes have led to a noticeable decline in Chinese exports to the EU.
In response, China has imposed export restrictions on key materials, further straining trade relations. These geopolitical tensions and trade barriers have significantly impacted China's export figures.
Currently, China's export trend is showing a downward trajectory. The export figures have struggled to reach the $350 billion mark and are at risk of dropping significantly lower, potentially towards the $140 billion level.
Chart Overview:
Trend Line: A clear downtrend is visible on the chart, with lower highs and lower lows indicating sustained pressure.
Support and Resistance Levels:
Resistance: The $350 billion level is the upcoming resistance. That has not yet been reached.
Support: Immediate support is observed around $250 billion. A break below this level could accelerate the downward move towards $140 billion.
Will We Reach $350 Billion or Go Lower?
Given the current economic and geopolitical landscape, it seems still likely that China will reach the $350 billion export mark in the near term because there has not been a really corrective wave in the chart. But the downward pressure from increased tariffs, export restrictions, and the EU's push for supply chain independence are significant hurdles. If these conditions persist, a further decline is a plausible scenario.

REMX Vaneck ETF - Trade WarsGuess who produces most of the world rare earth magnets which we need for electronics like phones, computers and many other things. China China China.
Guess which ETF saw all time high spike in volume yesterday. Not advice. DYOR. #tradewar
Robinhood Signup:
share.robinhood.com

USD/CNY- How China deals with a US trade tariffs. Simple- Chinese Yuan currency devaluation by stealth over time against all major trading partners. Effectively, eliminating the effects of the trade tariff altogether.

39.7 is possibleTechnically it's possible. Very very critical weekend. If it breaks..
Reversal H&S target is 39.7
Why?
- Corona virus
- Middle east is burning ( Turkey & Russia)
- Trade wars. ( )
See you in 39.7, other targets are on chart.

Welcome to the trade war! Montly chart of usdchn, we're just in the beginning of a trade war, future is not bright.
Follow lines for target point and stop.

USDCNH - US Dollar vs Chinese Yuan - Trump wins in short term- RSI divergency
- Divergência IFR
- must break support @ 7.10
- precisa romper suporte em 7,10
- another support @ 7.00 (weak)
- outro suporte em 7,00 (fraco)
- major support @ 6.93 + 200 days ema - TARGET
- alvo no suporte em 6,93 junto da mme 200 dias.

Trade War headlines waning?The days of Trade War headlines viciously bringing down markets may be over.
"Listen here grandson, back in my day a headline about the Trade War could drop spoos 1% or 2%"
Two days of headlines. Both recoveries. Also my thoughts on why: twitter.com

ORBEX: EURJPY, GBPCHF - US-EU Tradewar Begins, BoJo Submits PlanIn today's #marketinsights video recording I analyse #EURJPY and #GBPCHF
#EURJPY looking bullish on:
- Expectations of further BoJ easing
- Poor JP consumer confidence
- Soft BoJ monetary base
- Good German PMIs and EA Inflation
#GBPCHF looking bearish on:
- Expectations of a strong franc
- Poor UK construction PMI
- Fresh BoJo proposal sentiment
Stavros Tousios
Head of Investment Research
Orbex
This analysis is provided as general market commentary and does not constitute investment advice

NIO: High Volume, Low OutcomeNIO Inc, the electric vehicle manufacturer in China, is having a rough time. It's been a little less than a year since the NYSE debut, and the stock has now lost more than 80% of its market value. The crackdown on US-listed Chinese companies has only hurt the company further, with one of the largest single-day losses in the company's history.
Where do we go from here?

DIGITAL GOLD - REAL REASON WHY BITCOIN IS UPTRADING. Bitcoin is following Gold as both assets are seen as a form of Hedge
against the various governments and monetary policies.
Especially in the uncertainty caused by the Trade war
the decentralized nature of Bitcoin
and the fact that Bitcoin has been accepted lately by the financial institutions
are some of the reasons why we have seen this incredible rise this year.
As long as this Trade War goes on we would still see Bitcoin and Gold rise in this visual correlation.

TRADE TENSIONS COULD DRAG NASDAQ100 THE DOWNSIDE NO TRADE DEAL WILL BE ACCOMPLISHED IN 2019 BETWEEN CHINA AND US

CAT Sensitive to Tariffs & Trade WarsHuge growth in 2016 as speculative anticipation of more sales to China & other developing industrialization nations occurred. Unsupported by Fundamental & Technical support and resistance levels. Now in a sideways pattern, inevitably selling down toward a Business Bear Cycle pattern. Weekly chart view.

SPX to crest over 3k and then down3045 is the magic number. This represents a 2.618 advancement from the 2009 low.
The 4.618 is 3953 so good chance we see 2500 and even 2100 before we see 4000.
My prediction is as follows:
SPX reaches and breaches 3000. Maybe gets as high as 3150 before pull back begins.
Green box - 2870 or so is short target #1
From here we will need to see what the market looks like, but if the trade war hasn't yet been resolved, the yellow and orange boxes can come into play.

Sell AUD VS USD: False break above 0.7000 to go back to 0.6860Follow the well defined channel.
also, the break above 0.70 this week is proving to be a shooting star (bearish)
Trade war agreement will take time and therefore AUD will suffer along with risk.
Sell now to retest 0.6860...
