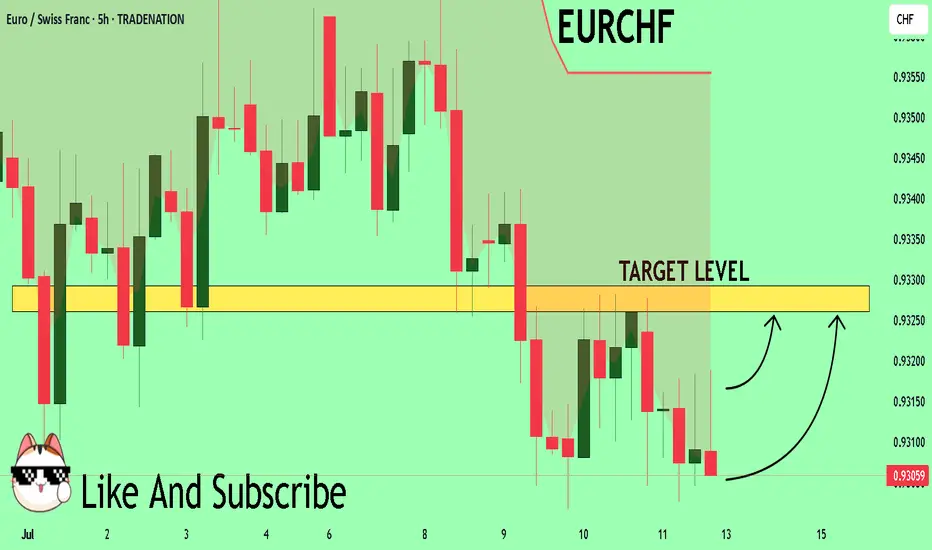
EURCHF On The Rise! BUY!
My dear subscribers,
This is my opinion on the EURCHF next move:
The instrument tests an important psychological level 0.9305
Bias - Bullish
Technical Indicators: Supper Trend gives a precise Bullish signal, while Pivot Point HL predicts price changes and potential reversals in the market.
Target - 0.9326
About Used Indicators:
On the subsequent day, trading above the pivot point is thought to indicate ongoing bullish sentiment, while trading below the pivot point indicates bearish sentiment.
Disclosure: I am part of Trade Nation's Influencer program and receive a monthly fee for using their TradingView charts in my analysis.
———————————
WISH YOU ALL LUCK
Trading
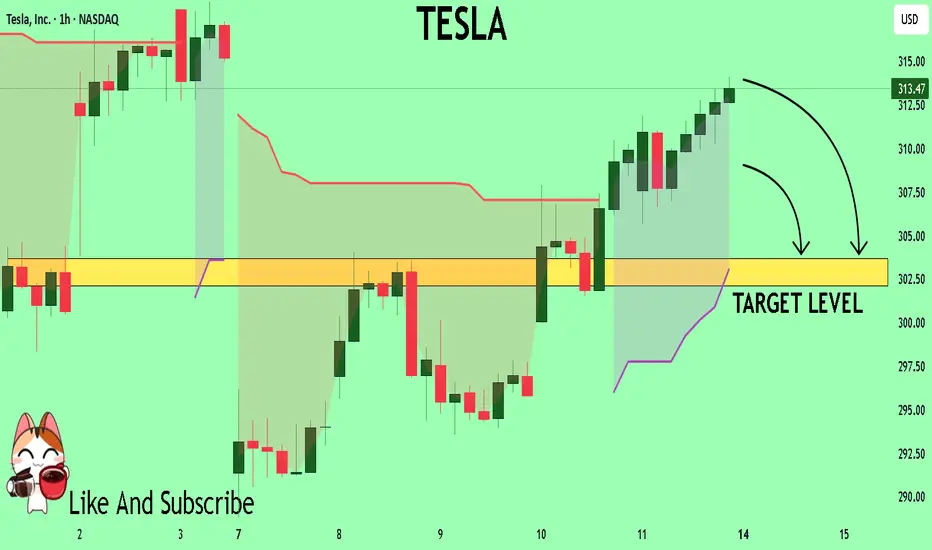
TESLA My Opinion! SELL!
My dear friends,
Please, find my technical outlook for TESLA below:
The price is coiling around a solid key level - 313.47
Bias - Bearish
Technical Indicators: Pivot Points Low anticipates a potential price reversal.
Super trend shows a clear sell, giving a perfect indicators' convergence.
Goal - 303.67
About Used Indicators:
The pivot point itself is simply the average of the high, low and closing prices from the previous trading day.
Disclosure: I am part of Trade Nation's Influencer program and receive a monthly fee for using their TradingView charts in my analysis.
———————————
WISH YOU ALL LUCK
Weekly Close Watch: Bitcoin’s Key Level Could Shift the ChartsGood morning, Guys
There's only 1 day and 13 hours left until the weekly Bitcoin candle closes.
It's crucial that this candle closes above the 112,331 level with strong volume. Anyone experienced in economics and technical analysis knows just how significant this is.
If we get that close above the level, I’ll share a powerful analysis with a clear target.
I want to sincerely thank everyone who’s been supporting my analyses with likes—your support is
my biggest source of motivation when it comes to sharing content.
Much love to you all—we’re more than just a community, we’re a family. 💛

BTC's increasing fomo force will push the price up furtherCRYPTO:BTCUSD just broke the important resistance zone and trendline around 110000. This price increase to create a new ATH will create a large amount of FOMO in the market pushing BTCUSD to increase more than half. 116,000 FIbonacci extension points are considered the immediate Target for the uptrend.
Waiting for retests to the support zone for the trend-following BUY strategy.
Support: 110000-107500
Resistance: 116000
Buy zone: 110000 ( support + trendline)
Buy Trigger: break above 112000
Leave your comments on the idea. I am happy to read your views.

US500 Is Bullish! Long!
Here is our detailed technical review for US500.
Time Frame: 3h
Current Trend: Bullish
Sentiment: Oversold (based on 7-period RSI)
Forecast: Bullish
The market is trading around a solid horizontal structure 6,252.40.
The above observations make me that the market will inevitably achieve 6,297.19 level.
P.S
Overbought describes a period of time where there has been a significant and consistent upward move in price over a period of time without much pullback.
Disclosure: I am part of Trade Nation's Influencer program and receive a monthly fee for using their TradingView charts in my analysis.
Like and subscribe and comment my ideas if you enjoy them!

USDJPY Is Very Bearish! Short!
Take a look at our analysis for USDJPY.
Time Frame: 9h
Current Trend: Bearish
Sentiment: Overbought (based on 7-period RSI)
Forecast: Bearish
The market is testing a major horizontal structure 147.419.
Taking into consideration the structure & trend analysis, I believe that the market will reach 146.283 level soon.
P.S
Please, note that an oversold/overbought condition can last for a long time, and therefore being oversold/overbought doesn't mean a price rally will come soon, or at all.
Disclosure: I am part of Trade Nation's Influencer program and receive a monthly fee for using their TradingView charts in my analysis.
Like and subscribe and comment my ideas if you enjoy them!

NG1! SHORT FROM RESISTANCE
NG1! SIGNAL
Trade Direction: short
Entry Level: 3.356
Target Level: 3.150
Stop Loss: 3.493
RISK PROFILE
Risk level: medium
Suggested risk: 1%
Timeframe: 2h
Disclosure: I am part of Trade Nation's Influencer program and receive a monthly fee for using their TradingView charts in my analysis.
✅LIKE AND COMMENT MY IDEAS✅

EURUSD: Detailed Support & Resistance Analysis 🇪🇺🇺🇸
Here is my latest structure analysis and important
supports and resistances for EURUSD for next week.
Consider these structures for pullback/breakout trading.
❤️Please, support my work with like, thank you!❤️
I am part of Trade Nation's Influencer program and receive a monthly fee for using their TradingView charts in my analysis.

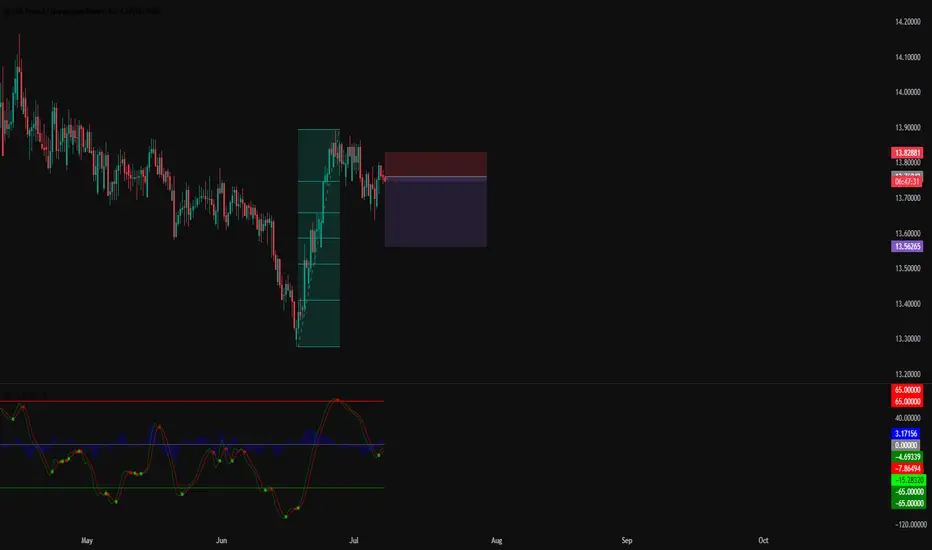
#008: GBP/NOK SHORT OPPORTUNITY
Hi, I'm Forex Trader Andrea Russo and today I want to show you this GBP/NOK SHORT opportunity. After a strong upside extension, GBP/NOK is showing signs of exhaustion just below the key resistance zone of 13.83. I thank in advance my Official Broker Partner PEPPERSTONE for the support in writing this article.
📍 Technical Context
The pair has recently formed a local double top with declining bullish momentum. Price action around the highs is becoming increasingly choppy, suggesting the presence of smart investors preparing a possible reversal.
A clear rejection from the 13.82-13.83 zone triggered the short setup, with confirmation coming from broader market dynamics and a favorable risk/reward structure.
🔍 Macro Overview
The British pound remains under pressure as uncertainty over the Bank of England's next rate decision weighs on the currency.
The Norwegian krone finds support in stable oil prices and expectations of relatively tight monetary policy.
This macro imbalance creates a favorable backdrop for a potential downside continuation.
This setup aligns both technical exhaustion and cross-market forces, while sentiment data reveals a bearish bias among retail on GBP/NOK, often a good time to ease pressure.
🔄 Next Steps
As always, I will be monitoring the price action on a candle-by-candle basis. If the downside momentum confirms, the pair could retest the 13.56 support in the coming sessions.
📌 Stay tuned for live updates and trade management.
AUD_JPY IS OVERBOUGHT|SHORT|
✅AUD_JPY is trading in a strong
Uptrend but the pair is now
Locally overbought so after the
Pair hits the horizontal resistance
Level of 97.350 we will be expecting
A pullback and a bearish correction
On Monday!
SHORT🔥
✅Like and subscribe to never miss a new idea!✅
Disclosure: I am part of Trade Nation's Influencer program and receive a monthly fee for using their TradingView charts in my analysis.

GBP-CHF Bearish Breakout! Sell!
Hello,Traders!
GBP-CHF is trading in a strong
Downtrend and the pair
Broke the key horizontal
Level around 1.0780 which
Reinforces our bearish
Bias and we will be
Expecting a further
Bearish move down
On Monday!
Sell!
Comment and subscribe to help us grow!
Check out other forecasts below too!
Disclosure: I am part of Trade Nation's Influencer program and receive a monthly fee for using their TradingView charts in my analysis.

EUR_CAD GROWTH AHEAD|LONG|
✅EUR_CAD went down to retest
A horizontal support of 1.5964
Which makes me locally bullish biased
And I think that a move up
From the level is to be expected
Towards the target above at 1.6040
LONG🚀
✅Like and subscribe to never miss a new idea!✅
Disclosure: I am part of Trade Nation's Influencer program and receive a monthly fee for using their TradingView charts in my analysis.

EUR-AUD Bullish Bias! Buy!
Hello,Traders!
EUR-AUD went down but
A strong horizontal support
Level is below around 1.7690
And as the pair is trading in
An uptrend we will be expecting
A round and a move up
On Monday!
Buy!
Comment and subscribe to help us grow!
Check out other forecasts below too!
Disclosure: I am part of Trade Nation's Influencer program and receive a monthly fee for using their TradingView charts in my analysis.

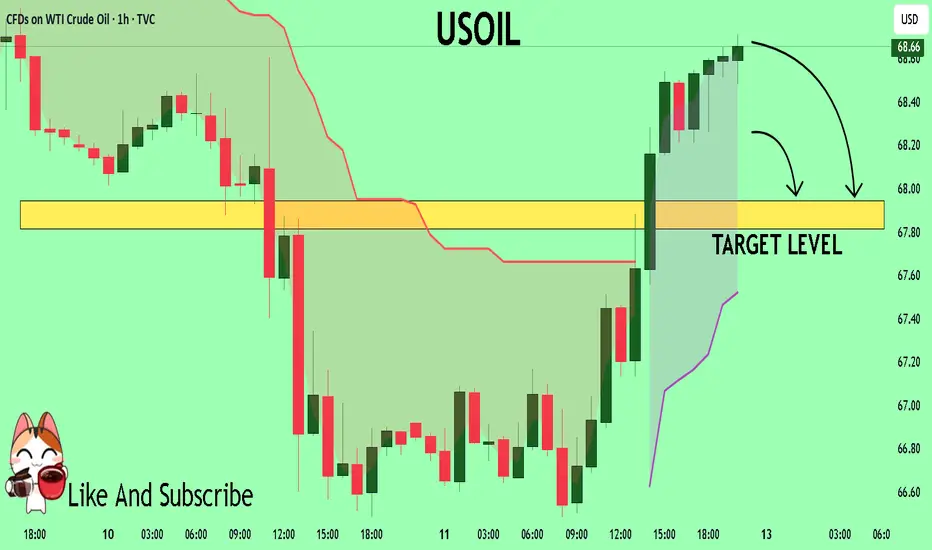
USOIL: Local Bearish Bias! Short!
My dear friends,
Today we will analyse USOIL together☺️
The market is at an inflection zone and price has now reached an area around 68.669 where previous reversals or breakouts have occurred.And a price reaction that we are seeing on multiple timeframes here could signal the next move down so we can enter on confirmation, and target the next key level of 67.925..Stop-loss is recommended beyond the inflection zone.
❤️Sending you lots of Love and Hugs❤️

NG1!: Strong Growth Ahead! Long!
My dear friends,
Today we will analyse NG1! together☺️
The price is near a wide key level
and the pair is approaching a significant decision level of 3.377 Therefore, a strong bullish reaction here could determine the next move up.We will watch for a confirmation candle, and then target the next key level of 3.408.Recommend Stop-loss is beyond the current level.
❤️Sending you lots of Love and Hugs❤️

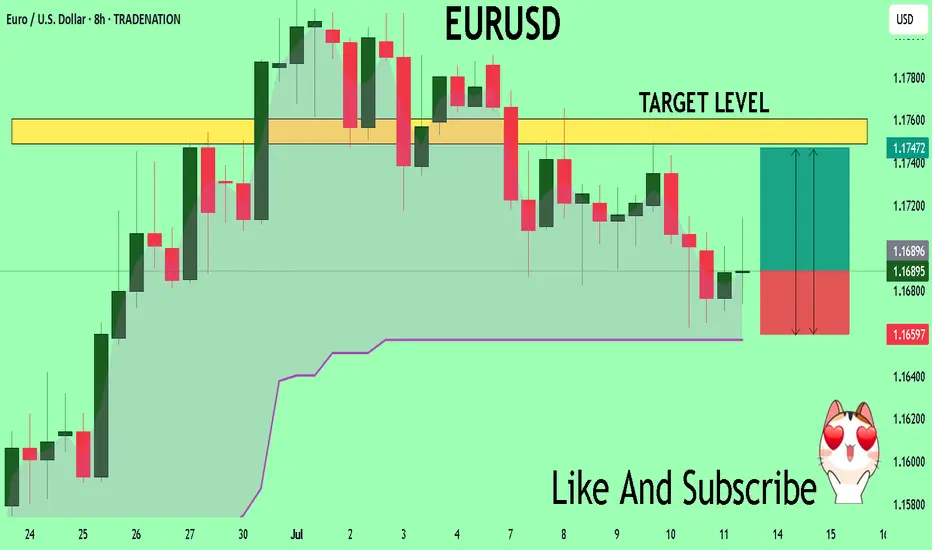
EURUSD Trading Opportunity! BUY!
My dear subscribers,
This is my opinion on the EURUSD next move:
The instrument tests an important psychological level 1.1689
Bias - Bullish
Technical Indicators: Supper Trend gives a precise Bullish signal, while Pivot Point HL predicts price changes and potential reversals in the market.
Target - 1.1748
My Stop Loss - 1.1659
About Used Indicators:
On the subsequent day, trading above the pivot point is thought to indicate ongoing bullish sentiment, while trading below the pivot point indicates bearish sentiment.
Disclosure: I am part of Trade Nation's Influencer program and receive a monthly fee for using their TradingView charts in my analysis.
———————————
WISH YOU ALL LUCK
NI225: Will Go Up! Long!
My dear friends,
Today we will analyse NI225 together☺️
The recent price action suggests a shift in mid-term momentum. A break above the current local range around 39,581.12 will confirm the new direction upwards with the target being the next key level of 39,719.48 and a reconvened placement of a stop-loss beyond the range.
❤️Sending you lots of Love and Hugs❤️

USOIL Will Collapse! SELL!
My dear subscribers,
USOIL looks like it will make a good move, and here are the details:
The market is trading on 68.66 pivot level.
Bias - Bearish
Technical Indicators: Both Super Trend & Pivot HL indicate a highly probable Bearish continuation.
Target - 67.95
About Used Indicators:
The average true range (ATR) plays an important role in 'Supertrend' as the indicator uses ATR to calculate its value. The ATR indicator signals the degree of price volatility.
Disclosure: I am part of Trade Nation's Influencer program and receive a monthly fee for using their TradingView charts in my analysis.
———————————
WISH YOU ALL LUCK
USDJPY: More Growth Ahead! 🇺🇸🇯🇵
USDJPY broke and closed above a minor daily resistance
with a confirmed BoS.
The next strong resistance is 148.0
It is going to be the next goal for bulls.
❤️Please, support my work with like, thank you!❤️
I am part of Trade Nation's Influencer program and receive a monthly fee for using their TradingView charts in my analysis.

Learn the 3 TYPES of MARKET ANALYSIS in Gold Forex Trading
In the today's post, we will discuss 3 types of analysis of a financial market.
🛠1 - Technical Analysis
Technical analysis focuses on p rice action, key levels, technical indicators and technical tools for the assessment of a market sentiment.
Pure technician thoroughly believes that the price chart reflects all the news, all the actions of big and small players. With a proper application of technical strategies, technical analysts make predictions and identify trading opportunities.
In the example above, the trader applies price action patterns, candlestick analysis, key levels and 2 technical indicators to make a prediction that the market will drop to a key horizontal support from a solid horizontal resistance.
📰2 - Fundamental Analysis
Fundamental analysts assess the key factors and related data that drive the value of an asset.
These factors are diverse: it can be geopolitical events, macro and micro economic news, financial statements, etc.
Fundamental traders usually make trading decision and forecasts, relying on fundamental data alone and completely neglecting a chart analysis.
Price action on Gold on a daily time frame could be easily predicted, applying a fundamental analysis.
A bearish trend was driven by FED Interest Rates tightening program,
while a strong bullish rally initiated after escalation of Israeli-Palestinian conflict.
📊🔬 3 - Combination of Technical and Fundamental Analysis
Such traders combine the principles of both Technical and Fundamental approaches.
When they are looking for trading opportunities, they analyze the price chart and make predictions accordingly.
Then, they analyze the current related fundamentals and compare the technical and fundamental biases.
If the outlooks match , one opens a trading position.
In the example above, Gold reached a solid horizontal daily support.
Testing the underlined structure, the price formed a falling wedge pattern and a double bottom, breaking both a horizontal neckline and a resistance of the wedge.
These were 2 significant bullish technical confirmation.
At the same time, the escalation of Israeli-Palestinian conflict left a very bullish fundamental confirmation.
It is an endless debate which method is better.
Each has its own pros and cons.
I strongly believe that one can make money mastering any of those.
Just choose the method that you prefer, study it, practice and one day you will make it.
❤️Please, support my work with like, thank you!❤️
I am part of Trade Nation's Influencer program and receive a monthly fee for using their TradingView charts in my analysis.

S&P 500 Daily Chart Analysis For Week of July 11, 2025Technical Analysis and Outlook:
During this trading week, the S&P 500 Index has shown a predominantly downward/upward course of action and created a new Key Resistance at 6280. Currently, the index exhibits a bullish bias, with the Outer Index Rally objective set at 6420. However, it is crucial to note that the current price action may cause prices to see in a new light from their current fluctuation to push toward the Mean Support at 6200 before resuming their upward movement.

EUR/USD Daily Chart Analysis For Week of July 11, 2025Technical Analysis and Outlook:
In this week's trading session, as expected, the Euro continued its decline, reaching our Mean Support level of 1.168. Recent analyses suggest that the Euro is likely to experience a further downward trend, with the next target set at the Mean Support level of 1.160. However, it's essential to consider the possibility of a rebound toward the Key Resistance level of 1.181, which could lead to the completion of an Outer Currency Rally reaching 1.187.

Bitcoin(BTC/USD) Daily Chart Analysis For Week of July 11, 2025Technical Analysis and Outlook:
In the last week's trading session, Bitcoin has demonstrated a significant surge, achieving historical prices as anticipated by TSS for an extended period. The cryptocurrency has successfully completed both the Outer Coin Rally 114500 and the Inner Coin Rally 118200. Presently, Bitcoin is poised to celebrate this notable accomplishment with a victory lap, but it may face a potential downward trajectory, targeting the Mean Support level of 112000. This anticipated decline will necessitate the resilience to a retest of Inner Coin Rally 118200. The designated targets for the Outer Coin Rally at this juncture are 122000, 126500, 132200, and 135000.
